Multi-wavelength Observations of the Binary System PSR B125963/LS 2883 around the 2014 Periastron Passage
Abstract
We report on the results of the extensive multi-wavelength campaign from optical to GeV -rays of the 2014 periastron passage of PSR B125963, which is a unique high-mass -ray emitting binary system with a young pulsar companion. Observations demonstrate the stable nature of the post-periastron GeV flare and prove the coincidence of the flare with the start of rapid decay of the H equivalent width, usually interpreted as a disruption of the Be stellar disk. Intensive X-ray observations reveal changes in the X-ray spectral behaviour happening at the moment of the GeV flare. We demonstrate that these changes can be naturally explained as a result of synchrotron cooling of monoenergetic relativistic electrons injected into the system during the GeV flare.
Keywords:
gamma rays: stars – pulsars: individual: PSR B125963 – stars: emission-line, Be – X-rays: binaries – X-rays: individual: PSR B1259631 Introduction
In the binary system PSR B125963 a 47.76 ms radio pulsar is in a highly eccentric orbit ( years) around the massive O9.5Ve star LS 2883 (Johnston et al., 1992; Negueruela et al., 2011). The optical spectrum of the companion shows evidence of an equatorial disk (thus this star is generally classified as a Be star), which is thought to be inclined with respect to the orbital plane (Melatos, Johnston & Melrose, 1995). The pulsar crosses the disk plane twice each orbit, just before and after the periastron passage. The minimum approach between the pulsar and massive star is about astronomical unit (Negueruela et al., 2011), which is roughly the size of the equatorial disk (Johnston et al., 1992). Interaction between the relativistic pulsar wind and the wind and photon field of the Be star is believed to give rise to the observed unpulsed emission. X-ray emission is observed throughout the orbit (Hirayama et al., 1999; Chernyakova et al., 2006, e.g.) and the unpulsed radio, GeV and TeV emission is observed within a few months of periastron passage (Johnston et al., 1999; Johnston et al., 2005; Kirk, Ball & Skjæraasen, 1999; Abdo et al., 2011; Chernyakova et al., 2014; Aharonian et al., 2005; Aharonian et al., 2009).
The presence of a nearby X-ray pulsar, 2RXP J130159.6635806, located only 10 arcminutes away from PSR B1259-63 makes it difficult to observe the source with a non-imaging instrument, like Suzaku HXD-PIN detectors, or instruments with a low angular resolution, like INTEGRAL. For these instruments both sources influence the observed emission, and in order to reconstruct the spectral shape of PSR B125963 it is necessary to know the spectrum of 2RXP J130159.6635806. Recent NuSTAR observations of the 2RXP J130159.6635806 (Krivonos et al., 2015) allowed us to reconstruct the broad band, 0.5 - 60 keV X-ray spectrum of PSR B125963 as observed by Suzaku in 2011, and by INTEGRAL in 2015.
The most puzzling feature of the orbital modulation of the source is the huge flare in the GeV band starting ten days after the post-periastron passage of the pulsar through the stellar disk with no obvious counterpart at any other wavelength (Abdo et al., 2011; Chernyakova et al., 2014). The origin of this flare was widely discussed in the literature (see e.g. Abdo et al. (2011); Pétri & Dubus (2011); Khangulyan et al. (2012); Mochol & Kirk (2013); Dubus & Cerutti (2013)), but the lack of observational data prevented any firm conclusions being made. It was even not clear in advance whether the GeV flare would repeat in 2014.
In this paper we present the results of the extensive multiwavelength campaign of the latest PSR B1259-63 periastron passage, which happened on 2014 May 4 (tp=MJD56781.42). One of the main aims of this campaign was multiwavelength monitoring of PSR B125963 around the periastron and the moment of GeV flare in order to reveal the true nature of the flare. The paper is organised the following way. In section 2 we present results of optical monitoring with the Southern African Large Telescope (SALT) and SAA0 1.9-m telescopes. In section 3 details of X-ray data analysis along with the results of X-ray monitoring with SWIFT, NuSTAR, and INTEGRAL are given. In this section we also present for the first time the broadband X-ray spectrum of PSR B125963 as seen in 2010 by Suzaku. Section 4 explains details of Fermi-LAT data analysis. Finally all the obtained results are discussed in section 5.
2 Optical Spectroscopy

2.1 SAA0 1.9-m telescope
Spectroscopic observations of LS 2883, the primary of the system, were performed with the SAA0 1.9-m telescope between the 2014 June 6 and 2014 June 11. The Cassegrain spectrograph was set with grating number 5 to achieve a wavelength coverage of 6350-7050 Å with a blaze of 6800 Å and a resolving power R = = 6563 in the vicinity of the Hα line.
LS 2883 was observed for a total of 3 nights using 30s exposure times. 240 individual spectra were taken on the first night, 245 on the second and 196 on the third. Copper-Neon comparison lamp spectra were obtained throughout each night for wavelength calibration.
The spectra were flat fielded, extracted and wavelength calibrated using the standard slit spectroscopy routines in IRAF. To improve the signal-to-noise (S/N) of weak lines the spectra for each night were coadded. The mean spectra were then normalised to a unit continuum.
The equivalent widths of the H and He I(6678 Å) lines were measured by integrating over the emission line profiles. Due to the high S/N of the co-added spectra, the errors in W(H) and W(He I(6678 Å)) are due principally to the placement of the continuum. The larger percentage errors in W(He I(6678 Å)) is a result of an absorption feature in the vicinity, and the lower line strength. By choosing appropriate upper and lower bounds on the continuum levels, the error margins on the equivalent widths were calculated.
Further observations of LS 2883 were made between the UT dates 2014 June 11 and 2014 June 17. The Cassegrain spectrograph was set with grating number 6 to achieve a wavelength coverage of 4100-5400 Å with a blaze of 4600 Å and a resolving power R = = 2430 in the vicinity of the Hβ line.
In this mode LS 2883 was observed for 5 more nights with either 1 or 2 spectra taken each night. The exposure times each night varied from 350s to 700s depending on the number of spectra taken. Copper-argon comparison lamp spectra were obtained before and after each sequence for wavelength calibration.
An attempt was made to infer the equivalent width of the Hα line using the equivalent width of the Hβ line. Simultaneous measurements of the Hα and Hβ lines have been previously made and the ratio of W(Hα) to W(Hβ) was found to be (Negueruela et al., 2011). The application of this result to our Hβ data allowed for the deduction of W(Hα) from the measured W(Hβ) values. The larger error margins on the converted Hα data relative to the Hα data from the first three nights of observations is due to a combination of larger percentage errors on the W(Hβ) values and the propagation of the uncertainty in the W(Hα)/W(Hβ) relation from Negueruela et al. (2011).
The data of Negueruela et al. (2011) were taken at a phase of 0.62, while our observations are made at a phase of 0.02. The assumption that the W(Hα)/W(Hβ) ratio remains constant with phase is not completely justified considering that the physical conditions of the disk drastically varies as the pulsar moves through. However, spectroscopic observations from SALT were made simultaneously for two of the nights. The agreement between the two data sets suggests that the W(Hα)/W(Hβ) relation does not change with phase by more than the measured uncertainty in the equivalent widths of Negueruela et al. (2011).
| Date | MJD | ||||
| (days) | (days) | (Å) | (Å) | ||
| 2014-06-06 | 56814.74 | 33.3 | 294.8 | 70.28 0.73 | 0.44 0.05 |
| 2014-06-07 | 56815.77 | 34.3 | 295.8 | 71.48 0.81 | 0.43 0.05 |
| 2014-06-10 | 56818.71 | 37.3 | 298.4 | 69.61 1.16 | 0.44 0.05 |
| 2014-06-11 | 56819.87 | 38.4 | 299.3 | 71.17 4.39 | - |
| 2014-06-12 | 56820.72 | 39.3 | 300.0 | 67.82 4.22 | - |
| 2014-06-13 | 56821.69 | 40.3 | 300.7 | 67.68 4.18 | - |
| 2014-06-16 | 56824.72 | 43.3 | 302.9 | 66.39 4.16 | - |
| 2014-06-17 | 56825.74 | 44.4 | 303.6 | 65.84 4.10 | - |
2.2 SALT observations
As discussed in van Soelen et al. (in prep) optical spectroscopy was undertaken with the South African Large Telescope (SALT) using the Robert Stobie Spectrograph (Burgh et al., 2003), between 2014 April 30 and 2014 July 21. The RSS was used in a long slit mode with a wavelength coverage of 6176.6 – 6983.0 Å, with a resolution of at the central wavelength. A typical observation consisted of 3-4 camera exposures (total of to 500 s) which were co-added to achieve a higher SNR.
Data were reduced following the standard IRAF procedures, and flux shape correction was done using the spectroscopic standard LTT4364 (observed on 2014 May 11).
The equivalent width of the H line was measured by integrating over the line profile (within IRAF) with an assumed linear continuum between the selected positions. The statistical error in the equivalent width has been estimated using the method discussed in Vollmann & Eversberg (2006). In order to include an estimate of the uncertainty due to the line continuum, each measurement was performed more than once and any variation in the answer was included in the error estimate. In general this was smaller than the statistical estimate, though a more rigorous estimate of the error introduced by continuum placement (such as used for the SAAO 1.9-m) will slightly increase the error.
Since there was limited overlap between the SALT and SAAO 1.9-m observations (and this is for the SALT data which suffered from instrumental problems), we performed a comparison between the analysis methods used for the different data sets by analysing a selection of spectra from both the SALT and SAAO 1.9m observations using both analysis methods, and confirmed that both methods gave results that agreed within the uncertainty. The results are listed in Table 2.
| Date | MJD | |||
|---|---|---|---|---|
| (days) | (days) | (Å) | ||
| 2014-04-01 | 56748.0 | -33.4 | 65.06 | 54.880.68 |
| 2014-04-05 | 56752.9 | -28.5 | 70.38 | 55.270.72 |
| 2014-04-11 | 56758.0 | -23.4 | 77.48 | 55.560.62 |
| 2014-04-16 | 56763.9 | -17.5 | 88.89 | 58.590.10 |
| 2014-04-25 | 56772.9 | -8.5 | 119.94 | 55.370.55 |
| 2014-04-29 | 56776.8 | -4.6 | 143.18 | 56.78 0.69 |
| 2014-04-30 | 56777.9 | -3.5 | 151.17 | 56.55 0.59 |
| 2014-05-01 | 56778.8 | -2.6 | 158.13 | 57.97 0.54 |
| 2014-05-03 | 56780.8 | -0.7 | 174.59 | 60.901.02 |
| 2014-05-11 | 56788.8 | 7.4 | 233.86 | 68.46 0.55 |
| 2014-05-17 | 56794.8 | 13.4 | 259.57 | 72.70 0.71 |
| 2014-05-23 | 56800.8 | 19.4 | 275.12 | 71.32 0.71 |
| 2014-05-31 | 56808.8 | 27.4 | 288.14 | 70.622.50 |
| 2014-06-06 | 56814.7 | 33.3 | 294.77 | 68.59 4.39 |
| 2014-06-12 | 56820.7 | 39.3 | 299.99 | 64.96 0.70 |
| 2014-06-13 | 56821.7 | 40.3 | 300.75 | 63.70 0.54 |
| 2014-06-16 | 56824.7 | 43.3 | 302.88 | 60.83 0.51 |
| 2014-06-17 | 56825.8 | 44.4 | 303.61 | 61.46 0.75 |
| 2014-06-19 | 56827.7 | 46.3 | 304.82 | 60.54 0.70 |
| 2014-06-21 | 56829.7 | 48.3 | 306.01 | 60.12 0.82 |
| 2014-06-22 | 56830.8 | 49.4 | 306.64 | 60.14 0.65 |
| 2014-06-29 | 56837.8 | 56.3 | 310.21 | 60.153.21 |
| 2014-07-09 | 56847.8 | 66.4 | 314.37 | 57.390.79 |
| 2014-07-13 | 56851.7 | 70.3 | 315.77 | 55.890.49 |
| 2014-07-21 | 56859.7 | 78.3 | 318.33 | 56.69 0.55 |
3 X-ray Observations and Results
We conducted an X-ray monitoring campaign on PSR B125963 with Swift , NuSTAR and INTEGRAL telescopes, covering the period between days and days. These observations are summarized in Tables 3, 4 and 6. Tables 3 and 4 list identifiers for the data set, UT date, MJD, time relative to periastron passage and exposure time for each observation. In this paper we also use new NuSTAR observations of the nearby X-ray pulsar 2RXP J130159.6635806 to reconstruct the broad 0.5 – 50 keV X-ray spectrum as observed by Suzaku in 2014. All 2014 observations can be well fitted with an absorbed power law model.
3.1 Swift/XRT data reduction
The Swift observatory (Gehrels et al., 2004) provides the possibility to monitor sources of X-ray emission on very different time scales. In this work we use observations covering almost three months around periastron passage of PSR B1259-63 between 2014 April 20 and July 8. In Table 3 a log of the used observations is given. The data were processed using tools and packages available in FTOOLS/HEASOFT 6.14.
XRT observed PSR B1259-63 both in Photon Counting (PC) and Windowed Timing (WT) modes. Initial cleaning of events has been done using xrtpipeline with standard parameters. The further analysis was performed following Evans et al. (2009). In particular, in the PC mode the source extraction region was a circle with radii from 5 to 30 pixels depending on the count rate (Evans et al., 2009); in the WT mode radius of the source extraction region was 25 pixels. The background was collected over the annulus region with an inner (outer) radius of 60 (110) pixels in both observational modes. The count rate from the source was too low to pile up the detector in all observation except one (00030966025), where we excluded the inner region of the source aperture with a radius of 4 pixels.
The obtained spectra were grouped to have at least 1 count bin-1 using the FTOOLS grppha. To avoid any problems caused by the calibration uncertainties at low energies11 1 http://www.swift.ac.uk/analysis/xrt/digest_cal.php, we restricted our spectral analysis to 1.0 – 10 keV. The errors reported in this work are purely statistical and correspond to a 1 confidence level.
To estimate the 68% confidence ranges for the unabsorbed fluxes, we computed the C-statistic likelihood profile on the grid of column density () and power law slope () values. According to the Wilks theorem, the likelihood values are distributed around the true minimum with a distribution with two degrees of freedom, since we have two free parameters. We thus converted the obtained likelihood values to probabilities and performed Monte Carlo simulations in order to convert the computed likelihood profile to the distribution of the unabsorbed fluxes. For each of those distributions (for every single observation) we calculated the mean and its (asymmetric) confidence range by computing the limiting flux values below and above the mean, that contain between them 68% of all the simulated fluxes.
| Data | Obs Id | Date | Date, | , | Exposure, | XRT count ratea, | XRT |
|---|---|---|---|---|---|---|---|
| Set | MJD (UTC) | d | s | cts s-1 | mode | ||
| Sw13 | 00030966018 | 2014-04-20 | 56767.1736 | -14.561 | 1171.2 | 0.36 | PC |
| Sw14 | 00080099001 | 2014-04-20 | 56767.4857 | -14.249 | 1740.6 | 0.44 | PC |
| Sw15 | 00030966019 | 2014-04-27 | 56774.9560 | -6.779 | 4015.7 | 0.29 | PC |
| Sw16 | 00030966020 | 2014-05-04 | 56781.9594 | 0.224 | 4075.6 | 0.22 | PC |
| Sw17 | 00030966021 | 2014-05-06 | 56783.8933 | 2.158 | 1470.9 | 0.20 | PC |
| Sw18 | 00030966022 | 2014-05-07 | 56784.0872 | 2.352 | 2404.9 | 0.19 | PC |
| Sw19 | 00030966023 | 2014-05-09 | 56786.1540 | 4.419 | 1475.9 | 0.16 | PC |
| Sw20 | 00030966024 | 2014-05-17 | 56794.5981 | 12.863 | 179.8 | 0.44 | PC |
| Sw21 | 00030966025 | 2014-05-19 | 56796.8441 | 15.109 | 1987.8 | 0.61 | PC |
| Sw22 | 00030966026 | 2014-05-22 | 56799.4340 | 17.699 | 2877.3 | 1.00 | WT |
| Sw23 | 00030966027 | 2014-05-25 | 56802.4956 | 20.761 | 2925.1 | 0.74 | WT |
| Sw24 | 00030966028 | 2014-05-28 | 56805.6925 | 23.958 | 2991.7 | 0.65 | WT |
| Sw25 | 00030966029 | 2014-06-02 | 56810.9245 | 29.189 | 1504.4 | 0.51 | WT |
| Sw26 | 00030966030 | 2014-06-03 | 56811.0620 | 29.327 | 970.0 | 0.12 | WT |
| Sw27 | 00030966032 | 2014-06-07 | 56815.0953 | 33.360 | 2696.4 | 0.44 | WT |
| Sw28 | 00030966033 | 2014-06-11 | 56819.2927 | 37.558 | 3983.2 | 0.54 | WT |
| Sw29 | 00030966035 | 2014-06-12 | 56820.4606 | 38.726 | 999.6 | 0.54 | WT |
| Sw30 | 00030966036 | 2014-06-13 | 56821.8494 | 40.114 | 2036.3 | 0.51 | WT |
| Sw31 | 00030966037 | 2014-06-14 | 56822.8488 | 41.114 | 1834.4 | 0.49 | WT |
| Sw32 | 00030966038 | 2014-06-15 | 56823.2857 | 41.551 | 767.3 | 0.44 | WT |
| Sw33 | 00030966039 | 2014-06-16 | 56824.5833 | 42.848 | 2026.2 | 0.48 | WT |
| Sw34 | 00030966041 | 2014-06-18 | 56826.2590 | 44.524 | 981.5 | 0.50 | WT |
| Sw35 | 00030966043 | 2014-06-25 | 56833.3399 | 51.605 | 3284.0 | 0.28 | PC |
| Sw36 | 00030966044 | 2014-06-26 | 56834.5113 | 52.776 | 1513.4 | 0.27 | PC |
| Sw37 | 00030966047 | 2014-06-27 | 56835.4127 | 53.678 | 2559.7 | 0.25 | PC |
| Sw38 | 00030966048 | 2014-07-02 | 56840.4456 | 58.711 | 2964.3 | 0.26 | PC |
| Sw39 | 00030966049 | 2014-07-06 | 56844.7580 | 63.023 | 3264.0 | 0.20 | PC |
| Sw40 | 00030966050 | 2014-07-07 | 56845.2536 | 63.519 | 3785.9 | 0.17 | PC |
| Sw41 | 00030966051 | 2014-07-08 | 56846.5879 | 64.853 | 3965.7 | 0.18 | PC |
| a | Total count rate in 0.5–10 keV energy range |
3.2 NuSTAR observations and data analysis
Previous X-ray observations of PSR B125963 suffered due to a lack of high quality X-ray data above 10 keV. The first hard X-ray measurement of the system was done with the OSSE instrument in the keV band during monitoring of the 1994 periastron passage (Grove et al., 1995). The OSSE experiment could not provide spatially-resolved flux measurements of the source due to its non-imaging design and, therefore, flux pollution from nearby sources could not be fully excluded. The first attempt to perform hard X-ray imaging of PSR B125963 was done with INTEGRAL during periastron passage in 2004 (Shaw et al., 2004), which demonstrated the importance of spatially-resolved observations. It was shown that the variable hard X-ray source 2RXP J130159.6635806 located away from PSR B125963, significantly contributes to the hard X-ray flux measured from this region. Despite the progress made in understanding the contamination from 2RXP J130159.6635806 INTEGRAL was unable to provide non-contaminated X-ray measurements of PSR B125963 due to its angular resolution. Later periastron observations with Suzaku were also not able to spatially separate hard X-ray emission from PSR B125963 and 2RXP J130159.6635806, forcing authors to assume their hard X-ray spectral shapes based on keV data (Uchiyama et al., 2009). Suzaku observations indicated the possible break during the first interaction of the pulsar with the disk.
Significant progress has been recently made thanks to the launch of the NuSTAR mission (Harrison et al., 2013), the first hard X-ray imaging telescope in space working at energies above 10 keV. NuSTAR team initiated an observational campaign during periastron passage of PSR B125963 in 2014. In total NuSTAR performed five observations for a total of 146 ks, targeting the source on-axis of the two co-aligned X-ray telescopes. The 10 m focusing mirror and detector modules provide (half-power diameter) and (FWHM) imaging resolution over the 3–79 keV X-ray band, with a spectral resolution of 400 eV (FWHM) at 10 keV. The NuSTAR field of view (FOV) is at 10 keV as defined by the full width at half intensity. The nominal reconstructed coordinates are accurate to 8′′ (90% confidence level) (Harrison et al. 2013).
We reduced and analyzed data using the NuSTAR Data Analysis Software (NuSTARDAS) v1.3.1, which is part of the HEASOFT 6.15 package. The data were filtered for intervals of high background and corrected for angular offset using catalogued coordinates of PSR B125963.
During most of the NuSTAR observations 2RXP J130159.6635806 was out of the FOV, and only in one of them (ObsID: 30002017004) it appeared in the corner at a large off-axis distance, which is demonstrated in Fig. 2. It is clearly seen from the Fig. 2 that NuSTAR fully resolved flux from PSR B125963 and 2RXP J130159.6635806 allowing one to conduct for the first time hard X-ray observation of PSR B125963 around periastron without any contamination from the nearby variable and hard 2RXP J130159.6635806 source. As discovered by Chernyakova et al. (2005), 2RXP J130159.6635806 shows coherent spun-up pulsations at a period of s. It is interesting to note that serendipitous NuSTAR detection of 2RXP J130159.6635806 at the corner of the FOV allowed us to measure its flux pulsations period (Krivonos et al., 2015), which is in full agreement with spin-up rate evolution reported in Chernyakova et al. (2005).
We performed NuSTAR spectral analysis using nuproducts v0.2.5, which is part of NuSTARDAS, to generate NuSTAR response matrix (RMF) and effective area (ARF) files for an on-axis point source. To extract the source spectrum we utilized circular region centred at the source position with radius which comprises of the encircled energy (Harrison et al., 2013). The background spectrum was extracted from a circular region positioned away from the source, on the same chip (each detector module has four chips) avoiding chip edges and gaps between them.
| Data | Obs Id | Date | Date, | , | Exposure, | NuSTAR count ratea, |
|---|---|---|---|---|---|---|
| Set | MJD (UTC) | d | s | (FPMA, FPMB) cts s-1 | ||
| NST1 | 30002017002 | 2014-04-20T05:06:07 – 2014-04-20T22:11:07 | 56767.23 | -14.189 | 30517.85 | 6.00 , 5.51 |
| NST2 | 30002017004 | 2014-05-04T10:01:07 – 2014-05-05T04:36:07 | 56781.42 | 0.005 | 33317.07 | 3.25 , 2.92 |
| NST3 | 30002017006 | 2014-05-28T10:11:07 – 2014-05-28T22:31:07 | 56805.44 | 24.021 | 27089.72 | 7.15 , 6.69 |
| NST4 | 30002017008 | 2014-06-02T19:21:07 – 2014-06-03T08:06:07 | 56810.82 | 29.405 | 26288.55 | 6.15 , 5.60 |
| NST5 | 30002017010 | 2014-06-14T17:21:07 – 2014-06-15T10:06:07 | 56822.73 | 41.312 | 29106.89 | 5.56 , 5.25 |
| a | Total count rate in keV energy range |


3.3 Reanalysis of 2010 Suzaku observations.
PSR B1259-63 was extensively monitored by Suzaku during its 2007 (Uchiyama et al., 2009) and 2010 (Chernyakova et al. (2014), observations Sz9 - Sz11 in Table 5) periastron passages. Suzaku 2011 broad spectrum of PSR B125963 was never presented in the literature. The Suzaku observations were performed with the X-ray Imaging Spectrometer (XIS; Koyama et al. (2007)) in 0.3 – 12 keV and the hard X-ray detector (HXD; Takahashi et al. (2007)) in 13 – 600 keV. The FOV of both XIS and HXD also contains the X-ray source, 2RXP J130159.6635806. This X-ray pulsar has a luminosity comparable to the one of PSR B1259-63 during the periastron passage and makes significant contribution to the hard X-ray flux measured by the non-imaging HXD-PIN detector. Recent NuSTAR observations of 2RXP J130159.6635806 allowed for the first time to measure its broadband spectrum (Krivonos et al., 2015). The spectrum of 2RXP J130159.6635806 is well described by the absorbed power law with a high energy cut off, .
| Data | Date | MJD | Exposure | FPSRB(1-10keV) | FRXP(2-10keV) | ||||
|---|---|---|---|---|---|---|---|---|---|
| Set | (days) | (days) | (deg) | (ks) | 1022 cm-2 | erg cm-2 s-1 | erg cm-2 s-1 | ||
| Sz9 | 2011-01-05 | 55566.8 | 22 | 99.6 | 90.0 | 0.540.01 | 1.780.01 | 2.840.01 | 2.100.03 |
| Sz10 | 2011-01-24 | 55585.6 | 41 | 121.0 | 40.3 | 0.490.01 | 1.540.01 | 1.680.02 | 2.050.03 |
| Sz11 | 2011-02-02 | 55594.2 | 49 | 126.5 | 21.5 | 0.460.02 | 1.460.02 | 1.470.02 | 2.260.03 |


To reconstruct the 2011 broadband spectrum of PSR B1259-63 we reanalyzed historical Suzaku data using the HEASOFT software package (version 6.16), with calibration files distributed on 01.07.2014. For the XIS and HXD-PIN, we made use of cleaned event files, in which standard screening was applied.
HXD data is a sum of emission coming from PSR B125963 and 2RXP J130159.6635806. In our analysis we assumed that the shape of the 2RXP J130159.6635806 spectrum was the same in 2010 and 2014, and only normalization changed from one observation to another. The normalization of the 2RXP J130159.6635806 spectrum was defined from the simultaneous observations of the imaging instruments, PIN/Suzaku for Sz10, and MOS1,2/XMM-Newton for Sz9 and Sz11. These XMM-Newton observations are described in Chernyakova et al. (2014). Simultaneous fits of Sz9, Sz10, Sz11 and NuSTAR data give a good fit ( for 6686 degrees of freedom) with the following parameters: Nh = 2.73, , , , see Figure 4. The resulting parameters for PSR B125963 and 2 – 10 keV absorbed fluxes for 2RXP J130159.6635806 are given in Table 5.
3.4 INTEGRAL Observations and data analysis
INTEGRAL (Winkler et al., 2003) is a -ray mission covering the energy the range 15 keV – 10 MeV. Observations are carried out in individual Science Windows (ScW), which have a typical time duration of about 2000s. In 2014 INTEGRAL observed PSR B125963 periastron passage from June 26 to July 10. The data cover revolutions 1429--1433, adding up to a total effective exposure time of 141 ks for IBIS/ISGRI in 18-60 keV and 259 ks for JEMX1 & JEMX2 combined. The data were analyzed using the standard ISDC offline scientific analysis (OSA) software version 10.0. IBIS/ISGRI images for each ScW are generated in the 18--60 keV energy band. These images are used to produce the long-term light curve on the ScW timescale. The total spectrum is obtained using mosaic images as stated in the IBIS Analysis User Manua22 2 See http://www.isdc.unige.ch/integral/analysis for more information.. To extract the spectra we use the following parameters: size=1; posmode=-1; widthmode=-1.
PSR B1259-63 was detected with a significance of 3.7 sigma in 3-35 keV combining JEMX1 & JEMX2 data. The low significance hindered further investigation of JEMX data. The source was detected at the 11- confidence level in 18-60 keV energy range by IBIS/ISGRI. The resulting 18 -60 keV light curve with a 3 day binsize is shown in Figure 5. The exposure time of each point is given in Table 6. The light curve shows a graduate decay of the flux with no striking variability. Please note that some of the flux detected from the position of PSR B1259-63 is actually coming from the nearby source 2RXP J130159.6635806 , though as followed from the spectral analysis described below, the total 18-60 keV flux of 2RXP J130159.6635806 is less than a half of the flux of PSR B125963 in this energy range.

| f(18 – 60 keV) | Exposure | |
|---|---|---|
| (days) | (cts/sec) | (ks) |
| 55 | 0.90 0.14 | 27.21 |
| 58 | 0.81 0.16 | 23.65 |
| 61 | 0.67 0.16 | 23.27 |
| 64 | 0.57 0.16 | 25.42 |
| 67 | 0.50 0.13 | 40.27 |
The IBIS/ISGRI angular resolution (12 arcmin) does not allow us to resolve PSR B125963 and 2RXP J130159.6635806. Thus similar to the reconstruction of the hard spectrum of Suzaku one needs to fit the INTEGRAL spectrum as a sum of two sources. The quality of the INTEGRAL data allow us to fit the observed points with a single power law and the fitting procedure tends to attribute all the observed flux to PSR B1259-63. To prevent this we set a lower limit for the possible 20 - 60 keV flux from 2RXP J130159.6635806, to erg s-1 cm-2. This minimum value is about a half of the flux registered by NuSTAR in May 2015. With such a constraint we get a more realistic fit with for 9 degrees of freedom. The resulting 20 – 60 keV flux from 2RXP J130159.6635806 varies from erg s-1 cm-2 to erg s-1 cm-2, and for the PSRB 1259-63 we get the following parameters: F erg s-1 cm-2, . These parameters are in a good agreement with Swift observations taken during the same period (see Figure 7).
3.5 The X-ray light curve
Panel (b) of Fig. 1 shows the X-ray light curve of the system (note that the given 1 – 10 keV flux is not corrected for the absorption). Observations made with different instruments at close orbital phases are consistent with each other, demonstrating good intercalibration.
From data obtained at orbital phases similar to the archival observations of previous periastron passages, one can see that the system orbital light curve is stable over a time scale of several years. The stability of the orbital light curve allows us to use old and new data simultaneously while analysing the orbital evolution of the flux. Around the 2014 periastron passage our X-ray observations started around the time of the first peak in the X-ray light curve at (Sw13,NSt1). Similar to previous observations we observed the gradual decrease of the flux, as the pulsar moved towards the periastron passage. Dense coverage with Swift after the periastron passage allowed us, for the first time, to observe the second rise of the flux in detail, and to determine that the second X-ray peak is almost twice as high as the first, similar to the behaviour commonly observed in radio. The general stability of the X-ray light curve allows us to use Chandra 2007 data to conclude that during the second rise the flux doubles in less than three days, and reaches the maximum less than in a week. After that, the X-ray flux gradually decreased in a good agreement with previous observations. However, detailed Swift observations show for the first time that start of GeV flare corresponds to the sharp change of the rate of the X-ray flux decrease, and also to a significant hardening of the X-ray spectrum, as discussed in Section 3.6.
3.5.1 Fast variability in the light curve
The fast, d, variability of the system was previously suggested in Tam et al. (2015). This may indicate that the cooling of electrons in the PSR B125963 system happens already on daily time scales, which challenges the conventional interpretation of the decaying branch of the source light curve in terms of the gradual cooling of the injected particles. In order to investigate this possibility, we have searched for such fast variability in Swift and NuSTAR 2014 data.
The NuSTAR data alone, due to their sparse coverage of the source light curve, do not allow us to look for variability on time scales longer than ksec ( the duration of the single NuSTAR observation). Applying the Structure Function (SF) analysis (Simonetti, Cordes & Heeschen, 1985; Favre, Courvoisier & Paltani, 2005; Savchenko, Neronov & Courvoisier, 2012; Vovk & Neronov, 2013) to the light curves, we found no significant variability on the 0.5–30 ksec time scale.
Much better coverage of the periastron passage is given by the Swift observations, which provide light curve coverage in ksec time bins, separated by d time intervals, which creates substantial difficulties for the SF analysis. As a way to overcome this difficulty, Tam et al. (2015) have fitted the light curve with the exponential decay model, demonstrating significant residuals from the fit. However, the intrinsic shape of the decaying branch of PSR B125963 light curve may deviate from the simple exponential decay form, e.g. due to the movement of the emitting region through the complex environment of the system and the subsequent change in the cooling rate.
In order to avoid complications due to the uncertain intrinsic light curve shape, we have chosen a different approach. In order to assess the variability at the time scale , we first created an averaged light curve, using as the averaging scale. This averaged light curve contains time bins. We then compute a difference of the original and the averaged light curves, which then can be quantified in terms of the with degrees of freedom. Clearly, a very small value of in this case would result in the averaged light curve perfectly matching the original light curve, resulting in the zero . At the same time would be equivalent to the fitting the entire light curve to the constant, which in the case of the PSR B125963 observations would result in a very large value of , indicating significant variability.
We repeated this procedure for the values of in the range from 0.5 to 10 days with a step of 0.1 day. The result of this scan is shown in Fig. 6.
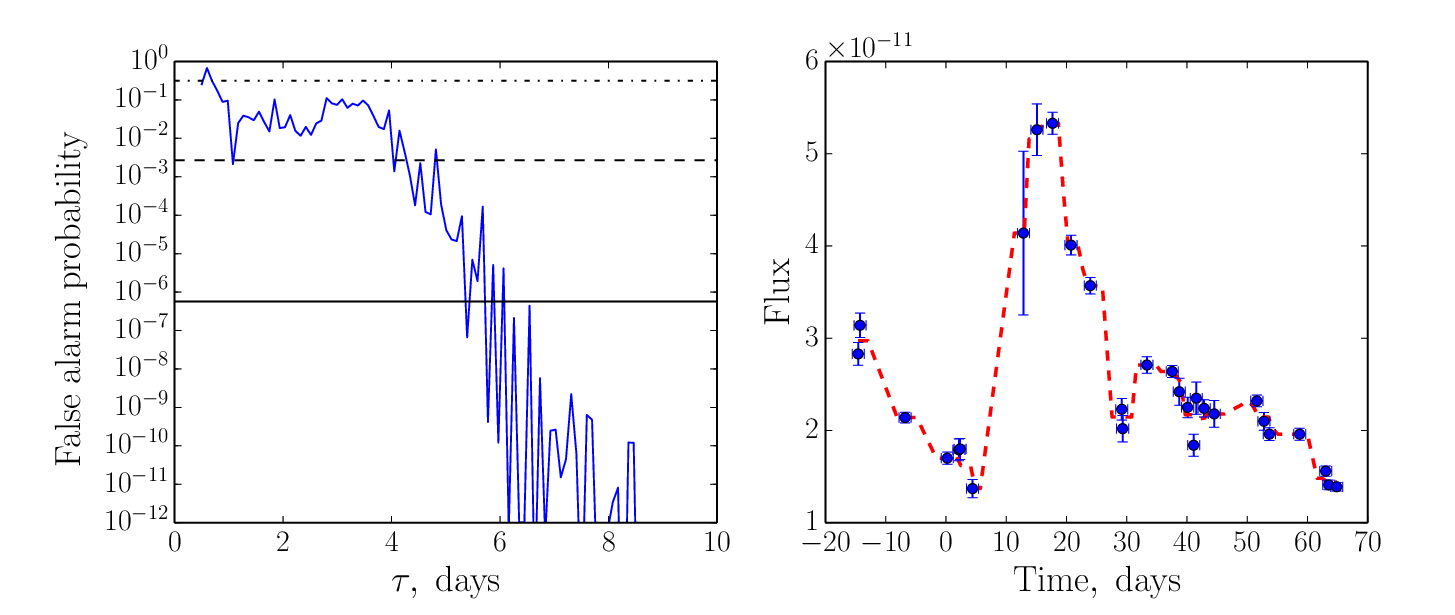
This figure shows that the variability of the source starts to be significant above days, corresponding to the rise/decay time scales of the main flares in the light curve. Thus, our analysis disfavours the daily variability of PSR B125963 suggesting that its light curve is rather smooth.
3.6 Spectral Analysis
The X-ray spectral analyses were done with NASA/GSFC XSPEC v12.7.1 software package. A simple power law with a photoelectric absorption describes the data well, with no evidence for any line features. In Table 7 we present the results of the three parameter fit to the Swift and NuSTAR data. The uncertainties are given at the statistical level and do not include systematic uncertainties. The graphical representation of the spectral parameters is shown in Figure 7. In Figure 7 new observations are shown along with the ones from previous periastron passages. The example of the NuSTAR spectra (NSt2 and NSt3) are given in Figure 3.
The average hydrogen column density over the entire Swift 2014 campaign is cm-2, estimated as a weighted mean of the values in Table 7. A similar analysis of the combined XMM-Newton and Suzaku 2007 data set suggests a lower value of cm-2. The two values are compatible with each other at the confidence level. When compared to the averaged value cm-2, the significance of the variation is reduced to .
The dotted line in the Figure 7 shows the moment when the GeV emission was for the first time detected in the GeV band on a day time scale (31 days after the periastron passage, Caliandro et al. (2015, in press)). It is clearly seen that the rate of the source decay and its spectral index significantly changes after the flare. The decay becomes much more shallow, while the emission becomes much harder, with an average value of , instead of at periastron. No significant change of the column density has been observed.

| Data | , | (1–10 keV) | (1–10 keV) | C∗ | ndof | ||
|---|---|---|---|---|---|---|---|
| Set | d | erg cm-2 s-1 | erg cm-2 s-1 | 1022 cm-2 | |||
| Sw13 | -14.56 | 2.83 | 2.42 | 1.630.21 | 0.610.21 | 189.95 | 240 |
| Sw14 | -14.24 | 3.14 | 2.38 | 2.070.16 | 0.840.16 | 260.99 | 329 |
| NST1 | -14.19 | 2.84 | 2.46 | 1.840.02 | 0.400.26 | 0.90 | 330 |
| Sw15 | -6.78 | 2.14 | 1.84 | 1.710.12 | 0.590.12 | 376.91 | 402 |
| Sw16 | 0.22 | 1.70 | 1.32 | 2.040.15 | 0.750.14 | 295.15 | 344 |
| NST2 | 0.005 | 1.88 | 1.37 | 1.950.03 | 0.640.34 | 0.98 | 256 |
| Sw17 | 2.16 | 1.79 | 1.46 | 1.990.26 | 0.570.24 | 147.61 | 190 |
| Sw18 | 2.35 | 1.80 | 1.30 | 2.120.22 | 0.970.22 | 213.93 | 247 |
| Sw19 | 4.42 | 1.37 | 1.26 | 1.590.28 | 0.200.25 | 120.14 | 155 |
| Sw20 | 12.86 | 4.14 | 2.40 | 2.380.61 | 1.190.61 | 47.14 | 63 |
| Sw21 | 15.12 | 5.26 | 3.66 | 2.160.19 | 1.100.19 | 237.50 | 302 |
| Sw22 | 17.70 | 5.33 | 4.38 | 1.860.10 | 0.680.10 | 457.72 | 529 |
| Sw23 | 20.76 | 4.01 | 3.32 | 1.850.11 | 0.630.11 | 403.67 | 487 |
| Sw24 | 23.96 | 3.57 | 3.15 | 1.570.11 | 0.520.11 | 413.16 | 499 |
| NST3 | 24.02 | 3.27 | 2.67 | 1.610.01 | 355 | ||
| Sw25 | 29.19 | 2.23 | 2.01 | 1.510.21 | 0.390.22 | 214.99 | 313 |
| Sw26 | 29.33 | 2.02 | 1.90 | 1.480.26 | 0.080.30 | 220.49 | 247 |
| NST4 | 29.41 | 2.86 | 2.23 | 1.520.01 | 336 | ||
| Sw27 | 33.36 | 2.71 | 2.28 | 1.720.14 | 0.680.15 | 338.63 | 430 |
| Sw28 | 37.56 | 2.64 | 2.36 | 1.520.11 | 0.480.11 | 355.16 | 496 |
| Sw29 | 38.73 | 2.42 | 2.07 | 1.710.26 | 0.540.24 | 191.01 | 250 |
| Sw30 | 40.11 | 2.25 | 1.86 | 1.750.23 | 0.670.22 | 237.73 | 319 |
| Sw31 | 41.11 | 1.84 | 1.63 | 1.620.28 | 0.420.26 | 201.54 | 261 |
| NST5 | 41.31 | 2.61 | 1.98 | 1.520.01 | 343 | ||
| Sw32 | 41.55 | 2.35 | 2.22 | 1.090.28 | 0.150.29 | 127.01 | 203 |
| Sw33 | 42.85 | 2.24 | 1.95 | 1.680.18 | 0.500.17 | 281.04 | 354 |
| Sw34 | 44.52 | 2.18 | 2.04 | 1.410.25 | 0.260.23 | 180.19 | 248 |
| Sw35 | 51.60 | 2.32 | 2.12 | 1.230.13 | 0.490.14 | 371.76 | 418 |
| Sw36 | 52.78 | 2.10 | 1.76 | 1.630.21 | 0.720.22 | 210.88 | 244 |
| Sw37 | 53.68 | 1.96 | 1.73 | 1.400.16 | 0.610.18 | 267.29 | 335 |
| Sw38 | 58.71 | 1.96 | 1.59 | 1.720.15 | 0.830.16 | 327.19 | 358 |
| Sw39 | 63.02 | 1.56 | 1.31 | 1.620.16 | 0.760.17 | 262.48 | 338 |
| Sw40 | 63.52 | 1.41 | 1.31 | 1.260.16 | 0.400.17 | 256.06 | 325 |
| Sw41 | 64.85 | 1.39 | 1.19 | 1.530.16 | 0.720.17 | 271.68 | 343 |
∗ Relatively poor statistics in some of the Swift spectra forces us to use C statistics in data analysis.
4 Fermi-LAT Observations and Results
The Fermi-LAT results included in this paper are adopted from Caliandro et al. (2015, in press). The analysis of Fermi-LAT data was performed using the Fermi Science Tools33 3 http://fermi.gsfc.nasa.gov/ssc/, 09-34-01 release. For the 2010 and 2014 periastron passages the analysis was carried out with Pass 7 reprocessed data belonging to the SOURCE event class44 4 http://fermi.gsfc.nasa.gov/ssc/data/analysis/documentation/Pass7REP_usage.html. All gamma-ray photons within an energy range of 0.1–100 GeV and within a circular region of interest (ROI) of 10∘ radius centered on PSR B125963 were used. To reject gamma-ray contamination originating from the Earth’s limb, we selected events with zenith angle 100∘. The gamma-ray flux and spectral results of PSR B125963 presented in this work were calculated by performing a binned maximum likelihood fit using the Science Tool gtlike. The spectral-spatial model constructed to perform the likelihood analysis includes Galactic and isotropic diffuse emission components as well as known gamma-ray sources within 15∘ of PSR B125963 based on a catalogue internal to the Fermi collaboration ( (now released as 3FGL, Acero et al. (2015)). The spectral parameters were fixed to the catalogue values, except for the sources within 3∘ of PSR B12596355 5 http://fermi.gsfc.nasa.gov/ssc/data/analysis/scitools/source_models.html. For these latter sources, the flux normalization was left free. PSR B125963 itself was modelled as a single power-law with all spectral parameters allowed to vary. The contribution of the Galactic and isotropic diffuse emissions within the analyzed ROI was estimated performing a preliminary maximum likelihood fit. For the 2010 periastron event, this fit included data from 5 months prior to 1 year after periastron. For 2014, this fit included data from 5 months prior to periastron. The resulting scale factors of the isotropic and Galactic diffuse templates were kept fixed in the analysis.
The 2014 Fermi-LAT observations showed a persistent nature of the GeV flare with the onset of the flaring activity starting 31 days after periastron (Caliandro et al. (2015, in press)). It turned out that the 2014 GeV flare exhibits a similar average flux level and spectral shape with the flare of 2010. The details of the 2014 GeV flux evolution, differs however from the 2010 light curve, see panel (a) of Figure 1. The 2010 flare has a higher peak flux, and a rapid decreasing evolution (Figure 2a). The 2014 flare has a peak flux lower by a factor of 1.6, which then persists rather than falling rapidly. These differences may be due to inhomogeneities in the shape, density, or extent in the circumstellar disk of the Be star (e.g. the equivalent width of the H line before the periastron was somewhat higher in 2010, than in 2014, see panel (c) of Figure 1).
5 Discussion
The broad band non-thermal emission from PSR B1259-63 is produced by high-energy particles accelerated at the shock formed at the interface of the pulsar winds (Tavani & Arons, 1997). The orbital modulation of different components of the broad band spectrum is generally understood as being due to the orbital variability of geometrical parameters, such as the geometry of the contact surface of the stellar and pulsar winds. The overall "two-bump" variability pattern of the source, evident from Fig. 1, is generally explained by the passage of the pulsar through the dense equatorial wind of the Be star. This happens twice per orbit, just before and just after the periastron.
The most puzzling feature of the orbital modulation of the source is the GeV band flaring activity discovered by Fermi/LAT telescope (Abdo et al., 2011; Chernyakova et al., 2014). The flare occurred unexpectedly a month after periastron and ten days after the post-periastron passage of the pulsar through the equatorial wind of the Be star. By this time, the pulsar is already exiting from the dense equatorial stellar wind of the Be star and the overall activity of the source is decreasing in all energy bands, from radio to X-ray. The sudden brightening of the source at this moment of time was not expected before the Fermi observations.
The GeV flaring appeared even more puzzling in the absence of clear counterparts to the flare in other energy bands. The flare appeared as an "orphan" increase of the GeV flux, not accompanied by changes in the source state in other wavebands.
The origin of this "orphan" flare was widely discussed in the literature (see e.g. Pétri & Dubus (2011); Khangulyan et al. (2012); Mochol & Kirk (2013); Dubus & Cerutti (2013)). However, no consensus on the nature of the flare was reached, because of the significant lack of information on the flare properties. In particular, before the new observational campaign around the 2014 periastron passage, it was not known if the GeV flare was a unique event or if it is systematically repeating at each periastron passage. Even if the flare is recurrent from orbit to orbit, it was not clear if it always occurs at the same orbital phase or if it could occur at different phases. It was also unclear if there is only one flare per periastron passage or if the flaring activity could appear as a sequence of flares at different orbital phases.
New observations in the GeV band in 2014, combined with the multi-wavelength observations reported here provide the missing observational constraints necessary to clarify the nature of the flare. It is now clear that the GeV flaring is recurrent from orbit to orbit. It always occurs at one and the same orbital phase, some 30 days after the periastron passage.
X-ray observations provide a detailed picture of the behaviour of the source throughout the GeV flaring period and show that the GeV flare is not "orphan". It is accompanied by a specific hard state of the source in the X-ray band (see discussion in Section 3.6).
Optical spectroscopy data reported here also demonstrate that the moment of the onset of the flare is not random. It coincides with a sudden decrease of the equivalent width of H line, which characterises the state of the equatorial disk of the Be star (see Section 2 and panel (c) of Fig. 1).
These new observations confirm a model of the flare which was put forward by Chernyakova et al. (2014). Within this model, the GeV flare occurs at the moment of partial destruction of the equatorial disk of the Be star by the passage of the pulsar. Estimating the mass of the Be star disk from the equivalent width of H line (Chernyakova et al., 2014), one could find that at the moment of the GeV flare, the disk mass has decreased by a factor of five, from about down to , within just five days after the onset of the flare. The nature of such a dramatic event of destruction of the Be star disk has to be further investigated, but the consequences of the event for the properties of non-thermal emission from the system could be understood in a straightforward way.
Destruction of the equatorial disk also destroys the well-organized geometry of the interacting pulsar / stellar winds system. The regular bow-shaped contact surface of the two winds (Tavani & Arons, 1997) is destroyed. Instead, a chaotic system of clumps originating from the dense Be star disk produces a contact surface of highly irregular geometry.
The destruction of the regular contact surface also closes the escape path for the unshocked pulsar wind which was previously able to escape along a cone which points away from the Be star. The pulsar wind which could not escape releases all its power inside the system. This leads to the increase of the luminosity of the source, up to the of the spin-down power of the pulsar in 2010 and in 2014 (Abdo et al. (2011), Caliandro et al. (2015, in press)).
Fig. 8 shows a comparison of the new measurements of the spectrum of the flare and pre-flare states of the source with the model of Abdo et al. (2011). The Fermi/LAT data from the both observed flares are combined, which allows for a measurement of the -ray spectrum down to lower and at higher energies, compared to Abdo et al. (2011). Higher quality NuStar data reveal the X-ray counterpart of the flare.
These higher quality data are still consistent with the model in which the flare emission is attributed to the synchrotron emission from electrons injected with a close to monoenergetic spectrum and cooled by the synchrotron energy loss. The synchrotron cooling leads to the formation of a low energy tail of the electron spectrum. Synchrotron emission from electrons in the tail has the hard spectrum observed in the X-ray band throughout the flare.
Neither the energy nor the origin of the nearly monoenergetic electrons could be firmly established based on the observational data. This is because the maximal energy of the synchrotron emission is close to the self-regulated cut-off in the synchrotron spectrum at MeV, where is the fine structure constant. Such a cut-off occurs when electrons are accelerated at the maximal rate and balanced by the synchrotron loss rate. In this regime the maximal energy of the synchrotron emission does not depend on either the magnetic field or on the energy of electrons. Assuming that the magnetic field in the pulsar and stellar wind interaction zone is about G, Tavani & Arons (1997) provides an estimate of electron energy eV, which is necessary to produce synchrotron emission in the 100 MeV energy range.
Contrary to the flaring component, the persistent component of the broad band spectrum does not have a sharp peak at 100 MeV. Instead, the X-ray-to-GeV spectrum is flat in the representation, i.e. it has the form . Synchrotron emission with such a spectrum is produced by electrons with a powerlaw spectrum . The synchrotron spectrum hardens below keV and the slope of the radio-to-X-ray spectrum is , which corresponds an electron spectrum with a slope . Thus, the electron spectrum responsible for the persistent emission throughout the two passages of the Be star disk is a broken powerlaw with the slope softening from to at the energy TeV. The softening by is typical for the effect of the synchrotron cooling on the spectrum. The synchrotron cooling modifies the electron spectrum in the energy range above 1 TeV and it fails to do this below 1 TeV. The absence of cooling in the energy band below 1 TeV could be attributed to the escape of the sub-TeV electrons from the system. The synchrotron cooling time is s. It is comparable to the escape time for a region which is approximately the size of the binary separation distance cm.
The injection spectrum of electrons responsible for the persistent emission during the disk passages, is different from the spectrum of electrons injected during the GeV flare (which is close to mono energetic). This suggests that the two populations of high-energy electrons are produced by different acceleration processes and/or originate from different sources. The natural possibility for different emission sites is electrons originating from the pulsar wind and electrons from the stellar wind. The two populations of electrons might also appear because of the presence of two different acceleration sites in the system: the non-relativistic shock from the stellar wind side of the contact surface and relativistic shock at the pulsar wind side of the winds contact surface.

In an alternative model of the flaring activity of the source (Abdo et al., 2011), the "orphan" flare in the GeV band was assumed to be produced via the Bremsstrahlung mechanism. A flare would correspond to a sudden increase of the density of the medium, which could be the debris of the destroyed equatorial disk of the Be star. Such a model is disfavoured by the observations of the X-ray counterpart of the flare. The Bremsstrahlung emission produces a negligible contribution to the X-ray flux and could not be responsible for the hard spectrum flaring activity coinciding with the GeV flare period.
Within the synchrotron scenario, the flaring activity of PSR B1259-63 is similar to the flaring activity of the Crab pulsar where the GeV band flares are due to the synchrotron emission from the highest energy electrons accelerated at maximal possible rate. A study of the comparison of the detailed properties of the GeV flares in the two sources could potentially be useful for understanding the origin of the high-energy electrons and the location of the high-efficient acceleration sites inside the two sources. Observations reported in this paper show that the triggering of the flares in PSR B1259-63 occurs simultaneously with an instability which destroys the equatorial disk of the Be star companion to the pulsar. It is not clear if it is the disk instability which triggers an instability of the pulsar wind and of the interface of the pulsar and stellar winds, or the causal link is in the opposite direction. In the case of Crab, the mechanism of triggering the flares could only be an intrinsic instability of the pulsar wind or of the interface of the pulsar wind and external medium. An alternative possibility is not available because of the absence of the companion massive star. It remains to be seen if the flares of Crab and PSR B1259-63 are triggered by the same type of instability and are powered by the same type of acceleration mechanism.
Acknowledgements. This work was partially supported by the EU COST Action MP1304 "NewCompStar". The authors thank the International Space Science Institute (ISSI, Bern) for support within the ISSI team “Study of Gamma-ray Loud Binary Systems” and SFI/HEA Irish Centre for High-End Computing (ICHEC) for the provision of computational facilities and support. SZh acknowledge support from the Chinese NSFC 11473027, 11133002, XTP project XDA 04060604; Strategic Priority Research Program "The Emergence of Cosmological Structures" of the Chinese Academy of Sciences, Grant No. XDB09000000 and Strategic Priority Research Program on Space Science, Chinese Academy of Sciences, Grant No.XDA04010300. ST thanks Russian Scientific Foundation for the support (grant 14-12-01287). MVM is grateful for support from the National Science Foundation through the grant AST-1109247. CK acknowledges the allocation of telescope time by the South African Astronomical Observatory, and funding from the South African Research Foundation. The work of IuB was partially supported by the stipendium of the president of Ukraine (2014-2016). J.L. and D.F.T. acknowledge support from the grants AYA2012-39303, SGR 2014-1073 and support from the National Natural Science Foundation of China via NSFC-11473027. J.L. acknowledges support by the Faculty of the European Space Astronomy Centre. D.F.T. acknowledges the Chinese Academy of Sciences visiting professorship program 2013T2J0007.
References
- Abdo et al. (2011) Abdo A. A. et al., 2011, ApJ, 736, L11
- Acero et al. (2015) Acero F. et al., 2015, ApJS, 218, 23
- Aharonian et al. (2009) Aharonian F. et al., 2009, A&A, 507, 389
- Aharonian et al. (2005) Aharonian F., Akhperjanian A. G., Aye K., Bazer-Bachi, et al., 2005, A&A, 442, 1
- Burgh et al. (2003) Burgh E. B., Nordsieck K. H., Kobulnicky H. A., Williams T. B., O’Donoghue D., Smith M. P., Percival J. W., 2003, in Society of Photo-Optical Instrumentation Engineers (SPIE) Conference Series, Vol. 4841, Instrument Design and Performance for Optical/Infrared Ground-based Telescopes, Iye M., Moorwood A. F. M., eds., pp. 1463–1471
- Chernyakova et al. (2014) Chernyakova M. et al., 2014, MNRAS, 439, 432
- Chernyakova et al. (2005) Chernyakova M., Lutovinov A., Rodríguez J., Revnivtsev M., 2005, MNRAS, 364, 455
- Chernyakova et al. (2009) Chernyakova M., Neronov A., Aharonian F., Uchiyama Y., Takahashi T., 2009, MNRAS, 397, 2123
- Chernyakova et al. (2006) Chernyakova M., Neronov A., Lutovinov A., Rodriguez J., Johnston S., 2006, MNRAS, 367, 1201
- Dubus & Cerutti (2013) Dubus G., Cerutti B., 2013, A&A, 557, A127
- Evans et al. (2009) Evans P. A. et al., 2009, MNRAS, 397, 1177
- Favre, Courvoisier & Paltani (2005) Favre P., Courvoisier T. J.-L., Paltani S., 2005, A&A, 443, 451
- Gehrels et al. (2004) Gehrels N. et al., 2004, ApJ, 611, 1005
- Grove et al. (1995) Grove J. E., Tavani M., Purcell W. R., Johnson W. N., Kurfess J. D., Strickman M. S., Arons J., 1995, ApJ, 447, L113
- Hirayama et al. (1999) Hirayama M., Cominsky L. R., Kaspi V. M., Nagase F., Tavani M., Kawai N., Grove J. E., 1999, ApJ, 521, 718
- Johnston et al. (2005) Johnston S., Ball L., Wang N., Manchester R. N., 2005, MNRAS, 358, 1069
- Johnston et al. (1992) Johnston S., Manchester R. N., Lyne A. G., Bailes M., Kaspi V. M., Qiao G., D’Amico N., 1992, ApJ, 387, L37
- Johnston et al. (1999) Johnston S., Manchester R. N., McConnell D., Campbell-Wilson D., 1999, MNRAS, 302, 277
- Khangulyan et al. (2012) Khangulyan D., Aharonian F. A., Bogovalov S. V., Ribó M., 2012, ApJ, 752, L17
- Kirk, Ball & Skjæraasen (1999) Kirk J. G., Ball L., Skjæraasen O., 1999, Astroparticle Physics, 10, 31
- Koyama et al. (2007) Koyama K. et al., 2007, PASJ, 59, 23
- Krivonos et al. (2015) Krivonos R. A. et al., 2015, ArXiv e-prints
- Melatos, Johnston & Melrose (1995) Melatos A., Johnston S., Melrose D. B., 1995, MNRAS, 275, 381
- Mochol & Kirk (2013) Mochol I., Kirk J. G., 2013, ApJ, 776, 40
- Negueruela et al. (2011) Negueruela I., Ribó M., Herrero A., Lorenzo J., Khangulyan D., Aharonian F. A., 2011, ApJ, 732, L11
- Pétri & Dubus (2011) Pétri J., Dubus G., 2011, MNRAS, 417, 532
- Savchenko, Neronov & Courvoisier (2012) Savchenko V., Neronov A., Courvoisier T. J.-L., 2012, A&A, 541, A122
- Shaw et al. (2004) Shaw S. E., Chernyakova M., Rodriguez J., Walter R., Kretschmar P., Mereghetti S., 2004, A&A, 426, L33
- Simonetti, Cordes & Heeschen (1985) Simonetti J. H., Cordes J. M., Heeschen D. S., 1985, ApJ, 296, 46
- Takahashi et al. (2007) Takahashi T. et al., 2007, PASJ, 59, 35
- Tam et al. (2015) Tam P. H. T., Li K. L., Takata J., Okazaki A. T., Hui C. Y., Kong A. K. H., 2015, ApJ, 798, L26
- Tavani & Arons (1997) Tavani M., Arons J., 1997, ApJ, 477, 439
- Uchiyama et al. (2009) Uchiyama Y., Tanaka T., Takahashi T., Mori K., Nakazawa K., 2009, ApJ, 698, 911
- Vollmann & Eversberg (2006) Vollmann K., Eversberg T., 2006, Astronomische Nachrichten, 327, 862
- Vovk & Neronov (2013) Vovk I., Neronov A., 2013, ApJ, 767, 103
- Winkler et al. (2003) Winkler C. et al., 2003, A&A, 411, L1