A homogeneous analysis of disks around brown dwarfs Thanks: Herschel is an ESA space observatory with science instruments provided by European-led Principal Investigator consortia and with important participation from NASA.
Abstract
We re-analyzed the Herschel/PACS data of a sample of 55 brown dwarfs (BDs) and very low mass stars with spectral types ranging from M5.5 to L0. We investigated the dependence of disk structure on the mass of the central object in the substellar regime based on a homogeneous analysis of Herschel data from flux density measurements to spectral energy distribution (SED) modeling. The broadband SEDs were compiled by adding previous photometry at shorter wavelengths and (sub-)millimeter data. We performed detailed SED analysis for the 46 targets that show infrared (IR) excess emission using radiative transfer models and evaluated the constraints on the disk parameters through Bayesian inference. A systematic comparison between the derived disk properties and those of sun-like stars shows that the disk flaring of BDs and very low mass stars is generally smaller than that of their higher mass counterparts, the disk mass is orders of magnitude lower than the typical value found in T Tauri stars, and the disk scale heights are comparable in both sun-like stars and BDs. We further divided our sample into an early-type brown dwarf (ETBD) group and a late-type brown dwarf (LTBD) group by using spectral type () as the border criterion. We systematically compared the modeling results from Bayesian analysis between these two groups, and found the trends of flaring index as a function of spectral type also present in the substellar regime. The spectral type independence of the scale height is also seen between high-mass and very low-mass BDs. However, both the ETBD and LTBD groups feature a similar median disk mass of and no clear trend is visible in the distribution, probably due to the uncertainty in translating the far-IR photometry into disk mass, the detection bias and the age difference among the sample. Unlike previous studies, our analysis is completely homogeneous in Herschel/PACS data reduction and modeling with a statistically significant sample. Therefore, we present evidence of stellar-mass-dependent disk structure down to the substellar mass regime, which is important for planet formation models.
Key Words.
stars: low-mass – circumstellar matter – brown dwarfs – protoplanetary disks1 Introduction
How brown dwarfs (BDs) form is one of the main open questions in the field of star formation and remains a subject of debate although several scenarios have been proposed, for instance, a scaled down version of star formation processes, gravitational instabilities in disks and ejection of the stellar embryo (Reipurth & Clarke, 2001; Bate et al., 2003; Stamatellos & Whitworth, 2011; Chabrier et al., 2014, e.g.,). Similar to their higher mass counterparts, such as T Tauri stars, young BDs are shown to have circumstellar disks, producing substantial excess emission at wavelengths ranging from infrared (IR) to (sub)millimeter (Liu et al., 2003; Scholz et al., 2006; Bayo et al., 2012; Harvey et al., 2012a; Harvey et al., 2014; Ricci et al., 2014; Liu et al., 2015, e.g.,). Disks are also found around very faint objects with masses down to the planetary regime, for example (Luhman et al., 2005a, ,), LOri 156 (Bayo et al., 2012, ,), and OTS 44 (Luhman et al., 2005b; Joergens et al., 2013, ,). The phenomena of mass accretion and outflow, which are common by-products of the star formation process (e.g., Audard et al., 2014; Frank et al., 2014, for reviews), have also been detected in young BDs (Mohanty et al., 2005; Phan-Bao et al., 2008; Rigliaco et al., 2012; Joergens et al., 2012, e.g,) even down to the planetary mass regime (Bayo et al., 2012; Joergens et al., 2013, e.g.,). The dust evolution in BD disks appears to follow a similar manner (i.e., grain growth, settling and crystallization) to that in T Tauri disks, although observations suggest different timescales of dust processing in disks around different stellar mass hosts (Apai et al., 2005; Bouy et al., 2008; Pascucci et al., 2009; Riaz et al., 2012, e.g.,). These observations show that BDs resemble hydrogen-burning stars in many aspects during their early evolution, implying that they may form through the canonical star formation processes.
Characterizing the physical properties of disks plays a crucial role in understanding the formation mechanisms of BDs (Reipurth & Clarke, 2001; Bate et al., 2003, e.g.,) and planets. In addition, thorough comparisons between disk properties like the mass, flaring and scale height in different stellar mass regimes are very useful and important. So far, many works have been done in this direction. Early disk studies in substellar regime are mainly based on Spitzer data. For instance, Szűcs et al. (2010) investigated the IRAC and MIPS photometry of stars in the Chamaeleon I star formation region and found that disks around cooler objects are generally flatter than the case of earlier type stars. The Herschel space telescope has unprecedented sensitivity and angular resolution in the far-IR, enabling the detection of many faint disks at this wavelength domain for the first time. The Herschel data on one hand improve the determination of disk properties, and on the other hand provide an alternative way to estimate the disk mass of BDs. Harvey et al. (2012a) observed a large sample of low-mass stars and BDs with Herschel/PACS and found that the disk masses of low-mass stars and BDs extend to well below typical values found in T Tauri stars. The lower disk mass around cooler stars as revealed by far-IR measurements is consistent with the strong correlation between the stellar and disk masses given by Andrews et al. (2013) from a millimeter survey of sources in the Taurus molecular cloud. Several recent works obtained similar results, although the sample size and assumptions used to analyze the Herschel data differ (Alves de Oliveira et al., 2013; Spezzi et al., 2013; Olofsson et al., 2013; Liu et al., 2015, e.g.,). Note that the above disk comparisons were mostly conducted between two stellar mass bins, i.e., the sun-like stars and the BDs including very low mass stars. These works have yielded some evidence of spectral-type-dependent disk structure in the low stellar mass regime.
To date, however, there are seldom studies to investigate the dependency of disk properties on the spectral type (or the mass) of the central object within the substellar regime. It is quite unclear that whether the observed trend of disk properties as a function of spectral type is also valid down to very low-mass BDs and even toward planetary mass objects. This kind of study needs great care because the disk parameters are not direct observables and determining them needs additional assumptions like the disk model and dust opacity used in the spectral energy distribution (SED) analysis. Moreover, the Herschel data nowadays is better understood and this knowledge leads to difference with reported fluxes and uncertainties published at the early stages of the mission (Balog et al., 2014), which will in turn induce discrepancy in the value of parameters used to describe the disk structure. Considering these factors, it is not appropriate to analyze the results collected from the literatures that reduce and model the Herschel data in different ways. This may be another reason why Olofsson et al. (2013) did not find a correlation between the stellar and disk masses in the substellar mass regime from a comparison between their results and those in the literature.
In this work, we re-analyzed the Herschel/PACS data of a sample of 55 BDs and very low mass stars, and fit their broadband SEDs using self-consistent radiative transfer models with as few free parameters as possible. We estimated the constraints on key disk parameters (i.e., flaring index, scale height and disk mass) through Bayesian analysis. We extensively discussed the trends on these parameters as a function of spectral type. Since our analysis is homogeneous from data reduction to modeling within a statistically significant sample, we present the first comprehensive study of stellar-mass-dependent disk structure down to the planetary mass regime.
2 Sample
Our sample consists of 55 spectroscopically confirmed targets in nearby star formation regions. The spectral types (SpTs) of the sample are in the range from M5.5 to L0. Thus most of the sources have substellar masses according to theoretical evolutionary models (Baraffe et al., 2003, e.g.,). We do not include any BD candidate lacking spectroscopic confirmation to avoid identification work and ambiguity of the results. Evidence for circumstellar dust emission as revealed by thermal IR measurements is a crucial criterion of our sample selection.
The sample of this paper was selected based on the study by Harvey et al. (2012a) on one hand and a search for the lowest mass objects in the Herschel/PACS archive on the other hand. Harvey et al. (2012a) conducted the first comprehensive Herschel/PACS program to measure far-IR emission from young BDs. We re-perform the analysis for the objects in their survey that satisfy the above criteria. For each of these targets, we will provide the modeling results that were not reported in their work. In addition, we include the lowest-mass BDs (with SpT M8 and later) observed with PACS from the Herschel archive to probe differences in disk properties between high-mass and low-mass BDs. Furthermore, we also add several targets without clear excess at near- and mid-IR, which are thought to have experienced significantly inside-out disk evolution, but the cool and outer regions of the disk, if survived, are sensitive to Herschel observations. We note that including all substellar objects from the Herschel/PACS archive in our analysis - although desirable - was not possible due to limited computational power. The sample presented here is therefore biased towards very low-mass substellar objects.
Since the SpT is a good proxy for stellar mass in the low stellar mass regime, our sample can be generally divided into two groups: (1) a group of 30 early-type brown dwarfs (ETBDs) with spetral type earlier than M8, (2) a group of 25 late-type brown dwarfs (LTBDs) with spetral type M8 and later. With this kind of division, we can investigate the dependence of the disk structure on the mass of the central object in the substellar mass regime, which will yield important clues to understand the formation mechanism of BDs and planets.
Table 1 summarizes the properties of our sample, including target name, coordinates and SpT. Our targets are located in eight different star formation regions with ages ranging from (e.g., Taurus and Ophiuchus) to (e.g., TW Hydrae association and Upper Scorpius), see Table 2 for a summary of the cloud ages and distances. The effects of a mixed sample age on the results are discussed in detail in Sect. 5. Note that for our sample we cannot evaluate the disk frequency of BDs at far-IR due to the incompleteness of sample selection and the detection bias in various clouds at different distances to the Earth.
| ID | Name | RA | DEC | ObsIDs | 70 m | 160 m | SpT | Cloud | Ref | SD | Multiplicity |
|---|---|---|---|---|---|---|---|---|---|---|---|
| (J2000) | (J2000) | [mJy] | [mJy] | ||||||||
| 1 | SSSPM1102 | 11 02 09.83 | 34 30 35.5 | 1342221849/50 | 9.80 1.03 | 8.02 1.10 | M8.5 | TWA | 1, 2 | ||
| 2 | 2M1207 | 12 07 33.47 | 39 32 54.0 | 1342202557/58 | 7.24 1.03 | 17 | M8.0 | TWA | 3, 2 | binary | |
| 3 | 2MJ160859 | 16 08 59.54 | 38 56 27.6 | 1342227823/24 | 7.4 2.0 | 35 | M8.0 | Lup III | 4, 2 | ||
| 4 | GY92 3 (ISO 032) | 16 26 21.90 | 24 44 39.8 | 1342238816/17 | 49.75 5.58 | 647 | M8.0 | Oph | 5, 6 | ||
| 5 | GY92 264 | 16 27 26.58 | 24 25 54.4 | 1342238816/17 | 33.26 5.45 | 1489 | M8.0 | Oph | 5, 6 | ||
| 6 | GY92 310 | 16 27 38.63 | 24 38 39.2 | 1342238816/17 | 120.28 5.45 | 1032 | M8.5 | Oph | 7, 6 | Y1 | |
| 7 | CFHTWIR96 | 16 27 40.84 | 24 29 00.7 | 1342227841/42 | 193 | 1192 | M8.25 | Oph | 8, 2 | ||
| 8 | OTS 44 | 11 10 09.34 | 76 32 17.9 | 1342238816/17 | 4.63 1.03 | 211 | M9.5 | Cha I | 9, 10 | ||
| 9 | 2MJ111145 | 11 11 45.34 | 76 36 50.5 | 1342223476/77 | 2.84 1.03 | 33 | M8.0 | Cha I | 11, 2 | ||
| 10 | J125758.7-770120 | 12 57 58.70 | 77 01 19.5 | 1342212708/09 | 243 | M9.0 | Cha II | 12, 13 | |||
| 11 | KPNO 6 | 04 30 07.24 | +26 08 20.8 | 1342227011/12 | 4 | 47 | M9.0 | Tau | 14, 2 | ||
| 12 | KPNO 7 | 04 30 57.19 | +25 56 39.5 | 1342227999/8000 | 2.61 1.03 | 69 | M8.25 | Tau | 14, 2 | ||
| 13 | J04574903+3015195* | 04 57 49.03 | +30 15 19.5 | 1342243478/79 | 8 | 14 | M9.25 | Tau | 15, 16 | ||
| 14 | J04354526+2737130* | 04 35 45.26 | +27 37 13.1 | 1342243466/67 | 11 | 14 | M9.2 | Tau | 17, 16 | ||
| 15 | J04334291+2526470* | 04 33 42.92 | +25 26 47.0 | 1342243084/85 | 7 | 20 | M8.75 | Tau | 17, 16 | ||
| 16 | J04335245+2612548 | 04 33 52.46 | +26 12 54.9 | 1342243080/81 | 8.00 2.32 | 26 | M8.5 | Tau | 18, 16 | Y1 | |
| 17 | J04290068+2755033 | 04 29 00.68 | +27 55 03.4 | 1342243066/67 | 9 | 36 | M8.25 | Tau | 17, 16 | ||
| 18 | KPNO 4* | 04 27 28.00 | +26 12 05.3 | 1342242064/65 | 9 | 13 | L0 | Tau | 15, 16 | ||
| 19 | J04215450+2652315* | 04 21 54.51 | +26 52 31.5 | 1342242033/34 | 7 | 23 | M8.5 | Tau | 17, 16 | ||
| 20 | J04263055+2443558 | 04 26 30.55 | +24 43 55.9 | 1342242023/24 | 8.00 2.22 | 33 | M8.75 | Tau | 17, 16 | Y1 | |
| 21 | J04274538+2357243* | 04 27 45.38 | +23 57 24.3 | 1342242021/22 | 9 | 23 | M8.25 | Tau | 17, 16 | ||
| 22 | J04302365+2359129 | 04 30 23.66 | +23 59 13.0 | 1342242009/10 | 7 | 13 | M8.5 | Tau | 17, 16 | ||
| 23 | J04311907+2335047* | 04 31 19.07 | +23 35 04.7 | 1342242007/08 | 8 | 15 | M8.0 | Tau | 19, 16 | ||
| 24 | KPNO 9 | 04 35 51.43 | +22 49 12.0 | 1342241979/80 | 12 | 16 | M8.5 | Tau | 20, 16 | ||
| 25 | J04361030+2159364 | 04 36 10.31 | +21 59 36.5 | 1342241975/76 | 8 | 16 | M8.5 | Tau | 17, 16 | ||
| 26 | J04325119+1730092* | 04 32 51.20 | +17 30 09.2 | 1342241957/58 | 9 | 19 | M8.25 | Tau | 21, 16 | ||
| 27 | KPNO 1* | 04 15 14.71 | +28 00 09.6 | 1342241914/15 | 6 | 19 | M8.75 | Tau | 15, 16 | ||
| 28 | KPNO 12 | 04 19 01.27 | +28 02 48.7 | 1342241888/89 | 6 | 49 | M9.25 | Tau | 15, 16 | ||
| 29 | J04221332+1934392 | 04 22 13.32 | +19 34 39.2 | 1342241878/79 | 10 | 24 | M8.0 | Tau | 17, 16 | binary | |
| 30 | J04414489+2301513 | 04 41 44.90 | +23 01 51.4 | 1342240750/51 | 12 | 17 | M8.5 | Tau | 17, 16 | Y1 | binary |
| 31 | ISO 138 | 11 08 18.51 | 77 30 40.8 | 1342218699/700 | 4.52 1.02 | 89 | M6.5 | Cha I | 22, 2 | ||
| 32 | ISO 217 | 11 09 52.16 | 76 39 12.8 | 1342223474/75 | 10.47 1.10 | 507 | M6.25 | Cha I | 23, 2 | ||
| 33 | CHAHA6 | 11 08 39.52 | 77 34 16.7 | 1342223486/87 | 14.50 1.10 | 54 | M5.75 | Cha I | 23, 2 | ||
| 34 | 2MJ110703 | 11 07 03.69 | 77 24 30.7 | 1342223480/81 | 28.48 1.02 | 447 | M7.5 | Cha I | 24, 2 | Y1, Y2 | |
| 35 | CHAHA9 | 11 07 18.61 | 77 32 51.7 | 1342223482/83 | 15.30 1.01 | 220 | M5.5 | Cha I | 23, 2 | Y1 | |
| 36 | ISO 252 | 11 10 41.42 | 77 20 48.1 | 1342223478/79 | 8.81 1.10 | 122 | M6.0 | Cha I | 23, 2 | ||
| 37 | ISO 165 | 11 08 54.97 | 76 32 41.1 | 1342223470/71 | 45.46 1.02 | 31.89 7.03 | M5.5 | Cha I | 23, 2 | ||
| 38 | CHAII1258 | 12 58 06.76 | 77 09 09.5 | 1342224206/07 | 5.06 1.01 | 116 | M6.0 | Cha II | 25, 2 | ||
| 39 | CHAII1308 | 13 08 27.14 | 77 43 23.3 | 1342224204/05 | 6.43 1.01 | 37 | M6.0 | Cha II | 25, 2 | ||
| 40 | CFHTTAU12 | 04 33 09.46 | +22 46 48.7 | 1342227013/14 | 7 | 54 | M6.5 | Tau | 17, 2 |
References. (1) Scholz et al. (2005); (2) Harvey et al. (2012a); (3) Gizis (2002); (4) Allen et al. (2007); (5) Wilking et al. (2005); (6) Alves de Oliveira et al. (2013); (7) Wilking et al. (1999); (8) Alves de Oliveira et al. (2010); (9) Luhman et al. (2004); (10) Joergens et al. (2013); (11) Luhman (2007); (12) Spezzi et al. (2008); (13) Spezzi et al. (2013); (14) Guieu et al. (2007); (15) Canty et al. (2013); (16) Bulger et al. (2014); (17) Luhman (2006); (18) Luhman et al. (2006); (19) Slesnick et al. (2006); (20) Briceño et al. (2002); (21) Luhman et al. (2009); (22) Luhman (2004); (23) Damjanov et al. (2007); (24) Luhman et al. (2008); (25) Gully-Santiago et al. (2011); (26) Rigliaco et al. (2011); (27) Martín et al. (2004); (28) Ardila et al. (2000).
| ID | Name | RA | DEC | ObsIDs | 70 m | 160 m | SpT | Cloud | Ref | SD | Multiplicity |
|---|---|---|---|---|---|---|---|---|---|---|---|
| (J2000) | (J2000) | [mJy] | [mJy] | ||||||||
| 41 | CFHTTAU9 | 04 24 26.46 | +26 49 50.4 | 1342227059/60 | 10.64 1.09 | 26 | M6.25 | Tau | 17, 2 | ||
| 42 | SORI053825 | 05 38 25.44 | 02 42 41.3 | 1342226721/22 | 12 | 22 | M7.0 | Ori | 26, 2 | ||
| 43 | OPHALL1622 | 16 22 44.94 | 23 17 13.4 | 1342227839/40 | 5.75 1.02 | 160 | M6.0 | Oph | 25, 2 | Y1 | |
| 44 | 2MJ160737 | 16 07 37.73 | 39 21 38.8 | 1342227813/14 | 16.15 1.02 | 8.54 1.61 | M5.75 | Lup III | 4, 2 | ||
| 45 | DENIS 1603 | 16 03 34.71 | 18 29 30.4 | 1342227831/32 | 3.60 1.01 | 22 | M5.5 | Upper Sco | 27, 2 | ||
| 46 | USCO112 | 16 00 26.70 | 20 56 31.6 | 1342227140/41 | 5 | 12 | M5.5 | Upper Sco | 28, 2 | ||
| 47 | USCO128 | 15 59 11.36 | 23 38 00.2 | 1342227134/35 | 5.69 1.02 | 25 | M7.0 | Upper Sco | 28, 2 | Y2 | |
| 48 | USCO55 | 16 02 45.60 | 23 04 50.0 | 1342227136/37 | 13.26 1.02 | 11 | M5.5 | Upper Sco | 28, 2 | Y2 | |
| 49 | USD155556 | 15 55 56.01 | 20 45 18.7 | 1342227138/39 | 15.92 1.01 | 11 | M6.5 | Upper Sco | 27, 2 | Y1, Y2 | |
| 50 | USD155601 | 15 56 01.04 | 23 38 08.1 | 1342227132/33 | 7.52 1.01 | 37 | M6.5 | Upper Sco | 27, 2 | Y2 | |
| 51 | USD160603 | 16 06 03.91 | 20 56 44.4 | 1342227142/43 | 3.49 1.01 | 24 | M7.5 | Upper Sco | 27, 2 | ||
| 52 | USD160958 | 16 09 58.53 | 23 45 18.6 | 1342227146/47 | 6.07 1.01 | 18 | M6.5 | Upper Sco | 27, 2 | ||
| 53 | USD161005 | 16 10 05.42 | 19 19 36.3 | 1342227829/30 | 5.37 1.01 | 8.80 1.61 | M7.0 | Upper Sco | 27, 2 | ||
| 54 | USD161833 | 16 18 33.18 | 25 17 50.5 | 1342227827/28 | 10.42 1.02 | 93 | M6.0 | Upper Sco | 27, 2 | binary | |
| 55 | USD161939 | 16 19 39.76 | 21 45 35.0 | 1342227835/36 | 15.88 1.01 | 42 | M7.0 | Upper Sco | 27, 2 | binary |
| Cloud | Distance | Age | Reference |
|---|---|---|---|
| (pc) | (Myr) | ||
| Ophiuchus (Oph) | 1, 2 | ||
| Taurus (Tau) | 3, 4 | ||
| Chamaeleon I (Cha I) | 1, 5 | ||
| Chamaeleon II (Cha II) | 1, 6 | ||
| Lupus III (Lup III) | 1, 7 | ||
| Orionis ( Ori) | 1, 8 | ||
| Upper Scorpius (Upper Sco) | 1, 9 | ||
| TW Hydrae association (TWA) | 10, 11 |
References. (1) Reipurth (2008b); (2) Wilking et al. (2005); (3) Reipurth (2008a); (4) Briceño et al. (2002); (5) Luhman (2007); (6) Spezzi et al. (2008); (7) Comerón et al. (2009); (8) Sherry et al. (2004); (9) Pecaut et al. (2012); (10) Ducourant et al. (2014); (11) Barrado Y Navascués (2006).
3 Observations and data reduction
All the targets have been observed by the Photodetector Array Camera and Spectrograph (Poglitsch et al., 2010, PACS;) on board Herschel with various programs (André et al., 2010; Harvey et al., 2012a; Alves de Oliveira et al., 2013; Bulger et al., 2014). The ObsIDs for all the observations are listed in Table 1. The majority of the observations were performed in the mini-scan map mode. The only exceptions are those for GY92 3, GY92 264, GY92 310 and J125758.7-770120. They were observed in the standard PACS scan map mode. Parallel mode observations were not considered. We took the data from the Herschel Science Archive at the processing stage of Level 1, Version 12.1 of the standard pipeline (SPG = Standard Product Generation) and further processed the data by producing maps and by conducting photometry.
3.1 Mapping
The Level 1 data from the archive are fully calibrated (Balog et al., 2014). Only the last steps to Level 2 and 2.5 are missing, which consist of deglitching, signal drift suppression and mapping to convert the detector data into a map that superimposes the detector signals for any given position on the sky covered during the observation.
Since we are only interested in the point sources, the highpass filtering algorithm was applied to get rid of the background and detector signal drifts. This approach only conserves the source flux, if an object mask indicates those parts of the data that are not considered as background. For very faint objects like BDs, the mask produced by the SPG is insufficient. Therefore, we produced new and adequate source masks from Level 2.5 SPG maps (scan and cross-scan pairs are coadded) based on a signal-to-noise criterion.
After deglitching the data as done by the SPG, we produced maps using the photProject task. It converts the flux distribution as measured by the fixed detector pixel grid into a rebinned map, where the flux is redistributed on a freely selectable and virtual pixel grid. Since the map pixels are usually smaller, distorted and rotated relative to the detector pixels, the flux distribution must and can be done with great care. There is a “drizzling” algorithm, originally invented for the HST that allows modifying crucial parameters when doing this (Fruchter & Hook, 2002).
The SPG uses a so-called drop size that is relatively large. This is a scaling factor of the detector pixel sizes that is applied before projecting them on the final map grid. This leads to a redistribution of the source flux on larger areas of the final map. This produces prettier, i.e. smoother images due to the convolution of neighbouring detector pixel signals. But this also averages out noise, which leads to an underestimate of the real detector noise. Reducing the drop size can minimize this effect. The images look sharper, but also noisier. However, the resulting noise properties are much closer to the reality than what one gets with large drop sizes. Therefore, the subsequent photometry is also more accurate. We adopted 0.1 as the drop size for all maps. The pixel sizes were chosen to be at and at .
Finally, we combine the map pairs of a so-called scan and a cross scan, corresponding to the Level 2.5 stage of the SPG.
3.2 Photometry
Since the sources are very faint and the vicinities around the targets of interest are full of other and brighter sources, a simple aperture photometry procedure is not sufficient. Therefore, we applied a HIPE built-in source extraction and photometry tool called Sussextractor. It is based on Bayesian statistics and delivers the most likely result for the target position and the integrated source flux by fitting 2D Gaussians to the detected sources (Savage & Oliver, 2007).
A Gaussian source model is not adequate for the more complicated PSF shape of Herschel/PACS point sources. Only the core of the PACS PSF is close to Gaussian, but it also contains a trilobal shape at a level of a few percent of the peak intensity superimposed by an extended and slowly declining halo. Therefore, a correction factor has to be applied to the photometry derived by Sussextractor.
For this purpose, we reprocessed standard star data of alpha Boo (a PACS prime standard) in the same way as the BDs and then applied the Sussextractor algorithm and compared the results with the ones derived from a standardized aperture photometry procedure including an aperture correction that was derived during the PACS flux calibration program. The multiplicative correction factors turned out to be 1.513 at 70 m and 1.427 at 160 m. The photometry errors given by the Sussextractor tool were corrected in the same way and regarded as the photometric errors. Additional systematic uncertainties were not considered. For non-detections, upper limits have been obtained by a statistical analysis of a series of aperture photometry measurements on the background as explained in Balog et al. (2014). This approach avoids underestimating the noise obtained from the map pixel statistics that is affected by correlation artefacts introduced by the drizzling algorithm.

3.3 General trends of the observational data
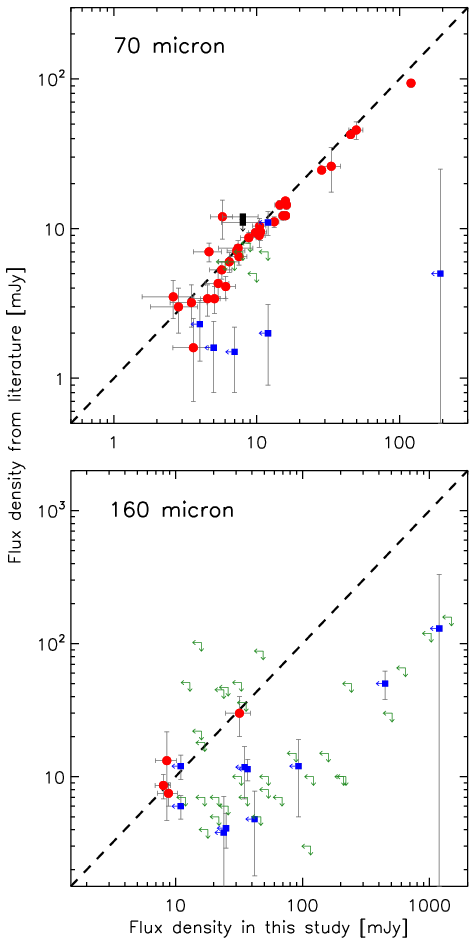
The measured flux densities at PACS bands are summarized in Table 1, whereas Figure 1 shows a comparison between our results and previously published photometry. It is clear that most detections at by other studies are confirmed with our reanalysis of the data. In particular, our flux measurements of the detected sources are in agreement with previous results (see the red dots in the upper panel of Figure 1). However, we obtained less than one half of detections that are reported before. This is probably because Herschel images of faint disks are easily contaminated with the extended emission from the background, and the effects of using different data reduction algorithms on the results are significant in this case. In Table 1, we mark two kinds of objects for which the re-analyzed PACS photometry are significantly different from the literature values: (1) the difference in the flux density between our and previous results is larger than , where refers to the RMS level for each object given here; (2) firm detections reported before, but upper limits deduced by us, and vice versa. Since the constraints on the disk structure, especially the structure of the outer and cool regions of the disk, are sensitive to far-IR data points (Harvey et al., 2012a; Harvey et al., 2012b; Olofsson et al., 2013, e.g.,), the discrepancies in the PACS photometry between our and previous results will result in different model explanations of the data. Therefore, our homogeneous analysis of the Herschel data and subsequent self-consistent modeling have the potential to retrieve the hidden statistical trends of disk properties in the substellar mass regime.
We generated the cumulative distributions of PACS photometry, using the Kaplan-Meier product-limit estimator to properly account for censored data sets, i.e., upper limits on (Feigelson & Nelson, 1985). This was done to examine any statistical difference in the far-IR emission between the two groups differing in terms of SpT. All flux densities are scaled by assuming a distance of 100 pc. The results are shown in Figure 2. The LTBD sample (red line) has systematically lower flux densities than those of the ETBD group (blue line), which is consistent with the finding by Liu et al. (2015) that the amount of Herschel far-IR emission correlates well with the SpTs of the host BDs. From the distribution, the median flux densities are estimated, which we show as the vertical dashed lines. The median flux density of the ETBD group is , which is at least three times larger than that of the LTBDs, i.e., . We consider the latter case as an upper limit because more than half of the sources are undetected at this wavelength (Mathews et al., 2013). Due to the same reason, we do not perform the Kaplan-Meier product-limit estimation for the data.
From a theoretical point of view, disks with a larger flaring index intercept a larger portion of the central star’s radiation due to a larger flaring angle and consequently re-emit more IR flux (Chiang & Goldreich, 1997, e.g.,). The systematically lower flux density at far-IR wavelengths of the LTBDs implies that disks around lower mass stars are generally less flared. Bulger et al. (2014) investigated the effect of individual disk parameter on the appearance of the SED, and their results indicate that the flaring index and scale height work together to determine the emission level at Herschel/PACS bands. Moreover, the observational trends of far-IR flux densities may also help us to consider whether there is any evidence for differences in disk mass with different stellar masses, since the Herschel/PACS photometry can provide a rough mass estimation of BD disks (Harvey et al., 2012a; Spezzi et al., 2013; Liu et al., 2015, e.g.,). Nevertheless, interpreting the observational trends presented here needs detailed SED analysis, in which efforts of reducing model degeneracy should be made as far as possible given that the data available are limited.
4 SED Modeling
All the targets have been observed over a broad range of wavelengths. We constructed the broadband SEDs of our sources by using our Herschel/PACS flux measurements and adding ancillary data at optical and mid-IR wavelengths, from SDSS catalog (Ahn et al., 2012), DENIS survey (DENIS Consortium, 2005), 2MASS (Cutri et al., 2003), Spitzer and WISE catalogs (Cutri et al., 2012, e.g.,). We also took into account the upper limits of flux measurements in the (sub-)millimeter regime available for a few of our sources (Mohanty et al., 2013; Broekhoven-Fiene et al., 2014, e.g.,). We derived the (sub)stellar properties of each target from thoroughly modeling the photosphere. For the 46 targets that show IR excess produced by circumstellar dust, we conducted detailed SED analysis using the radiative transfer code MC3D developed by Wolf (2003) in order to characterize the structure of their surrounding disks.
4.1 Determination of the (sub)stellar properties
We performed a thorough modeling of the photosphere of each object by fitting the BT-Settl models (Allard et al., 2012) with a minimization as well as Bayesian statistics (Bayo et al., 2008; Bayo et al., 2014). The BT-Settl models incorporate a sophisticated treatment of photospheric dust, which is likely to affect the atmospheres and correspondingly the radiation field of cool objects like BDs in our sample. The broad-band photometry for the photospheric part of the SED are taken into account in the fitting procedure. A similar analysis was done by Joergens et al. (2013) for their case study of OTS 44, a BD at the planetary mass border.
For objects in star-forming regions, we use the standard distances with errors to the cloud as given by the Handbook of Star formation (Reipurth, 2008b; Reipurth, 2008a), while the kinematic distances for objects in loose associations are adopted (Ducourant et al., 2014, e.g.,). The extinction is treated as a free parameter. For objects in star-forming regions, we use as starting point upper limits for the extinction based on extinction maps from Kainulainen et al. (2009) and Cambresy et al. (1997). For objects in loose associations, we consider an upper limit of 0.1 mag, and for Ori, we convert the standard E(B-V) value to extinction assuming since this is the basic assumption for the extinction law used in VOSA (Bayo et al., 2008).
The derived best-fit () and most probable values for the effective temperatures, luminosities, and extinctions are in good agreement with each other for of the objects. For a few cases, we only get moderate fitting results: (i) for object 21 (J04274538+2357243), the extinction is loosely constrained, we therefore took the value that minimizes the . (ii) for object 34 (2MJ110703), there is no data point bluer than 2MASS/J band. In this case, we fixed to 15 mag which is lower than the value of 16.5 mag estimated in Furlan et al. (2009), but is in agreement with the one derived by Luhman et al. (2008). (iii) object 36 (ISO 252) for which the best and second best fits are indistinguishable in terms of and the Bayesian analysis shows that it is hard to break the degeneracy between and . We took the best-fit parameter set for this object. The derived effective temperatures, luminosities and extinctions are summarized in Table 3.
4.2 Disk model
Dust distribution: We employed the standard flared disk model with well-mixed gas and dust, which has been successfully used to explain the observed SEDs of a large sample of young stellar objects and BDs (Wolf et al., 2003; Sauter et al., 2009; Harvey et al., 2012a; Joergens et al., 2013; Liu et al., 2015, e.g.,). The structure of the dust density is assumed with a Gaussian vertical profile
| (1) |
and the surface density is described as a power-law function
| (2) |
where is the radial distance from the central star measured in the disk midplane, and is the scale height of the disk. The disk extends from an inner radius to an outer radius . To the best of our knowledge, among our sample, there are 5 objects that have been identified as binary systems so far. They are 2M1207 (Chauvin et al., 2004, ,), J04221332+1934392 (Todorov et al., 2014, ,), J04414489+2301513 (Todorov et al., 2014, ,), USD161833 (Bouy et al., 2006, ,) and USD161939 (Bouy et al., 2006, ,), where refers to the separation within the system. The disks around individual components in binary systems are expected to have truncation radii of the order of (Papaloizou & Pringle, 1977). We adopted as the disk outer radii for 2M1207, USD161833 and USD161939. For the close pairs (, J04221332+1934392 and J04414489+2301513), dynamical simulations of star-disk interactions suggest that individual disks are unlikely to survive (Artymowicz & Lubow, 1994, e.g.,). Disk modeling is complicated in those close multiple systems. For simplicity, we assume that the emission is associated with circumbinary disks of in size. For other objects, we fix in the modeling, because the choice of this parameter value makes essentially no difference to the synthetic SEDs in the simulated wavelength range (Harvey et al., 2012a). The scale height follows the power law distribution
| (3) |
with the exponent characterizing the degree of flaring and representing the scale height at a distance of
from the central star. The indices , , and are codependent through .
We fix that is the typical value found for T Tauri disks in the sub-millimeter (Isella et al., 2009; Guilloteau et al., 2011, e.g.,),
since only spatially resolved data can place constraints on this parameter (Ricci et al., 2013; Ricci et al., 2014, e.g.,).
Dust properties:
We assume the dust grains to be a homogeneous mixture of 75% amorphous silicate and 25% carbon with
a mean density of and the complex refractive indices given
by Jäger et al. (1994), Dorschner et al. (1995) and Jäger et al. (1998). Porous grains are not considered
because the fluxes at wavelengths beyond are almost independent of the degree of
grain porosity in low mass disks, as shown by Kirchschlager & Wolf (2014).
The grain size distribution is given by the standard power law with
minimum and maximum grain sizes and , respectively.
The choice of the minimum value for the grain size, , ensures that its exact value has a negligible impact on the
synthetic SEDs. Since there is no information about the maximum grain sizes of our target disks, as provided e.g., by the
(sub-)millimeter spectral index, we adopt . The Herschel/PACS far-IR observations are
sensitive to dust grains with this assumed sizes. Strong grain growth up to millimeter sizes as detected in some BD disks
(Ricci et al., 2012; Ricci et al., 2013; Broekhoven-Fiene et al., 2014; Ricci et al., 2014, e.g.,) would remain undetected in our data and could affect the
disk mass. Our prescription for the dust properties is identical to those used in Liu et al. (2015).
Heating sources:
The disk is assumed to be passively heated by stellar irradiation (Chiang & Goldreich, 1997; Dullemond et al., 2001, e.g.,).
Other heating sources, such as the viscous accretion, are not taken into account as this would only introduce
further free parameters without any qualitative constraints from the modeling.
We use the BT-Settl atmosphere models (Allard et al., 2012) as incident flux with parameters as
constrained in Sect. 4.1. The radiative transfer problem is solved self-consistently
considering 100 wavelengths, which are logarithmically distributed in the range
of [, ].
| ID | |||||||||||
|---|---|---|---|---|---|---|---|---|---|---|---|
| [K] | [10] | [mag] | [AU] | [10] | [10] | [AU] | [AU] | [∘] | |||
| 1 | 2400 | 0.355 0.106 | 0.1 0.01 | 0.004 | 1.0 | 1.0 | 1.10 | 1.10 | 20 | 20 | 60 |
| 2 | 2500 | 2.367 0.336 | 0.1 0.01 | 0.025 | 0.1 | 0.1 | 1.175 | 1.175 | 14 | 14 | 45 |
| 3 | 2100 | 6.139 1.852 | 0.26 0.26 | 0.038 | 3.16 | 1.0 | 1.10 | 1.10 | 16 | 16 | 15 |
| 4 | 2800 | 64.2 10.49 | 3.6 0.15 | 0.041 | 3.16 | 3.16 | 1.10 | 1.10 | 16 | 16 | 30 |
| 5 | 2800 | 23.18 4.020 | 2.28 0.18 | 0.025 | 10.0 | 10.0 | 1.10 | 1.125 | 20 | 18 | 30 |
| 6 | 2800 | 81.15 12.94 | 7.2 0.25 | 0.317 | 10.0 | 10.0 | 1.125 | 1.125 | 14 | 14 | 60 |
| 7 | 2600 | 379.1 58.95 | 3.94 0.98 | 0.015 | 0.1 | 0.32 | 1.15 | 1.15 | 20 | 20 | 15 |
| 8 | 1700 | 2.4 0.54 | 2.6 0.20 | 0.023 | 3.25 | 3.16 | 1.31 | 1.30 | 15.6 | 16 | 60 |
| 9 | 2800 | 5.459 0.352 | 3.0 0.19 | 0.038 | 3.16 | 3.16 | 1.20 | 1.175 | 8 | 10 | 15 |
| 10 | 2500 | 6.242 0.325 | 4.8 0.22 | 0.005 | 0.1 | 0.1 | 1.025 | 1.05 | 18 | 18 | 60 |
| 11 | 2600 | 3.54 0.192 | 1.35 0.1 | 0.005 | 1.0 | 0.32 | 1.10 | 1.10 | 8 | 10 | 30 |
| 12 | 2600 | 5.603 0.376 | 1.41 0.07 | 0.038 | 1.0 | 1.0 | 1.10 | 1.10 | 8 | 8 | 60 |
| 13 | 2200 | 1.221 0.080 | 0.2 0.03 | – | – | – | – | – | – | – | – |
| 14 | 2400 | 3.22 0.152 | 1.27 0.07 | – | – | – | – | – | – | – | – |
| 15 | 2500 | 5.591 0.237 | 1.89 0.1 | – | – | – | – | – | – | – | – |
| 16 | 2600 | 4.078 0.177 | 3.91 0.23 | 0.010 | 100 | 100 | 1.10 | 1.075 | 20 | 20 | 45 |
| 17 | 2700 | 10.43 0.429 | 1.71 0.1 | 0.051 | 3.16 | 1.0 | 1.10 | 1.125 | 8 | 10 | 45 |
| 18 | 1800 | 3.045 0.185 | 1.04 0.1 | – | – | – | – | – | – | – | – |
| 19 | 2500 | 3.749 0.159 | 3.45 0.18 | – | – | – | – | – | – | – | – |
| 20 | 2400 | 4.044 0.181 | 0.42 0.42 | 0.008 | 100 | 100 | 1.137 | 1.125 | 21 | 20 | 45 |
| 21 | 2200 | 2.814 0.165 | 0.57 0.08 | – | – | – | – | – | – | – | – |
| 22 | 2200 | 2.66 0.165 | 0.39 0.13 | 0.4 | 3.16 | 1.0 | 1.0 | 1.0 | 11 | 12 | 30 |
| 23 | 2700 | 18.74 0.799 | 2.42 0.17 | – | – | – | – | – | – | – | – |
| 24 | 2400 | 2.517 0.139 | 2.14 0.16 | 0.4 | 31.6 | 31.6 | 1.05 | 1.05 | 20 | 18 | 60 |
| 25 | 2000 | 2.8 0.140 | 0.0 0.04 | 0.159 | 3.16 | 1.0 | 1.05 | 1.075 | 8 | 6 | 45 |
| 26 | 2400 | 3.564 0.171 | 0.4 0.1 | – | – | – | – | – | – | – | – |
| 27 | 2300 | 2.862 0.137 | 0.9 0.1 | – | – | – | – | – | – | – | – |
| 28 | 3000 | 1.459 0.076 | 2.89 0.16 | 0.008 | 3.16 | 0.32 | 1.0 | 1.025 | 11 | 12 | 30 |
| 29 | 2200 | 20.46 0.884 | 0.56 0.04 | 0.9 | 1.0 | 0.1 | 1.0 | 1.0 | 2 | 2 | 60 |
| 30 | 2300 | 5.669 0.237 | 1.43 0.07 | 0.013 | 3.16 | 3.162 | 1.05 | 1.025 | 11 | 8 | 45 |
| 31 | 2800 | 10.15 0.612 | 0.95 0.32 | 0.044 | 0.32 | 0.32 | 1.20 | 1.20 | 18 | 20 | 45 |
| 32 | 2800 | 47.78 1.954 | 4.7 0.36 | 0.0377 | 10.0 | 10.0 | 1.05 | 1.075 | 8 | 10 | 45 |
| 33 | 2800 | 82.84 3.77 | 2.8 0.2 | 0.126 | 10.0 | 10.0 | 1.125 | 1.125 | 4 | 4 | 45 |
| 34 | 2600 | 27.39 0.995 | 15.0 | 0.051 | 316 | 316 | 1.175 | 1.175 | 20 | 20 | 45 |
| 35 | 2800 | 51.18 2.105 | 5.42 0.42 | 0.041 | 3.16 | 3.16 | 1.20 | 1.20 | 10 | 12 | 45 |
| 36 | 1900 | 17.52 0.933 | 2.31 0.33 | 0.051 | 10.0 | 3.16 | 1.025 | 1.05 | 12 | 12 | 45 |
| 37 | 3000 | 64.0 2.775 | 3.58 0.36 | 0.017 | 3.16 | 3.16 | 1.25 | 1.25 | 18 | 18 | 45 |
| 38 | 2200 | 30.73 6.521 | 7.74 0.48 | 0.025 | 0.32 | 1.0 | 1.10 | 1.125 | 18 | 18 | 60 |
| 39 | 2400 | 26.27 5.909 | 2.3 0.21 | 0.063 | 1.0 | 1.0 | 1.15 | 1.15 | 10 | 10 | 45 |
| 40 | 3000 | 43.82 1.729 | 4.3 0.29 | 0.015 | 0.1 | 0.1 | 1.05 | 1.025 | 4 | 4 | 30 |
| 41 | 2800 | 23.81 1.39 | 1.16 0.1 | 0.063 | 0.32 | 0.32 | 1.175 | 1.175 | 18 | 16 | 60 |
| 42 | 2800 | 28.93 5.848 | 0.04 0.01 | 0.025 | 10.0 | 10.0 | 1.075 | 1.075 | 18 | 14 | 60 |
| 43 | 2100 | 12.48 2.211 | 1.93 0.19 | 0.044 | 0.32 | 0.32 | 1.225 | 1.225 | 18 | 18 | 30 |
| 44 | 2400 | 16.49 5.241 | 1.02 0.26 | 0.018 | 1.0 | 1.0 | 1.225 | 1.225 | 20 | 18 | 30 |
| 45 | 2800 | 34.59 7.973 | 1.0 0.1 | 0.013 | 0.1 | 0.1 | 1.275 | 1.275 | 10 | 10 | 30 |
| 46 | 3000 | 13.02 3.103 | 0.6 0.1 | 0.021 | 0.32 | 0.32 | 1.175 | 1.175 | 12 | 12 | 60 |
| 47 | 2500 | 6.242 1.354 | 1.3 0.1 | 0.032 | 3.16 | 10.0 | 1.175 | 1.175 | 16 | 16 | 30 |
| 48 | 2900 | 30.6 7.081 | 0.3 0.1 | 0.012 | 1.0 | 1.0 | 1.15 | 1.15 | 14 | 14 | 45 |
| 49 | 3400 | 27.66 6.102 | 3.38 0.23 | 0.010 | 1.0 | 1.0 | 1.20 | 1.20 | 16 | 16 | 45 |
| 50 | 2800 | 10.34 2.422 | 1.3 0.1 | 0.007 | 31.6 | 31.6 | 1.125 | 1.15 | 18 | 18 | 30 |
| 51 | 2800 | 14.88 3.411 | 1.5 0.1 | 0.051 | 1.0 | 1.0 | 1.10 | 1.10 | 6 | 6 | 60 |
| 52 | 2600 | 26.31 6.167 | 0.6 0.1 | 0.01 | 0.32 | 0.32 | 1.20 | 1.225 | 10 | 10 | 45 |
| 53 | 2600 | 6.486 1.574 | 0.7 0.1 | 0.006 | 10.0 | 10.0 | 1.10 | 1.10 | 20 | 20 | 60 |
| 54 | 3000 | 42.35 9.502 | 1.7 0.1 | 0.014 | 0.3 | 0.32 | 1.20 | 1.20 | 8 | 8 | 30 |
| 55 | 3000 | 21.45 4.865 | 1.5 0.1 | 0.025 | 0.15 | 0.32 | 1.175 | 1.175 | 20 | 18 | 45 |


4.3 Fitting method
The task of SED fitting was conducted with a grid of pre-calculated models for each target. The model grids can give us an overview of the fitting quality in different parameter domains and clues to improve the quality of the fit with further attempts if necessary. Table 4 summarizes the explored ranges of each parameter considered here. The grid adds up to a total number of 37 440 models for each source. We tried to achieve a better explanation on the observations on one hand by reducing the dimensionality of the parameter space as far as possible and on the other hand by using a denser grid of models as compared to previous studies on Herschel/PACS data of BD disks (Harvey et al., 2012a; Harvey et al., 2012b; Alves de Oliveira et al., 2013; Olofsson et al., 2013; Spezzi et al., 2013, e.g.,). For objects, for which we could not obtain good results from the grid, simulated annealing approach was additionally invoked to improve the solution by taking the best model in the grid as the starting point of the Markov chain. Generally, steps for the local fit with simulated annealing are enough (Liu et al., 2013). This kind of methodology makes use of the advantages of both database method and simulated annealing algorithm and has already been demonstrated to be successful for SED analysis (Liu et al., 2012; Madlener et al., 2012).
| Parameter | Min | Max | Number of values | Sampling |
|---|---|---|---|---|
| [] | 1 | 100 | 6 | logarithmic |
| 1.0 | 1.3 | 13 | linear | |
| [AU] | 2 | 20 | 10 | linear |
| log [] | 6 | 2.5 | 8 | logarithmic |
| [∘] | 15 | 90 | 6 | linear |
The fitting results are displayed in Figure 3. The best-fit models are indicated as black solid lines, whereas the dashed lines represent the photospheric emission level. The corresponding disk parameter sets are listed in Table 3. The Spitzer/IRS spectra, when available, are taken into account by fitting the subjacent continuum. Since our goal is to characterize the overall structure of the disks, we therefore did not attempt to reproduce the exact shape of the silicate feature that is mainly related to silicate mineralogy of the dust in the disk atmosphere (Bouwman et al., 2008; Olofsson et al., 2010, e.g.,). We emphasize that the best fits presented here cannot be considered as a unique solution due to the degeneracy of SED models. Despite this, previous studies have shown that modeling SEDs with broad wavelength coverage can constrain the mass and geometry of disks around BDs (Harvey et al., 2012a; Harvey et al., 2012b; Olofsson et al., 2013; Spezzi et al., 2013, e.g.,). In particular, the Bayesian inference can analyze the potential correlations and interplay between different parameters in a statistical way (Pinte et al., 2008, e.g.,). We derived the Bayesian probability distributions of the disk parameters, from which we calculated the most probable values and estimated the validity ranges for each parameter, corresponding to regions where (Liu et al., 2015, e.g.,). The gray lines in Figure 3 denote all the models that are within the validity ranges.
5 Discussion
We re-analyzed the Herschel/PACS data of a sample of 55 BDs and very low mass stars in a homogeneous way and constructed their observed SEDs by complementing our Herschel photometry with previous flux measurements available at wavelengths ranging from optical to (sub-)millimeter. For the 46 targets that show IR excess emission, we characterized the properties of their surrounding disks using radiative transfer technique under identical assumptions for the modeling setup. Moreover, we evaluated the constraints on different disk parameters through Bayesian analysis.
Despite the good wavelength coverage of observations and efforts to reduce the degree of freedom, the degeneracy of SED models still exists. Therefore, we statistically analyzed the most probable results from Bayesian statistics, other than the best-fit models, because the former case is likely more representative of the overall fitting quality. The most probable parameter sets for each target are identified as the peak of Bayesian probability distribution. The derived values are summarized in Table 3.
5.1 Overview of modeling results
We characterized the studied disks by determining their inner radii , flaring indices , scale heights , disk masses and inclinations . The results are listed in Table 3. We give an overview of the statistical behaviour of these properties in the following.
The disk inner radius can be well constrained for all objects because the observed SEDs are well sampled in the near- and mid-IR domains. The inner radii of the disks are likely close to the dust sublimation radii , which are of the order of [0.0050.05 AU] from the faintest to the brightest targets in our sample. We found four candidates of BD transition disks with , i.e., source 22 (J04302365+2359129), source 24 (J04355143+2249119), source 25 (J04361030+2159364) and source 29 (J04221332+1934392). Current data indicate no detectable excess shortward of accompanying with a steep slope in the mid-IR of these four objects. However, none of them is detected at Herschel/PACS bands. Follow-up observations, in particular spatially resolved millimeter images, are required to clarify their evolutionary stages (Williams & Cieza, 2011; Andrews et al., 2011, e.g.,). The inclination of the disk cannot be constrained very well with the available SED data as shown by the flat probability distribution of this parameter nearly for all targets. Accurate determination of disk inclinations requires spatially resolved observations (Chiang & Goldreich, 1999; Robitaille et al., 2007, e.g.,).
The geometric structure of the disk is described by the flaring index and scale height according to the model ansatz, see Sect. 4.2. Our detailed SED analysis places tight constraints on the disk geometry, because the best-fit and are in good agreement with the most probable values (see Table 3) and the probability distribution functions are clearly non-flat for most objects (see the Appendix). We observed a preferential values of in the range , while the majority of the target disks are best modeled with of the order of . As shown by Harvey et al. (2012a) and Liu et al. (2015), most parts (except for the inner region) of typical BD disks produce optically thin emission at far-IR wavelengths, demonstrating the applicability of PACS photometry as a diagnosis for the disk mass of BDs. Objects with detections at 70 and/or 160μm allow reasonable determination of their disk masses as demonstrated by clear peaks in the Bayesian probability distributions of in these cases. For the remaining targets, the disk mass is not well constrained, typically showing two or three indistinguishable peaks in the probability distributions. Overall, the likely disk masses feature a wide range of [] with a median value of the order of , where we assume the dust properties as described in Sect. 4.2 and a gas-to-dust mass ratio of 100. Our statistical results on the disk parameters of substellar hosts are widely in agreement with previous findings from case studies and surveys, however, for individual sources presented here our measured PACS flux densities and correspondingly the model solutions differ from those of previous works (Harvey et al., 2012a; Harvey et al., 2012b; Riaz & Gizis, 2012; Alves de Oliveira et al., 2013; Joergens et al., 2012; Joergens et al., 2013; Spezzi et al., 2013, e.g.,). A few BDs detected at (sub)millimeter to date and their model explanations also support our results on the typical structural properties especially the mass of BD disks (Klein et al., 2003; Scholz et al., 2006; Mohanty et al., 2013; Ricci et al., 2012; Ricci et al., 2013; Ricci et al., 2014; Broekhoven-Fiene et al., 2014, e.g.,).
5.2 Comparison with disks around young stellar objects
Comparing the derived disk properties with those of their higher mass counterparts, such as T Tauri disks, can provide important insights into understanding the formation of BDs and very low mass stars. Several attempts have been made in this direction (Pascucci et al., 2009; Szűcs et al., 2010, e.g.,). Plenty of multi-wavelength data including spatially resolved ones exist for young stellar objects, leading to robust constraints on the structure and mass of their disks. In particular, coherent multi-wavelength modeling suggests a typical flaring index and a favorable range of for T Tauri disks (Wolf et al., 2003; Walker et al., 2004; Sauter et al., 2009; Madlener et al., 2012; Gräfe et al., 2013; Garufi et al., 2014, e.g.,). Based on (sub-)millimeter measurements of a large sample of young stellar objects in various star formation regions, the disk masses of T Tauri stars are found in the range of [] (Andrews & Williams, 2007; Lee et al., 2011; Sicilia-Aguilar et al., 2011; Andrews et al., 2013; Carpenter et al., 2014, e.g,).
We found significant evidence for different properties of disks between sun-like and cool stars, showing that disks around BDs and very low mass stars are generally flatter and orders of magnitude less massive than T Tauri disks. Although similar conclusions were drawn by previous studies (Pascucci et al., 2009; Szűcs et al., 2010; Olofsson et al., 2013), the evidence we found should be more significant because our results are based for the first time on a homogenous analysis all the way from Herschel data reduction and flux density measurement to SED modeling, and to interpretation. Theoretical models predict that disks around cooler stars should be more extended in the vertical direction (Walker et al. 2004). However, our results, together with previous studies (Harvey et al., 2012a; Alves de Oliveira et al., 2013; Olofsson et al., 2013, e.g.,), indicate that the disk scale height is independent of the host stellar mass. Dust growth and settling are the two pivotal physical processes simultaneously shaping the disk structure, for instance reducing the disk scale height (D’Alessio et al., 2006). Mid-IR observations have shown that these processes probably occur in early stages of the disk evolution (Furlan et al., 2006; McClure et al., 2010, e.g.,). Given the broad age spread, our targets may be at different evolutionary stages during which the degrees of dust growth and settling are not at the same level. This will probably weaken any relation, if present, between the scale height and the (sub-)stellar mass. Nevertheless, analyses of coeval samples, for example in Cha I (Olofsson et al., 2013) and Oph (Alves de Oliveira et al., 2013), also indicate that disk scale heights are comparable in both sun-like stars and BDs. Future high-resolution (sub-)millimeter observations are indispensable to quantify the degree of dust settling and better constrain the disk scale height (Sauter et al., 2009; Boehler et al., 2013, e.g.,).
5.3 Dependence of disk parameters on the mass of substellar hosts
There is growing observational evidence that disk evolution depends on the mass of the central object. For example, the primordial dust disks are believed to live longer for cool stars, because the observed disk frequency of cool stars and BDs is higher in comparison with sun-like stars (Carpenter et al., 2006; Scholz et al., 2007; Riaz & Gizis, 2008; Bayo et al., 2012; Ribas et al., 2015, e.g.,). The observed trend of small disk accretion rates of BDs indicates that the scaling between the accretion rate and stellar mass (i.e., ) deduced mainly from low- and intermediate-mass stars extends to the substellar mass spectrum (Muzerolle et al., 2005; Mohanty et al., 2005; Herczeg et al., 2009; Bayo et al., 2012, e.g.,). Analysis of Spitzer/IRS spectra demonstrates that the dust processing, such as grain growth and crystallization, in the mid-IR emitting regions of BDs and very low mass stars appears to be more advanced than in disks around sun-like stars with similar age (Apai et al., 2005; Pascucci et al., 2009; Riaz, 2009, e.g.,). Moreover, Pascucci et al. (2013) also found stellar-mass-dependencies in the atomic and molecular content of disk atmospheres.
Searching for evidence of stellar-mass-dependent disk properties is very common and interesting, because it has important implications for planet formation theories. Szűcs et al. (2010) divided young stellar objects and BDs in the Chamaeleon I star-forming region into two groups with SpTs earlier or later than M4.5. Through modeling the median SEDs (longward of MIPS ) of these two groups, they found that the disk is on average flatter in the lower stellar mass group than in the group with higher stellar masses. Based on Spitzer data, several other works hinted at similar results (Riaz et al., 2012, e.g.,). As laid out in Sect. 5.2, our results derived by including the Herschel far-IR observations evince the same tendency. Note that this is a statistical behaviour shown from the ensemble of the 46 modeled very low-mass stars and BDs.

As a further step towards examining whether the trends of disk properties extend to the low-end of the substellar mass regime, we performed a detailed comparison of the fitted disk geometry parameters between the ETBD and LTBD groups as introduced in Sect. 2. The results are displayed in Figure 4, in which the upper panel shows a clear decrease of disk flaring from early to late type BDs, with a typical dispersion of the order of . The histogram inside the figure confirms the relationship between the flaring index and SpT. In particular, the median value of is 1.10 in the LTBD group, while the ETBD group features a higher median value of 1.175. The mean value of is also found to be smaller in the LTBD group, i.e., , as compared to for the ETBD group. The difference in the median/mean disk flaring between the two groups is , which is about three times of the step size for this dimension used to build the model grid. The lower of cooler BDs suggests that disk flaring is very sensitive to far-IR photometry, because the LTBD group is generally fainter at , see Sect. 3.3. OTS 44, an M9.5 BD with an estimated mass of in the Cha I star-forming region (Bonnefoy et al., 2014), is an obvious outlier of the observed relation, see the blue square in the upper panel of Figure 4. The significant IR excess together with a rising SED from 24 to require a highly flared disk to reproduce the data (Joergens et al., 2013; Joergens et al., 2015, this work). We note that our re-measurement of the Herschel/PACS flux densities of OTS 44 leads to a slightly smaller disk mass of (; Joergens et al., 2015, this work) compared to a previous estimate (Joergens et al., 2013, ;) based on the photometry given by Harvey et al. (2012a). VLT/SINFONI spectra revealed active mass accretion for this extremely low-mass object (Joergens et al., 2013), suggesting that OTS 44’s disk is probably at its early stage of evolution, during which dust settling (a key role of reducing ) has not yet proceeded very far. The observed dependency is unlikely a bias of the mixed ages and evolutionary stages of the sample, since both the young (, blue points) and old (, red points) subgroups display the same tendency, see Figure 4.
As shown in the lower panel of Figure 4, there is no clear trend visible in the distribution of scale height. The median or mean values of are close to each other for both the ETBD and LTBD groups, i.e., . This means that the independency of on SpT is also found in the low-mass substellar regime. The disk scale height varies like if the hydrostatic equilibrium between the dust and gas phases is assumed, where is the density weighted mean dust temperature. Andrews et al. (2013) found that scales with the host stellar luminosity basically according to . The stellar luminosities in their sample that covers the substellar regime. This suggests that the correlation between the scale height and may be intrinsically not tight. The scaling between the scale height and highly depends on the detailed coupling (i.e., dust settling) between the gas and small dust grains, which is quite complicated and has to be investigated with future high-resolution (sub-)millimeter observations (Sauter et al., 2009; Boehler et al., 2013, e.g.,).

The median disk masses for both the ETBD and LTBD groups are , a value essentially consistent with the one given by Harvey et al. (2012a). As shown in Figure 5, we did not find an obvious correlation between the disk mass and SpT (as a proxy for the mass of the central object) in the BD mass regime, which seems to deviate from the speculation from the tight correlation between the PACS 70 flux density and SpT shown by Liu et al. (2015). This is probably due to one or more of the following reasons: (1) the constraints on the disk mass are mostly from the 70 photometry in our study. However, only (i.e., 11/21) of the modeled LTBD objects are detected at , whereas the detection rate is (i.e., 22/25) for the ETBD group, see Table 1. The (most probable) disk masses of the undetected sources are quite uncertain, potentially preventing the underlying correlation, if present, from showing up. (2) The conversion from PACS 70 flux density to disk mass is not straightforward. On one hand the target disks are not completely optically thin at PACS wavelengths (Harvey et al., 2012a), and on the other hand 70 is not in the clear Rayleigh-Jeans tail of the SED. (3) Our correlation analysis is based on a sample of targets that span a wide range of ages. Therefore, the targets are probably at different evolutionary stages, which may weaken any relation between the (sub)stellar and disk masses. Beside the issue of incompleteness of our sample selection in each cloud, the detection bias can also affect the correlation because more distant clouds have a worse sensitivity to disk mass compared to closer siblings.

In order to further investigate the relation in the substellar mass regime, we compile the median SEDs of Taurus sources with SpTs lying in the same range defined in our sample selection. Our compilation is entirely based on the catalog as reported by Bulger et al. (2014). We only consider sources that have flux density measurements including upper limits available at all the 2MASS J/H/K bands, four IRAC and WISE bands, MIPS , and PACS 70 and . With this criterion, there are in total 32 targets entering in the analysis. 25 sources are ETBDs, whereas 7 targets are LTBDs. The Kaplan-Meier product-limit estimator is used to properly account for upper limits, if encountered, in the estimation of median flux density. All the PACS flux densities are taken from Bulger et al. (2014) for homogeneity, although we re-performed photometry for some Taurus targets. The median SEDs of Taurus ETBDs and LTBDs are shown as blue dots in Figure 6. An important result is that the median of Taurus ETBD group is at least twelve times larger than that of the Taurus LTBDs, i.e., . The difference in flux density between early- and late-type targets becomes significantly larger in coeval planet-forming disks as compared to the result from our sample of objects with different ages, see Sect. 3.3. We fit the median SEDs by using the disk and dust models as described in Sect. 4.2. As we discussed above, the disk scale height is independent on SpT. Hence, we fixed to 14 AU, i.e., the aforementioned median value of of our sample. The disk inclination was set to because SED modeling cannot provide tight constraints on this parameter. These assumptions were made in order to further reduce the model degeneracy, and therefore to focus on the parameter study between , and SpT. Figure 6 shows the fitting results and 2D contour plots of the function projected over and . The flaring index is not well constrained in Taurus LTBD group, with probable values extending to a lower level than the case for Taurus ETBDs. This may be an indicator that disks around lower mass objects are indeed less flared in general. The best fit value together with the confidence intervals clearly indicate that Taurus ETBDs are very likely more massive than Taurus LTBDs, which appears discrepant with the theoretical predictions of disk fragmentation models (Stamatellos & Herczeg, 2015). However, further efforts are highly desired to clarify this issue given the fact that the disk mass presented here is roughly estimated with far-IR data. With its unprecedented performance, ALMA can observe very faint disks at longer wavelength and provide robust measurement of disk mass (Ricci et al., 2014, e.g.,), so as to testify whether the BD disks obey the same scaling law to the corresponding relations established for higher mass stars.
6 Summary
We re-processed the Herschel/PACS data and measured the 70 and flux density for a sample of 55 BDs and very low mass stars with SpT ranging from M5.5 to L0. Supplemented with previous observations at shorter and (sub-)millimeter wavelengths, we constructed their broadband SEDs with extended wavelength coverage, providing a valuable opportunity to characterize the disk properties in the substellar mass regime. We divided our sample into two groups, i.e. an ETBD and LTBD group that consists of targets with SpT earlier or later than M8. We found significant difference in the cumulative distributions of the flux densities between these two groups. In particular, the ETBD group features a median flux density at 100 pc that is at least three times higher than that of the other group. We studied the dependence of disk properties on the SpT (as a proxy for the mass) of the central object down to the low-mass BD regime and even entering the planetary regime. This knowledge is important for us to understand the formation mechanism of BDs and to improve the planet formation models. Unlike previous studies, our analysis is homogeneous all the way from Herschel/PACS data reduction and flux density measurement to SED modeling within the substellar regime.
For the 46 objects that show IR excess above the photospheric emission, we performed detailed SED analysis using self-consistent radiative transfer models. We introduced as few free parameters as possible in the fitting procedure in order to reduce the model degeneracy. The statistics based on the entire sample shows that the disk flaring of BDs and very low mass stars is indeed smaller than that of their higher mass counterparts like T Tauri disks, the disk mass is orders of magnitude lower than the typical value found in T Tauri stars, and the scale height is independent on the mass of the central object. Moreover, we systematically compared the modeling results from Bayesian analysis between the ETBD and LTBD groups and found similar trends of flaring index as a function of SpT. The disk scale heights are comparable in both the high-mass and very low-mass BDs. Both groups feature a similar median disk mass and no clear trend is visible in the distribution, probably due to the uncertainty in translating the PACS photometry into disk mass, the detection bias, and the difference in evolutionary stage among the targets. Future deeper far-IR surveys and ALMA observations are required to improve constraints on the underlying morphology of the relationship between the stellar and disk properties in the low-end stellar mass regime.
Acknowledgements.
We acknowlegde helpful discussions about Herschel/PACS observations with Ulrich Klaas and Hendrik Linz. Y.L. acknowledges the support by the Natural Science Foundation of Jiangsu Province (Grant No. BK20141046). This work is supported by the Strategic Priority Research Program “The Emergence of Cosmological Structures” of the Chinese Academy of Sciences, Grant No. XDB09000000. A.B. acknowledges financial support from the Proyecto Fondecyt de Iniciación 11140572. M.N. is funded by the Deutsches Zentrum für Luft- und Raumfahrt (DLR). This publication makes use of data products from the Wide-field Infrared Survey Explorer, which is a joint project of the University of California, Los Angeles, and the Jet Propulsion Laboratory/California Institute of Technology, funded by the National Aeronautics and Space Administration. PACS has been developed by a consortium of institutes led by MPE (Germany) and including UVIE (Austria); KU Leuven, CSL, IMEC (Belgium); CEA, LAM (France); MPIA (Germany); INAF- IFSI/OAA/OAP/OAT, LENS, SISSA (Italy); IAC (Spain).References
- Ahn et al. (2012) Ahn, C. P., Alexandroff, R., Allende Prieto, C., et al. 2012, ApJS, 203, 21
- Allard et al. (2012) Allard, F., Homeier, D., Freytag, B., & Sharp, C. M. 2012, in EAS Publications Series, Vol. 57, EAS Publications Series, ed. C. Reylé, C. Charbonnel, & M. Schultheis, 3–43
- Allen et al. (2007) Allen, P. R., Luhman, K. L., Myers, P. C., et al. 2007, ApJ, 655, 1095
- Alves de Oliveira et al. (2013) Alves de Oliveira, C., Ábrahám, P., Marton, G., et al. 2013, A&A, 559, A126
- Alves de Oliveira et al. (2010) Alves de Oliveira, C., Moraux, E., Bouvier, J., et al. 2010, A&A, 515, A75
- André et al. (2010) André, P., Men’shchikov, A., Bontemps, S., et al. 2010, A&A, 518, L102
- Andrews et al. (2013) Andrews, S. M., Rosenfeld, K. A., Kraus, A. L., & Wilner, D. J. 2013, ApJ, 771, 129
- Andrews & Williams (2007) Andrews, S. M. & Williams, J. P. 2007, ApJ, 671, 1800
- Andrews et al. (2011) Andrews, S. M., Wilner, D. J., Espaillat, C., et al. 2011, ApJ, 732, 42
- Apai et al. (2005) Apai, D., Pascucci, I., Bouwman, J., et al. 2005, Science, 310, 834
- Ardila et al. (2000) Ardila, D., Martín, E., & Basri, G. 2000, AJ, 120, 479
- Artymowicz & Lubow (1994) Artymowicz, P. & Lubow, S. H. 1994, ApJ, 421, 651
- Audard et al. (2014) Audard, M., Ábrahám, P., Dunham, M. M., et al. 2014, ArXiv e-prints
- Balog et al. (2014) Balog, Z., Müller, T., Nielbock, M., et al. 2014, Experimental Astronomy, 37, 129
- Baraffe et al. (2003) Baraffe, I., Chabrier, G., Barman, T. S., Allard, F., & Hauschildt, P. H. 2003, A&A, 402, 701
- Barrado Y Navascués (2006) Barrado Y Navascués, D. 2006, A&A, 459, 511
- Bate et al. (2003) Bate, M. R., Bonnell, I. A., & Bromm, V. 2003, MNRAS, 339, 577
- Bayo et al. (2012) Bayo, A., Barrado, D., Huélamo, N., et al. 2012, A&A, 547, A80
- Bayo et al. (2014) Bayo, A., Rodrigo, C., Barrado, D., et al. 2014, in Astronomical Society of India Conference Series, Vol. 11, Astronomical Society of India Conference Series, 93–101
- Bayo et al. (2008) Bayo, A., Rodrigo, C., Barrado Y Navascués, D., et al. 2008, A&A, 492, 277
- Boehler et al. (2013) Boehler, Y., Dutrey, A., Guilloteau, S., & Piétu, V. 2013, MNRAS, 431, 1573
- Bonnefoy et al. (2014) Bonnefoy, M., Chauvin, G., Lagrange, A.-M., et al. 2014, A&A, 562, A127
- Bouwman et al. (2008) Bouwman, J., Henning, T., Hillenbrand, L. A., et al. 2008, ApJ, 683, 479
- Bouy et al. (2008) Bouy, H., Huélamo, N., Pinte, C., et al. 2008, A&A, 486, 877
- Bouy et al. (2006) Bouy, H., Martín, E. L., Brandner, W., et al. 2006, A&A, 451, 177
- Briceño et al. (2002) Briceño, C., Luhman, K. L., Hartmann, L., Stauffer, J. R., & Kirkpatrick, J. D. 2002, ApJ, 580, 317
- Broekhoven-Fiene et al. (2014) Broekhoven-Fiene, H., Matthews, B., Duchêne, G., et al. 2014, ApJ, 789, 155
- Bulger et al. (2014) Bulger, J., Patience, J., Ward-Duong, K., et al. 2014, A&A, 570, A29
- Cambresy et al. (1997) Cambresy, L., Epchtein, N., Copet, E., et al. 1997, A&A, 324, L5
- Canty et al. (2013) Canty, J. I., Lucas, P. W., Roche, P. F., & Pinfield, D. J. 2013, MNRAS, 435, 2650
- Carpenter et al. (2006) Carpenter, J. M., Mamajek, E. E., Hillenbrand, L. A., & Meyer, M. R. 2006, ApJ, 651, L49
- Carpenter et al. (2014) Carpenter, J. M., Ricci, L., & Isella, A. 2014, ApJ, 787, 42
- Chabrier et al. (2014) Chabrier, G., Johansen, A., Janson, M., & Rafikov, R. 2014, ArXiv e-prints
- Chauvin et al. (2004) Chauvin, G., Lagrange, A.-M., Dumas, C., et al. 2004, A&A, 425, L29
- Chiang & Goldreich (1997) Chiang, E. I. & Goldreich, P. 1997, ApJ, 490, 368
- Chiang & Goldreich (1999) Chiang, E. I. & Goldreich, P. 1999, ApJ, 519, 279
- Comerón et al. (2009) Comerón, F., Spezzi, L., & López Martí, B. 2009, A&A, 500, 1045
- Cutri et al. (2003) Cutri, R. M., Skrutskie, M. F., van Dyk, S., et al. 2003, VizieR Online Data Catalog, 2246, 0
- Cutri et al. (2012) Cutri et al., R. M. 2012, VizieR Online Data Catalog, 2311, 0
- D’Alessio et al. (2006) D’Alessio, P., Calvet, N., Hartmann, L., Franco-Hernández, R., & Servín, H. 2006, ApJ, 638, 314
- Damjanov et al. (2007) Damjanov, I., Jayawardhana, R., Scholz, A., et al. 2007, ApJ, 670, 1337
- DENIS Consortium (2005) DENIS Consortium. 2005, VizieR Online Data Catalog, 2263, 0
- Dorschner et al. (1995) Dorschner, J., Begemann, B., Henning, T., Jaeger, C., & Mutschke, H. 1995, A&A, 300, 503
- Ducourant et al. (2014) Ducourant, C., Teixeira, R., Galli, P. A. B., et al. 2014, A&A, 563, A121
- Dullemond et al. (2001) Dullemond, C. P., Dominik, C., & Natta, A. 2001, ApJ, 560, 957
- Feigelson & Nelson (1985) Feigelson, E. D. & Nelson, P. I. 1985, ApJ, 293, 192
- Frank et al. (2014) Frank, A., Ray, T. P., Cabrit, S., et al. 2014, ArXiv e-prints
- Fruchter & Hook (2002) Fruchter, A. S. & Hook, R. N. 2002, PASP, 114, 144
- Furlan et al. (2006) Furlan, E., Hartmann, L., Calvet, N., et al. 2006, ApJS, 165, 568
- Furlan et al. (2009) Furlan, E., Watson, D. M., McClure, M. K., et al. 2009, ApJ, 703, 1964
- Garufi et al. (2014) Garufi, A., Podio, L., Kamp, I., et al. 2014, A&A, 567, A141
- Gizis (2002) Gizis, J. E. 2002, ApJ, 575, 484
- Gräfe et al. (2013) Gräfe, C., Wolf, S., Guilloteau, S., et al. 2013, A&A, 553, A69
- Guieu et al. (2007) Guieu, S., Pinte, C., Monin, J.-L., et al. 2007, A&A, 465, 855
- Guilloteau et al. (2011) Guilloteau, S., Dutrey, A., Piétu, V., & Boehler, Y. 2011, A&A, 529, A105
- Gully-Santiago et al. (2011) Gully-Santiago, M. A., Allers, K. N., & Jaffe, D. T. 2011, in Astronomical Society of the Pacific Conference Series, Vol. 448, 16th Cambridge Workshop on Cool Stars, Stellar Systems, and the Sun, ed. C. Johns-Krull, M. K. Browning, & A. A. West, 633
- Harvey et al. (2012a) Harvey, P. M., Henning, T., Liu, Y., et al. 2012a, ApJ, 755, 67
- Harvey et al. (2014) Harvey, P. M., Henning, T., Liu, Y., & Wolf, S. 2014, ApJ, 795, 21
- Harvey et al. (2012b) Harvey, P. M., Henning, T., Ménard, F., et al. 2012b, ApJ, 744, L1
- Herczeg et al. (2009) Herczeg, G. J., Cruz, K. L., & Hillenbrand, L. A. 2009, ApJ, 696, 1589
- Isella et al. (2009) Isella, A., Carpenter, J. M., & Sargent, A. I. 2009, ApJ, 701, 260
- Jäger et al. (1994) Jäger, C., Mutschke, H., Begemann, B., Dorschner, J., & Henning, T. 1994, A&A, 292, 641
- Jäger et al. (1998) Jäger, C., Mutschke, H., & Henning, T. 1998, A&A, 332, 291
- Joergens et al. (2015) Joergens, V., Bonnefoy, M., Liu, Y., Bayo, A., & Wolf, S. 2015, in Cambridge Workshop on Cool Stars, Stellar Systems, and the Sun, Vol. 18, 18th Cambridge Workshop on Cool Stars, Stellar Systems, and the Sun, ed. G. T. van Belle & H. C. Harris, 1019–1026
- Joergens et al. (2013) Joergens, V., Bonnefoy, M., Liu, Y., et al. 2013, A&A, 558, L7
- Joergens et al. (2012) Joergens, V., Pohl, A., Sicilia-Aguilar, A., & Henning, T. 2012, A&A, 543, A151
- Kainulainen et al. (2009) Kainulainen, J., Beuther, H., Henning, T., & Plume, R. 2009, A&A, 508, L35
- Kirchschlager & Wolf (2014) Kirchschlager, F. & Wolf, S. 2014, A&A, 568, A103
- Klein et al. (2003) Klein, R., Apai, D., Pascucci, I., Henning, T., & Waters, L. B. F. M. 2003, ApJ, 593, L57
- Lee et al. (2011) Lee, N., Williams, J. P., & Cieza, L. A. 2011, ApJ, 736, 135
- Liu et al. (2003) Liu, M. C., Najita, J., & Tokunaga, A. T. 2003, ApJ, 585, 372
- Liu et al. (2015) Liu, Y., Herczeg, G. J., Gong, M., et al. 2015, A&A, 573, A63
- Liu et al. (2012) Liu, Y., Madlener, D., Wolf, S., Wang, H., & Ruge, J. P. 2012, A&A, 546, A7
- Liu et al. (2013) Liu, Y., Madlener, D., Wolf, S., & Wang, H.-C. 2013, Research in Astronomy and Astrophysics, 13, 420
- Luhman (2004) Luhman, K. L. 2004, ApJ, 602, 816
- Luhman (2006) Luhman, K. L. 2006, ApJ, 645, 676
- Luhman (2007) Luhman, K. L. 2007, ApJS, 173, 104
- Luhman et al. (2005a) Luhman, K. L., Adame, L., D’Alessio, P., et al. 2005a, ApJ, 635, L93
- Luhman et al. (2008) Luhman, K. L., Allen, L. E., Allen, P. R., et al. 2008, ApJ, 675, 1375
- Luhman et al. (2005b) Luhman, K. L., D’Alessio, P., Calvet, N., et al. 2005b, ApJ, 620, L51
- Luhman et al. (2009) Luhman, K. L., Mamajek, E. E., Allen, P. R., & Cruz, K. L. 2009, ApJ, 703, 399
- Luhman et al. (2004) Luhman, K. L., Peterson, D. E., & Megeath, S. T. 2004, ApJ, 617, 565
- Luhman et al. (2006) Luhman, K. L., Whitney, B. A., Meade, M. R., et al. 2006, ApJ, 647, 1180
- Madlener et al. (2012) Madlener, D., Wolf, S., Dutrey, A., & Guilloteau, S. 2012, A&A, 543, A81
- Martín et al. (2004) Martín, E. L., Delfosse, X., & Guieu, S. 2004, AJ, 127, 449
- Mathews et al. (2013) Mathews, G. S., Pinte, C., Duchêne, G., Williams, J. P., & Ménard, F. 2013, A&A, 558, A66
- McClure et al. (2010) McClure, M. K., Furlan, E., Manoj, P., et al. 2010, ApJS, 188, 75
- Mohanty et al. (2013) Mohanty, S., Greaves, J., Mortlock, D., et al. 2013, ApJ, 773, 168
- Mohanty et al. (2005) Mohanty, S., Jayawardhana, R., & Basri, G. 2005, ApJ, 626, 498
- Muzerolle et al. (2005) Muzerolle, J., Luhman, K. L., Briceño, C., Hartmann, L., & Calvet, N. 2005, ApJ, 625, 906
- Olofsson et al. (2010) Olofsson, J., Augereau, J.-C., van Dishoeck, E. F., et al. 2010, A&A, 520, A39
- Olofsson et al. (2013) Olofsson, J., Szűcs, L., Henning, T., et al. 2013, A&A, 560, A100
- Papaloizou & Pringle (1977) Papaloizou, J. & Pringle, J. E. 1977, MNRAS, 181, 441
- Pascucci et al. (2009) Pascucci, I., Apai, D., Luhman, K., et al. 2009, ApJ, 696, 143
- Pascucci et al. (2013) Pascucci, I., Herczeg, G., Carr, J. S., & Bruderer, S. 2013, ApJ, 779, 178
- Pecaut et al. (2012) Pecaut, M. J., Mamajek, E. E., & Bubar, E. J. 2012, ApJ, 746, 154
- Phan-Bao et al. (2008) Phan-Bao, N., Riaz, B., Lee, C.-F., et al. 2008, ApJ, 689, L141
- Pinte et al. (2008) Pinte, C., Padgett, D. L., Ménard, F., et al. 2008, A&A, 489, 633
- Poglitsch et al. (2010) Poglitsch, A., Waelkens, C., Geis, N., et al. 2010, A&A, 518, L2
- Reipurth (2008a) Reipurth, B. 2008a, Handbook of Star Forming Regions, Volume I: The Northern Sky
- Reipurth (2008b) Reipurth, B. 2008b, Handbook of Star Forming Regions, Volume II: The Southern Sky
- Reipurth & Clarke (2001) Reipurth, B. & Clarke, C. 2001, AJ, 122, 432
- Riaz (2009) Riaz, B. 2009, ApJ, 701, 571
- Riaz & Gizis (2008) Riaz, B. & Gizis, J. E. 2008, ApJ, 681, 1584
- Riaz & Gizis (2012) Riaz, B. & Gizis, J. E. 2012, A&A, 548, A54
- Riaz et al. (2012) Riaz, B., Honda, M., Campins, H., et al. 2012, MNRAS, 420, 2603
- Ribas et al. (2015) Ribas, Á., Bouy, H., & Merín, B. 2015, ArXiv e-prints
- Ricci et al. (2013) Ricci, L., Isella, A., Carpenter, J. M., & Testi, L. 2013, ApJ, 764, L27
- Ricci et al. (2012) Ricci, L., Testi, L., Natta, A., Scholz, A., & de Gregorio-Monsalvo, I. 2012, ApJ, 761, L20
- Ricci et al. (2014) Ricci, L., Testi, L., Natta, A., et al. 2014, ApJ, 791, 20
- Rigliaco et al. (2011) Rigliaco, E., Natta, A., Randich, S., et al. 2011, A&A, 526, L6
- Rigliaco et al. (2012) Rigliaco, E., Natta, A., Testi, L., et al. 2012, A&A, 548, A56
- Robitaille et al. (2007) Robitaille, T. P., Whitney, B. A., Indebetouw, R., & Wood, K. 2007, ApJS, 169, 328
- Sauter et al. (2009) Sauter, J., Wolf, S., Launhardt, R., et al. 2009, A&A, 505, 1167
- Savage & Oliver (2007) Savage, R. S. & Oliver, S. 2007, ApJ, 661, 1339
- Scholz et al. (2006) Scholz, A., Jayawardhana, R., & Wood, K. 2006, ApJ, 645, 1498
- Scholz et al. (2007) Scholz, A., Jayawardhana, R., Wood, K., et al. 2007, ApJ, 660, 1517
- Scholz et al. (2005) Scholz, R.-D., McCaughrean, M. J., Zinnecker, H., & Lodieu, N. 2005, A&A, 430, L49
- Sherry et al. (2004) Sherry, W. H., Walter, F. M., & Wolk, S. J. 2004, AJ, 128, 2316
- Sicilia-Aguilar et al. (2011) Sicilia-Aguilar, A., Henning, T., Dullemond, C. P., et al. 2011, ApJ, 742, 39
- Slesnick et al. (2006) Slesnick, C. L., Carpenter, J. M., Hillenbrand, L. A., & Mamajek, E. E. 2006, AJ, 132, 2665
- Spezzi et al. (2008) Spezzi, L., Alcalá, J. M., Covino, E., et al. 2008, ApJ, 680, 1295
- Spezzi et al. (2013) Spezzi, L., Cox, N. L. J., Prusti, T., et al. 2013, A&A, 555, A71
- Stamatellos & Herczeg (2015) Stamatellos, D. & Herczeg, G. J. 2015, MNRAS, 449, 3432
- Stamatellos & Whitworth (2011) Stamatellos, D. & Whitworth, A. 2011, in IAU Symposium, Vol. 270, Computational Star Formation, ed. J. Alves, B. G. Elmegreen, J. M. Girart, & V. Trimble, 223–226
- Szűcs et al. (2010) Szűcs, L., Apai, D., Pascucci, I., & Dullemond, C. P. 2010, ApJ, 720, 1668
- Todorov et al. (2014) Todorov, K. O., Luhman, K. L., Konopacky, Q. M., et al. 2014, ApJ, 788, 40
- Walker et al. (2004) Walker, C., Wood, K., Lada, C. J., et al. 2004, MNRAS, 351, 607
- Wilking et al. (1999) Wilking, B. A., Greene, T. P., & Meyer, M. R. 1999, AJ, 117, 469
- Wilking et al. (2005) Wilking, B. A., Meyer, M. R., Robinson, J. G., & Greene, T. P. 2005, AJ, 130, 1733
- Williams & Cieza (2011) Williams, J. P. & Cieza, L. A. 2011, ARA&A, 49, 67
- Wolf (2003) Wolf, S. 2003, Computer Physics Communications, 150, 99
- Wolf et al. (2003) Wolf, S., Padgett, D. L., & Stapelfeldt, K. R. 2003, ApJ, 588, 373
Appendix A The Bayesian probability distributions of selected disk parameters for each modeled object


