Perturbation analysis on large band gap bowing of dilute nitride semiconductors
Abstract
Contrary to the conventional empirical law, band gap of dilute nitride semiconductors decreases with nitrogen concentration. In spite of a number of investigations, origin of this “large band gap bowing”, is still under debate. In order to elucidate this phenomenon, we investigate change of band edge energies of GaNxAs1-x due to nitrogen by using the perturbation theory. It is found that energy shift of conduction band edge is arising from mixing between - and L-states and/or - and X-states induced by displacement of Ga atoms around N. We also found that the valence band edge state shows upward shift in spite of negative potential of nitrogen. These results are well understood from character of the wavefunctions and symmetry of the perturbation potential.
I Introduction
III-V compound semiconductors containing small amount of nitrogen atoms are attracting much attention.[1, 2, 3, 4, 5, 6, 7] Extensive studies have been carried out since these materials are promising candidate for novel optical devices such as infrared lasers and high efficiency solar cells.[8, 9, 10] In addition to the prospect for device applications, their properties which are largely different from other semiconductors, also evoke much interest.[11, 12, 13] In particular, large band gap bowing is a problem still under debate. Usually, band gap of a mixed compound is well described as a linear interpolation of band gaps of the constituent materials. Deviation from this empirical law, which is called band gap bowing, is sometimes observed but not so large. However, contrary to the empirical law, band gap of some compounds such as GaNAs,GaInNAs and GaNP containing small amount of N becomes smaller with the N concentration. There have been various models and theories to explain this phenomenon.[14, 15, 16] Analysis on the basis of tight-binding theory[17, 18], empirical pseudopotential method [20, 21, 22, 23] and first principle calculations[24, 25] have been carried out. However, its mechanism has not been clarified, yet.
In this paper, to elucidate the mechanism of the large band gap bowing, we carry out analysis on behavior of the band edges for a typical dilute nitride semiconductor GaNxAs1-x (GaNAs). For this purpose, we carry out perturbation calculations regarding effects due to nitrogen as the perturbation along with bulk GaAs wavefunctions as bases.
In the next section, first, we show the model used in this study. After evaluating matrix elements of the perturbation potential, reduction of band gap is calculated. Then, by making qualitative interpretation in terms of symmetry of the perturbation potential and character of the wavefunctions, we show how the reduction of band gap due to nitrogen occurs.
II Perturbation analysis
II.1 Model
We consider an supercell of GaAs in which one of As atoms is replaced by a N atom. Note that this supercell consists of unit cells of the zinc blende structure, that is, nitrogen concentration is given by . Introduction of the N atom gives rise to change in crystalline potential. We consider following three factors: (i) shift of atomic potential from that of As to N, (ii) displacement of Ga atoms adjacent to the N atom, and (iii) displacement of As atoms on the second neighboring sites to the N atom. Then, the perturbation potential is given by
| (1) |
with
| (2a) | ||||
| (2b) | ||||
| and | ||||
| (2c) | ||||
where the superscripts (i)-(iii) correspond to the three factors noted above. That is, denotes the potential shift from that of As to N, and and stem from displacement of atoms adjacent to the nitrogen. In these equations, , , and are atomic potentials of N, As, and Ga, respectively. For the atomic potentials, we used empirical pseudopotentials presented in Refs. [20, 21] The vector indicates location of a zinc blende unit cell, and ( is the lattice constant) is a vector that indicates position of a Ga atom within a unti cell. Displacement of atoms adjacent to the nitrogen are written as and for the first neighboring Ga and the second neighboring As, respectively. The indices and run through so that and indicate the positions of the first neighboring four Ga atoms and the second neighboring twelve As atoms, respectively. We set so that the Ga atoms approach toward the N atom by 0.38 Å. Similarly, was determined so that the second neighboring As atoms approach toward the N by 0.1 Å. These values were obtained from total energies evaluated by the first principle calculations using the CASTEP package.[26]

II.2 Perturbation matrices and band gap reduction
In Figure 1, we show energy band of GaAs calculated using the empirical pseudopotentials along with plane wave basis functions. Using the wavefunctions of bulk GaAs obtained so far, we calculate a matrix element defined by
| (3) |
where is a wavefunction of bulk GaAs with a wavevector . The index denotes the band as shown in Fig. 1 where the highest valence band and the lowest conduction band are labeled and , respectively.
In the inset of Fig. 1, we show -states that are connected with each other by the perturbation potential plotted on the first Brillouin zone of the zinc blende structure for the case of . These -states discretely distribute as
| (4) |
with , and integers between and . This can be proven as follows: Since the perturbation potential has translational symmetry with a period in all the -, -, and -directions, the matrix element must be fixed when is replaced by with a lattice vector of the supercell . From this and the Bloch’s theorem, the wavevectors and in eq. (3) must satisfy a relation . In the present case, since is , is given by eq. (4). Note that some points on the border are equivalent. For example, and are identical. Hence, one of them must be excluded to avoid double counting, though both are plotted in the figure. Excluding such equivalent points, we have -points in the first Brillouin zone to be mixed due to the perturbation potential; there are 256 points for and 2048 points for required for the calculations. These -points are the points that are folded onto the -point of the Brillouin zone of the supercell.


In the upper panel of Fig. 2, we show , i.e., matrix elements between the conduction band edge state (-state of the 5th band) and various states. Note that matrix elements are basicall negative quantities reflecting deep nitrogen potential, though we plot absolute values since they are complex quantities. The solid- and dotted- curves show the values for the bands and , respectively, plotted as functions of along the L--X symmetric line of the zinc blende Brillouin zone. The dots on the horizontal axis show the -states that are relevant to the perturbation calculations, as we have shown in Fig. 1.
In the lower panel, we plot the quantity by the solid- and dotted- curves for the band and , respectively. Within the viewpoint of the perturbation theory, magnitude of this quantity corresponds to energy change due to the perturbation. These curves show that contribution from states around the X- and L-points of the lowest conduction band is much larger than that from other states. As shown in the upper panel, the matrix elements for the 5th and 6th bands have large values in a wide area of the Brillouin zone. However, except for the X- and L-states of the 5th band, large energy separation reduces this quantity.
To examine further the character of the matrix elements for the lowest conduction band , we show contributions from the factors (i)–(iii) described in the previous section in Fig. 3. In this figure, the curves labeled (i)-(iii) show components of the matrix elements due to the factors (i)-(iii), respectively. Note that, since absolute values of complex quantities are plotted, a summation of these components does not make the total value. Around the -point, the factor (i) the N potential takes the largest value of the three. Whereas near the X-point, the factor (ii) displacement of Ga atoms is the largest. At the L-point, the factors (i) and (ii) are comparable though the latter is slightly larger. Contribution from the factor (iii) displacement of second neighboring As atoms is smaller than others in all the region. As we have shown in Fig. 2, contributions from the X- and L-states are much larger than that from other state. This means that the effect due to the displacement of adjacent Ga atom is larger than that due to nitrogen potential. We will discuss this point later in terms of symmetry of wavefunctions.
In Fig. 4, we plot the perturbation matrix elements for the valence states. Similar to Fig. 2, and are plotted in the upper and lower panels, respectively. We note that the degeneracy of the valence states causes a complex situation because any linear combinations between the degenerated states satisfy the Schrödinger equation. This gives rise to ambiguity of numerical values. To avoid such a situation, we made linear combinations between the degenerated states so that the states become proper bases of the irreducible representation of the group they belong. In other words, we set the states to have proper symmetry. In the calculations, we set to have -symmetry. Similarly, we set , and to have -, -, and -symmetry, respectively, in drawing Fig. 4.
Different from the conduction states, contribution from states in vicinity of the -point is large. Thus, the quantity could be very large when is close to the -point. This is because of small denominator arising from heavy mass of the hole states. However, the states in vicinity of the are irrelevant to the energy change unless N concentration is very low. As indicated on the horizontal axis for the case of , the states that are relevant to energy change distribute discretely. Therefore, the states close to the do not affect the energy shift of the band edge state. When nitrogen concentration is very low, we have to take these states into account because when is large the -states denoted by the dots become denser. However, in this case, as we denote below, the factor added to take nitrogen concentration into account reduces the contribution from the states close to the .

Using the perturbation matrix elements, we evaluate energy shift of band edges. For the conduction band edge, the simple perturbation expansion series converges slowly. This is because, as shown in Fig. 2, contribution from the X- and L-states is larger than that from the -state. This means that higher order terms is larger than the first order term of the perturbation series. Therefore, we evaluated the band edge energy by diagonalizing the Hamiltonian matrix given by
| (5) |
We fixed as because interband effect is negligible as we have shown in Fig. 2. The factor is necessary to treat N concentration properly. As we have noted, since the supercell contains of zinc blende unit cells, the N concentration is given by .
For the valence band edge, we evaluated energy shift using the secnond order formula
| (6) |
As we have seen in Fig. 4, perturbation matrix elements for the valence states are not so large as those for the conduction states. As a result, the second order formula yields reasonable results close to the value obtained by diagonalizing perturbation matrix.
In Fig. 5, we plot calculated band gap by filled circles as a function of nitrogen concentration. The crosses denote results of first principle calculation extracted from Fig. 6 of Ref.[6]. Reasonable agreement between results of present theory and the first principle calculation indicates that the perturbation analysis is valid for dilute nitrides as long as N concentration is smaller than 1 %. In the inset, we show energy shift of the conduction band edge and valence band edge by filled and open circles, respectively. In addition to the lowering of the conduction band edge, upward shift of the valence band edge state is observed. This seems peculiar since the perturbation potential due to nitrogen is negative.

II.3 Character of wavefunctions and matrix elements
In Fig. 6, we show wavefunctions of GaAs at some symmetry points. From the top to bottom, wavefunctions at the -, X-, and L- points of the lowest conduction band and the wavefunction of the valence band edge are plotted along the direction. The As atom locates at the position , and a Ga atom without displacement locates at as indicated by open and shaded circle, respectively. For each curve, we also attached schematic illustration to show character of the wavefunction, where local wavefunctions of As and Ga are plotted by solid- and dotted- curves, respectively. The wavefunction of the state in the conduction band, , has peaks at the atom positions, indicating -like character around an atom. This wavefunction consists of anti-bonding coupling between an -like orbital of As and an -like orbital of Ga. We also see that wavefunction around As is localized whereas that around Ga is somewhat extended. In the similar way, we see that the wavefunction of the X-state, , consists of anti-bonding coupling between an -like orbital of As and a -like orbital of Ga that has a node at the Ga position. The L-state is somewhat complicated. We see that the wavefunction has peaks at the positions deviated from the atom positions. This means that, as schematically shown in the inset, the - and -orbitals are mixed within an atom. The large amplitude in the middle of the atoms indicates that this wavefunction has bonding character. The wavefunction has nodes at the atom position, meaning -like character around an atom. We observe that this wavefunction consists of bonding coupling between -like orbitals of As and Ga.
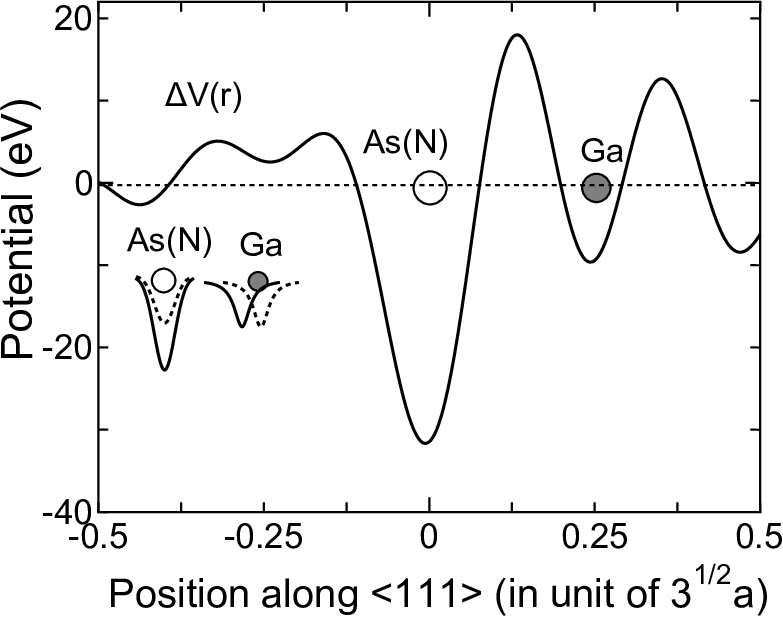
In Fig. 7, we also plot the perturbation potential along the line. For each panel, we added schematic atomic potentials with and without nitrogen by dotted- and solid-curves, respectively, to illustrate schematically how the perturbation potential arises. Since the N potential is deeper than As potential, the perturbation potential at the As (N) site is negative. Due to the spherical character of the pseudopotential, the perturbation potential has approximately spherical -like symmetry. On the other hand, the perturbation potential around Ga, that arises from displacement of Ga atoms, is more complicated. As illustrated in the inset, the displacement of Ga gives rise to potential increase on one side of the Ga position and decrease on another side. Therefore, the perturbation potential is nearly anti-symmetric around the Ga position, that is, -like symmetry along the direction, although the potential curve seems complicated due to complexity of pseudopotential that is not a simple function.
Comparison between the wavefunctions shown in Fig. 5 and the perturbation potential in Fig. 6 enables us to make interpretation for the perturbation matrix elements shown in Fig. 3–5.
First, we see the matrix element at the state of the conduction band, As shown in Fig. 3, contribution of the Nitrogen potential is dominant to this first order term . This is because the wavefunction has large amplitude at the As (N) position. The fact that displacement of Ga has small effect to is well understood; As we have noted, potential around Ga has -like symmetry and wavefunction is of -like symmetry. Therefore integrating , which has an odd-like character around Ga, results in small value of the matrix element.
Different from the -state, the matrix element at the X-state effect from Ga is the largest as we have shown in Fig. 3. This is also understood that the wavefunction of the X-state around the Ga site is of -like symmetry. For the coupling between the - and X-states , shift of Ga atoms is essential. has -like symmetry around the Ga atom, whereas both and have -like symmetry as seen in Fig. 4. Therefore, we foresee that multiplication of these three quantities becomes an even function around Ga, which enlarges the matrix element .
As we have noted, the wavefunction has character intermediate between the - and X- states; has both - and -characters. This is also well corresponding to the result that arises from both the factor (i) and (ii).
We noted that contribution from position shift of the second neighboring As atoms is small. This is also explained from symmetry. Although displacement of As atoms is about 1/3 of that of Ga atoms, contribution might be large because of larger number (i.e., 12) of neighboring As atoms. As we have noted, atom’s position change leads to perturbation potential with -like symmetry. As seen from Fig. 4, both the -state and X-state have -like charge distribution around As atoms. From a simple consideration on symmetry, we see that the perturbation matrix element for shift of As with and or X has a small value. These results indicate that mixing between and X or between and L induced by lattice distortion around N is the main factor of the band gap reduction of GaNAs, rather than the nitrogen potential.
As for the valence state, as shown in Fig. 5, the valence edge state shows upward shift. This is innegligible, since the energy change is as large as 1/3 of that of the conduction state, though the valence state is seldom referred. It seems strange that the valence state shifts upward since the perturbation potential is strongly negative at the N position. As shown in the figure, the valence state has -like symmetry, its amplitude is small at the position where the perturbation potential is negative. The wavefunction has large amplitude at the peripheral where the perturbation is positive. This makes the first order term positive. In addition, the second order term of eq. (6) pushes up the valence top state.
III Conclusion
In order to clarify the mechanism of the large band gap bowing of dilute nitride semiconductors, we carried out analysis based on the perturbation theory. It was found that reduction of the conduction band occurs due to intervalley mixing between the state and the X- and L- states. The intervalley mixing is induced by displacement of Ga atoms around the nitrogen, rather than nitrogen potential itself. This is reasonably understood considering symmetry of wavefunctions. The displacement of Ga causes potential with -like symmetry, which causes strong mixing between the state and X- (L-) state, since the former has -like symmetry and the latter has -like symmetry at the Ga position. We also found innegligible upward shift of the valence top states. Although the upward shift in the negative perturbation potential of nitrogen seems peculiar, this is also understood from the character of the wavefunction.
References
- [1] M. Kondow, K. Uomi and T. Nozue, Jpn. J. Appl. Phys. 33, L1056 (1994).
- [2] M. Weyers, M. Sato and H. Ando, Jpn. J. Appl. Phys. 31, L853 (1992).
- [3] W. G. Bi and C. W. Tu, Appl. Phys. Lett. 70, 1608 (1997).
- [4] C. Skierbiszewski, S .P. Lepkowski, P. Perlin, T. Suski, W. Jantsch, and J. Geisz, Physica E 13 1078 (2002).
- [5] W. Shan, W. Walukiewicz, K. M. Yu, and J. W. Ager III, E. E. Haller, J. F. Geisz, D. J. Friedman, J. M. Olson, and Sarah R. Kurtz, and C. Nauka, Phys. Rev. B 62, 4211 (2000).
- [6] P. H. Tan, X. D. Luo, Z. Y. Xu, Y. Zhang, A. Mascarenhas, H. P. Xin, C. W. Tu, and W. K. Ge, Phys. Rev. B 73, 205205 (2006).
- [7] K. Uesugi, N. Morooka, and I. Suemune, Appl. Phys. Lett. 74, 1254 (1999).
- [8] N. Tansu, J.-Y. Yeh, and L. J. Mawst, J. Phys.: Condensed Matter 16 S3277 (2004).
- [9] N. Tansu and L. J. Mawst, J. Appl. Phys. 97 054311 (2005).
- [10] M. Wiemer, V. Sabnis, and H. Yuen, Proc. SPIE 8108 810804 (2011).
- [11] S. Noguchi, S. Yagi, D. Sato, Y. Hijikata, K. Onabe, S. Kuboya, and H. Yaguchi, IEEE J. Photovoltaics, 3, 1287 (2013).
- [12] K. Sumiya, M. Morifuji, Y. Oshima, and F. Ishikawa, Applied Physics Express 6 041002 (2013).
- [13] T. Fukushima, Y. Hijikata, H. Yaguchi, S. Yoshida, M. Okano, M. Yoshita, H. Akiyama, S. Kuboya, R. Katayama, K. Onabe, Physica E 42, 2529 (2010).
- [14] Chuan-Zhen Zhao, Na-Na Li, Tong Wei, Chun-Xiao Tang, and Ke-Qing Lu, Appl. Phys. Lett. 100, 142112 (2012).
- [15] W. Shan, W. Walukiewicz, J. W. Ager III, E. E. Haller, J. F. Geisz, D. J. Friedman, J. M. Olson, and S. R. Kurtz, Phys. Rev. Lett. 82, 1221 (1999).
- [16] J. Wu, W. Walukiewicz, K. M. Yu, J. W. Ager III, E. E. Haller, Y. G. Hong, H. P. Xin, and C. W. Tu, Phys. Rev. B 65, 241303 (2002).
- [17] A. Lindsay and E. P. O’Reilly, Phys. Rev. Lett. 93 196402 (2004).
- [18] E. P. O’Reilly, A. Lindsay, S. Tomić and M. Kamal-Saadi, Semicond. Sci. Technol. 17 870 (2002).
- [19] W. J. Fan, M. F. Li, and T. C. Chong, J. B. Xia, J. Appl. Phys. 79 188 (1996).
- [20] L. Bellaiche, S.-H. Wei, and A. Zunger, Appl. Phys. Lett. 70 (1997).
- [21] L. Bellaiche, S.-H. Wei, and A. Zunger Phys. Rev. B 54, 17568 (1996).
- [22] Kurt A. Mader and A. Zunger, Phys. Rev. B 50, 17393 (1994).
- [23] P. R. C. Kent and A. Zunger Phys. Rev. B, 64, 115208 (2001)
- [24] V. Timoshevskii, M. Côté, G. Gilbert, and R. Leonelli, S. Turcotte, J.-N. Beaudry, P. Desjardins, S. Larouche, L. Martinu, and R. A. Masut, Phys. Rev. B 74, 165120 (2006).
- [25] C. -K. Tan, J. Zhang, X. -H. Li, G. Liu, B. O. Tayo, and N. Tansu, J. Display Technol., 9, 272L (2013).
- [26] CASTEP Main/Home Page, http://www.castep.org/
- [27] Pre-Olov Lödin, J. Chem. Phys. 19, 1396 (1951).
- [28] G. Burns, Introduction to group theory with applications, Academic Press, INC, New York 1977.
- [29] H. Jones, The theory of Brillouin zones and electronc states in crystals, Second, revised edition, North-Holland, Amsterdam 1977.
- [30] S. Francoeur, M. J. Seong, M. C. Hanna, J. F. Geisz, A. Mascarenhas, H. P. Xin, and C. W. Tu, Phys. Rev. B 68, 075207 (2003).
- [31] A. Lindsay, S. Tomić, and E. P. O’Reilly, Solid State Electron. 47, 443 (2003).
- [32] A. Lindsay and E. P. O’Reilly, Physica B 340-342 434 (2003).
- [33] E. P. O’Reilly, A. Lindsay, S. Fahy, J. Phys.: Condensed Matter 16 S3257 (2004).