Surface Thermophysical Properties determination of OSIRIS-REx target asteroid (101955) Bennu
Abstract
In this work, we investigate the thermophysical properties of OSIRIS-REx target asteroid (101955) Bennu (hereafter, Bennu), where thermal inertia plays an important role in understanding the nature of the asteroid’s surface, and will definitely provide substantial information for the sampling return mission. Using a thermophysical model incorporating the recently updated 3D radar-derived shape model (Nolan et al., 2013) and mid-infrared observations of Spitzer-PUI, Spitzer-IRAC, Herschel/PACS and ESO VLT/VISIR (M ¨ u ller et al., 2012; Emery et al., 2014), we derive the surface thermophysical properties of Bennu. The asteroid has an effective diameter of m, a geometry albedo of , a roughness fraction of , and thermal inertia of for a best-fit solution at 1 level. The best-estimate thermal inertia indicates that fine-grained regolith may cover a large area of Bennu’s surface, with a grain size that may range from to mm, and our outcome further supports that Bennu would be a suitable target for the OSIRIS-REx mission to return samples from the asteroid to Earth.
Keywords:
radiation mechanisms: thermal – minor planets, asteroids: individual: (101955)Bennu – infrared: general1 Introduction
(101955) Bennu (1999 RQ36) is an Apollo-type near-Earth asteroid (NEA) from a dynamical viewpoint. As is well known, it is widely believed that Bennu could be a potential Earth impactor with a relatively high impact probability of approximately (Milani et al., 2009; Chesley et al., 2014). Nowadays, Bennu is recognized as one of the potentially hazardous asteroids (PHA) and its orbit makes it especially accessible for spacecraft. Therefore, NASA selected Bennu as an ideal target for the OSIRIS-REx sample return mission (Lauretta et al., 2012), which will be launched in 2016.
On the other hand, based on a linear, featureless spectrum from 0.5 to 2.5 m, Bennu is categorized as a B-type asteroid, and the related spectral analogue is considered to be CM chondrite meteorites (Bus & Binzel, 2002; Clark et al., 2011). B-type asteroids are usually thought to be primitive and volatile-rich, and most of them are believed to originate from the middle and outer main belt. Primitive asteroids can offer key clues for us to understand the process of planetary formation, the environment of early solar nebulae, and the emergence of life forms on Earth. From spectroscopic analysis of B-type asteroids, the surface composition appears to be anhydrous silicates, hydrated silicates, organic polymers, magnetite, and sulfides (Larson et al., 1983; Clark et al., 2010; Ziffer et al., 2011; de León et al., 2012), whereas those in the outer main belt may also support the H2O-ice stuff on the subsurface (Rivkin & Emery, 2010; Campins et al., 2010). Both spectral and dynamical investigations suggest that Bennu may be a liberated member of the Polana family in the inner main belt (Campins et al., 2010; Bottke et al., 2015).
According to radar observations acquired from Goldstone and Arecibo at its two closest Earth-approaches in 1999 and 2005, the latest analysis of Nolan et al. (2013) resolved a nearly spherical shape for Bennu, where its effective diameter is m, the rotation period is h and spin axis is , , indicating a retrograde rotation. The rotation period is slow enough for the nearly spherical asteroid to allow potential sampling of the surface regolith. It seems that the rotation period has not been greatly spun up by tidal or radiation forces (e.g. YORP effect). However, the recent work of Chesley et al. (2014) shows that the semimajor axis of Bennu has a mean drift rate because of the Yarkovsky effect. On the basis of this estimation, Chesley et al. (2014) predicted numerous potential impacts for Bennu in the years from 2175 to 2196. It is very necessary to continue to observe and study the orbital evolution of Bennu. Here we aim to investigate the thermal inertia of Bennu, because of a close relationship between thermal inertia and Yarkovsky and YORP effects.
The thermal inertia of an asteroid may be evaluated by fitting mid-infrared observations with a thermophysical model to reproduce mid-IR emission curves. M ¨ u ller et al. (2012) estimated Bennu’s thermal inertia to be with thermophysical model (TPM), based on observations from Herschel/PACS, ESO-VISIR, Spitzer-IRS and Spitzer-PUI. Recently, Emery et al. (2014) showed that a new result of Bennu’s thermal inertia is evaluated to be , using Spitzer-IRS spectra and a multi-band thermal lightcurve. The work of Emery et al. (2014) and M ¨ u ller et al. (2012) differs in two main aspects: first, the former adopted a 3D radar-derived shape model (Nolan et al., 2013) in their modeling process, whereas the latter utilized a simple spherical shape model in the investigation; second, the observational data they used were slightly different, in that IRAC and IRS peak-up data were included in Emery et al. (2014), but not utilized in M ¨ u ller et al. (2012).
In the present work, we adopt independently developed thermophysical simulation codes (Yu, Ji & Wang, 2014) based on the framework of the Advanced Thermal Physical Model (ATPM) (Rozitis & Green, 2011), to investigate the surface thermophysical characteristics of Bennu. In our modelling process, we utilize the radar-derived shape model of asteroid Bennu (Nolan et al., 2013) rather than a spherical approximation shape (M ¨ u ller et al., 2012). In addition, the mid-infrared data come from four groups of observations, at various phase angles, by Spitzer-PUI, Spitzer-IRAC, Herschel/PACS and ESO VLT/VISIR (M ¨ u ller et al., 2012; Emery et al., 2014). With the rotational averaged ATPM results fitted to all observations, we provide constraints for thermal inertia and roughness fraction simultaneously at 1 level. The derived value of thermal inertia for Bennu is slightly lower than that of Emery et al. (2014), which may also provide important evidence of the existence of fine-grained regolith on Bennu’s surface. Moreover, on the basis of the derived thermal inertia, we estimate the grain size of the regolith according to a thermal conductivity model of Gundlach & Blum (2013). Finally, we summarize the major outcomes and present a brief discussion.
2 Thermophysical Modelling
2.1 Mid-infrared Observations
As described above, in our fitting procedure we simply adopt the observations from Spitzer-PUI, Spitzer-IRAC, Herschel/PACS and ESO VLT/VISIR (M ¨ u ller et al., 2012; Emery et al., 2014), as there are no published data sets from Spitzer-IRS. However, the tests of synthetic data from Spitzer-IRS were generated, and included for fitting to examine the difference, but we do not find any significant variation in the results.
If the mid-infrared data at various observational phase angles, especially at low phase angles, are available, a relatively more reliable thermal inertia may be derived on the basis of 1D thermal models. However, currently all published mid-infrared data of Bennu were observed at large phase angles (), e.g., those from Spitzer-IRS, Spitzer-PUI, Spitzer-IRAC, Herschel/PACS and ESO VLT/VISIR. Although the observations at high phase angles constitute a disadvantageous condition to constrain thermal inertia and surface roughness for the asteroid, we can still use these observations, for a combination fitting to observations performed at several different phase angles may remove the degeneracy of thermal inertia and surface roughness in the modelling process, which could somewhat offset the disadvantage of the lack of low phase angle observations. From this viewpoint, the absence of Spitzer-IRS observations may not significantly influence our results, which accord well with the aforementioned tests with synthetic data. Hence, we tabulate all data used in the fitting in Table 1.
| UT | Flux (mJy) | Observatory | ||||||
|---|---|---|---|---|---|---|---|---|
| 16.0 () | 22.0 () | (AU) | (AU) | (∘) | Instrument | |||
| 2007-05-03 00:00 | 12.490.28 | 11.850.41 | 1.12380 | 0.50564 | -63.52 | Spitzer-PUI | ||
| 2007-05-03 02:32 | 12.700.28 | 11.940.42 | 1.12444 | 0.50650 | -63.48 | Spitzer-PUI | ||
| 2007-05-03 03:29 | 13.380.28 | 12.400.42 | 1.12864 | 0.51222 | -63.47 | Spitzer-PUI | ||
| 2007-05-03 04:40 | 12.690.29 | 12.090.40 | 1.12516 | 0.50748 | -63.46 | Spitzer-PUI | ||
| 2007-05-03 08:10 | 12.870.27 | 12.050.41 | 1.12816 | 0.51155 | -63.41 | Spitzer-PUI | ||
| 2007-05-03 08:33 | 12.470.28 | 11.830.42 | 1.12528 | 0.50762 | -63.40 | Spitzer-PUI | ||
| 2007-05-03 09:55 | 13.000.28 | 12.230.40 | 1.12414 | 0.50611 | -63.38 | Spitzer-PUI | ||
| 2007-05-03 10:44 | 13.000.28 | 12.280.43 | 1.12657 | 0.50938 | -63.25 | Spitzer-PUI | ||
| 2007-05-03 20:08 | 13.080.30 | 12.180.44 | 1.12428 | 0.50629 | -63.25 | Spitzer-PUI | ||
| 2007-05-04 07:40 | 12.850.29 | 12.170.42 | 1.12492 | 0.50716 | -63.10 | Spitzer-PUI | ||
| 2007-05-04 11:11 | 12.970.28 | 12.620.42 | 1.12497 | 0.50722 | -63.05 | Spitzer-PUI | ||
| UT | Flux (mJy) | Observatory | ||||||
| 3.6 () | 4.5 () | 5.8 () | 8.0 () | (AU) | (AU) | (∘) | Instrument | |
| 2007-05-08 16:24 | 0.05450.0033 | 0.3240.009 | 1.3960.043 | 4.9680.044 | 1.14245 | 0.53224 | -61.78 | Spitzer-IRAC |
| 2007-05-08 16:46 | 0.04820.0042 | 0.3270.012 | 1.3960.043 | 4.9830.067 | 1.14250 | 0.53232 | -61.78 | Spitzer-IRAC |
| 2007-05-08 17:14 | 0.04810.0029 | 0.3320.006 | 1.4950.035 | 5.0630.074 | 1.14256 | 0.53241 | -61.77 | Spitzer-IRAC |
| 2007-05-08 17:39 | 0.04880.0032 | 0.3340.008 | 1.3970.030 | 4.9700.060 | 1.14261 | 0.53250 | -61.77 | Spitzer-IRAC |
| 2007-05-08 18:06 | 0.04940.0032 | 0.3310.009 | 1.3820.028 | 4.8760.066 | 1.14268 | 0.53259 | -61.76 | Spitzer-IRAC |
| 2007-05-08 18:27 | 0.04500.0027 | 0.3350.013 | 1.3400.042 | 4.9850.047 | 1.14272 | 0.53266 | -61.76 | Spitzer-IRAC |
| 2007-05-08 18:59 | 0.04250.0022 | 0.3080.009 | 1.3530.049 | 4.6640.049 | 1.14280 | 0.53278 | -61.75 | Spitzer-IRAC |
| 2007-05-08 19:22 | 0.04390.0031 | 0.3300.010 | 1.3990.042 | 5.0480.053 | 1.14285 | 0.53285 | -61.75 | Spitzer-IRAC |
| 2007-05-08 19:50 | 0.04920.0041 | 0.3560.009 | 1.5400.042 | 5.2030.045 | 1.14291 | 0.53295 | -61.74 | Spitzer-IRAC |
| 2007-05-08 20:16 | 0.04860.0042 | 0.3170.009 | 1.3700.044 | 4.9070.052 | 1.14297 | 0.53304 | -61.73 | Spitzer-IRAC |
| 2007-05-08 20:39 | 0.04470.0031 | 0.3160.009 | 1.4350.044 | 5.0180.038 | 1.14302 | 0.53312 | -61.73 | Spitzer-IRAC |
| UT | Wavelength | Flux | Observatory | |||||
| () | (mJy) | (AU) | (AU) | (∘) | Instrument | |||
| 2011-09-09 19:01 | 70.0 | 27.01.7 | 1.0146021 | 0.1742221 | +85.3 | Herschel/PACS | ||
| 2011-09-09 19:59 | 70.0 | 24.31.5 | 1.0144716 | 0.1742140 | +85.4 | Herschel/PACS | ||
| 2011-09-09 19:25 | 100.0 | 14.21.1 | 1.0145368 | 0.1742180 | +85.4 | Herschel/PACS | ||
| 2011-09-09 20:24 | 100.0 | 12.01.2 | 1.0144064 | 0.1742101 | +85.4 | Herschel/PACS | ||
| 2011-09-09 19:25 | 160.0 | 6.52.3 | 1.0145368 | 0.1742180 | +85.4 | Herschel/PACS | ||
| 2011-09-09 19:59 | 160.0 | 4.41.9 | 1.0144716 | 0.1742140 | +85.4 | Herschel/PACS | ||
| 2011-09-09 20:24 | 160.0 | 7.62.0 | 1.0144064 | 0.1742101 | +85.4 | Herschel/PACS | ||
| 2011-09-17 09:21 | 8.59 | 23.73.6 | 0.9908803 | 0.1798955 | +89.4 | ESO VLT/VISIR | ||
2.2 Advanced thermophysical model
In ATPM (Rozitis & Green, 2011; Yu, Ji & Wang, 2014), an asteroid is considered to be a polyhedron composed of triangle facets. For each facet, the conservation of energy leads to an instant thermal equilibrium between sunlight, thermal emission, thermal diffusion, multiple-scattered sunlight and thermal-radiated fluxes from other facets. If each facet is small enough, the thermal diffusion on the asteroid can be approximatively described as one-dimensional (1D) heat diffusion. Hence, the temperature of each facet varies with time as the asteroid rotates. In this process, can be enlarged by multiple-scattered sunlight and thermal-radiated fluxes from other facets, which explains well the so-called thermal infrared beaming effect. When the entire asteroid comes into the final thermal equilibrium state, will change periodically following the rotation of the asteroid. Therefore, we can build numerical codes to simulate at any rotation phase for the asteroid. For a given observation epoch, ATPM can reproduce a theoretical profile to each observation flux as:
| (1) |
where is the emissivity, is the view factor of facet to the telescope and is the Plank function:
| (2) |
Thus the calculated can be compared with the thermal infrared fluxes summarized in Table 1 in the fitting process.
2.3 Fitting Procedure
In order to derive the thermophysical nature of Bennu via the ATPM procedure, we need to know several physical parameters - the shape model, surface roughness, geometric albedo, thermal inertia, thermal conductivity and thermal emissivity - which are used as the initial parameters in the calculations. In addition, the heliocentric distance, geocentric distance and phase angle of Bennu are well determined because the asteroid’s orbit has been accurately measured by optical observations. On the other hand, we employ the radar-resolved shape model (Nolan et al., 2013) for Bennu in our fitting procedure, and the incorporation of that shape model will definitely provide an improved determination of the thermal inertia (Emery et al., 2014; Yu, Ji & Wang, 2014).
According to Fowler & Chillemi (1992), an asteroid’s effective diameter , which is defined by the diameter of a sphere with a volume identical to what the radar-derived shape model describes, can be related to its geometric albedo through its absolute visual magnitude by the following equation:
| (3) |
Thus, we actually have three free parameters - thermal inertia, roughness fraction and effective diameter (or geometric albedo)- that should be extensively investigated in the fitting process. Other parameters are listed in Table 2.
Herein the surface roughness is modeled by a fractional coverage of hemispherical craters, symbolized by , whereas the remaining fraction, , represents a smooth flat surface on the asteroid. The hemispherical crater adopted in this work is a low-resolution model consisting of 132 facets and 73 vertices, following a treatment similar to that shown in (Rozitis & Green, 2011; Wolters et al., 2011; Yu, Ji & Wang, 2014). As the sunlight is more easily scattered over a rough surface than a smooth flat region, roughness can decrease the effective Bond albedo. Using the above mentioned model of surface roughness, the effective Bond albedo of a rough surface can be relevant to the Bond albedo of a smooth flat surface and the roughness fraction by (Wolters et al., 2011; Yu, Ji & Wang, 2014)
| (4) |
On the other hand, the effective Bond albedo is related to geometric albedo by
| (5) |
where is a phase integral that can be approximated by (Bowell et al., 1989)
| (6) |
where is the slope parameter in the magnitude system of Bowell et al. (1989). Then for each thermal inertia , roughness fraction , and effective diameter case, a flux correction factor is defined as (Wolters et al., 2011)
| (7) |
where is calculated by inversion of equation (4), to fit the observations, and then the so-called reduced defined as (M ¨ u ller et al., 2011)
| (8) |
can be obtained to assess the fitting degree of our model with respect to the observations. Herein the predicted model flux is a rotationally averaged profile, since the rotation phase of Bennu was unknown at the time of observation. In addition, the FCF plays a less significant role in determining thermal inertia, but simply brings about 0.2% influence on the outcome of effective diameter and geometric albedo.
| Property | Value | References |
|---|---|---|
| Number of vertices | 1348 | (Nolan et al., 2013) |
| Number of facets | 2692 | (Nolan et al., 2013) |
| Shape (a:b:c) | 1.1135:1.0534:1 | (Nolan et al., 2013) |
| Spin axis | (,) | (Nolan et al., 2013) |
| Spin period | 4.2976 h | (Nolan et al., 2013) |
| Absolute magnitude | 20.40 | (Hergenrother et al., 2013) |
| Slope parameter | -0.08 | (Hergenrother et al., 2013) |
| Emissivity | 0.9 | assumption |
In order to simplify the best-fit searching process, a set of thermal inertia are given in the range . For each case, a series of roughness fractions and effective diameters are evaluated to find out which can be taken as the likely solution with respect to the observations. The fitting outcomes are summarized in Table 3. In this table, the values are thereby relevant to each thermal inertia, roughness fraction and effective diameter. Each effective diameter listed in Table 3 is a profile that gives a smallest for each thermal inertia and roughness fraction pair. Roughly speaking, the values imply a best-estimate solution of thermal inertia between , which can be derived from the smallest value in the two-dimension phase space of (, ).
3 Results Analysis
3.1 Thermal inertia and Roughness fraction
To obtain the best-fitting solution of thermal inertia from Table 3, the curves are plotted to determine how globally changes with the free parameters of thermal inertia, roughness fraction and effective diameter (see Figure 1).
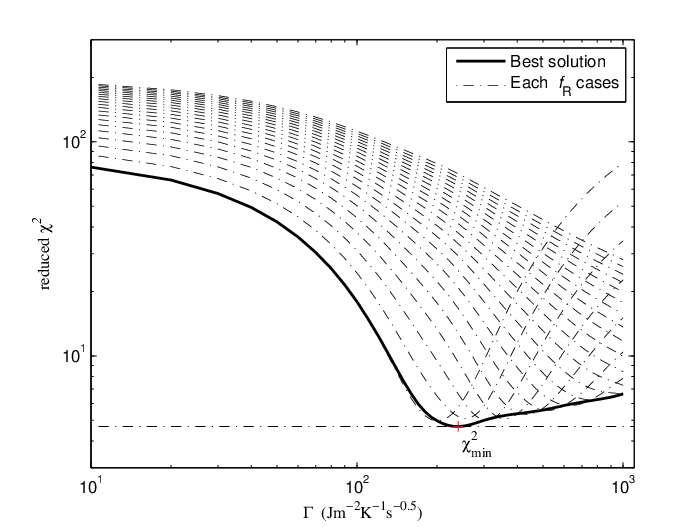
In Figure 1, the bold black curve represents the best estimated solution in the fitting, which is a cubic spline interpolation curve for each lowest calculated from each thermal inertia and roughness fraction. From the curve, we find (referred to the minimum ), occurs in the case of , , and . In addition, we note that decreases rapidly when is less than , but increases rather slowly when becomes larger than . This phenomenon results from the absence of observations at low phase angle, and thus places limitations on the parameter space of thermal inertia. However, the combination of observations at several different phase angles actually weakens the abovementioned disadvantage. Therefore, we can still achieve the best estimate solution for thermal inertia and roughness for Bennu.

| Roughness | Thermal inertia () | |||||||||||||||||
|---|---|---|---|---|---|---|---|---|---|---|---|---|---|---|---|---|---|---|
| fraction | 0 | 100 | 200 | 300 | 400 | 500 | 600 | 800 | 1000 | |||||||||
| 0.00 | 475.1 | 87.04 | 496.2 | 17.87 | 516.8 | 4.97 | 535.2 | 9.49 | 550.6 | 20.00 | 563.3 | 31.85 | 573.7 | 43.55 | 589.9 | 63.77 | 601.1 | 79.70 |
| 0.05 | 457.1 | 98.04 | 478.0 | 24.37 | 497.6 | 6.48 | 514.8 | 5.85 | 529.3 | 11.51 | 541.1 | 19.06 | 550.8 | 26.96 | 565.9 | 41.08 | 576.3 | 52.50 |
| 0.10 | 441.0 | 108.07 | 461.6 | 31.04 | 480.2 | 9.45 | 496.5 | 5.00 | 510.0 | 7.08 | 521.0 | 11.48 | 530.1 | 16.60 | 544.1 | 26.32 | 553.8 | 34.47 |
| 0.15 | 426.6 | 117.23 | 446.7 | 37.66 | 464.5 | 13.29 | 479.8 | 5.96 | 492.5 | 5.36 | 502.8 | 7.40 | 511.3 | 10.46 | 524.3 | 16.90 | 533.4 | 22.64 |
| 0.20 | 413.5 | 125.59 | 433.2 | 44.11 | 450.2 | 17.63 | 464.6 | 8.09 | 476.5 | 5.45 | 486.2 | 5.69 | 494.2 | 7.17 | 506.3 | 11.15 | 514.8 | 15.05 |
| 0.25 | 401.5 | 133.25 | 420.9 | 50.30 | 437.1 | 22.20 | 450.8 | 10.97 | 462.0 | 6.74 | 471.1 | 5.58 | 478.6 | 5.86 | 489.9 | 7.93 | 497.9 | 10.42 |
| 0.30 | 390.6 | 140.26 | 409.5 | 56.21 | 425.1 | 26.87 | 438.1 | 14.30 | 448.7 | 8.82 | 457.3 | 6.58 | 464.3 | 5.90 | 474.9 | 6.47 | 482.4 | 7.85 |
| 0.35 | 380.5 | 146.72 | 399.1 | 61.81 | 414.0 | 31.52 | 426.4 | 17.89 | 436.4 | 11.43 | 444.5 | 8.31 | 451.2 | 6.87 | 461.2 | 6.25 | 468.3 | 6.73 |
| 0.40 | 371.3 | 152.66 | 389.5 | 67.12 | 403.8 | 36.08 | 415.6 | 21.62 | 425.1 | 14.36 | 432.8 | 10.53 | 439.1 | 8.48 | 448.6 | 6.88 | 455.2 | 6.64 |
| 0.45 | 362.7 | 158.16 | 380.5 | 72.14 | 394.3 | 40.53 | 405.6 | 25.39 | 414.7 | 17.48 | 422.0 | 13.07 | 427.9 | 10.52 | 436.9 | 8.13 | 443.2 | 7.28 |
| 0.50 | 354.8 | 163.24 | 372.2 | 76.88 | 385.5 | 44.82 | 396.3 | 29.14 | 405.0 | 20.70 | 411.9 | 15.81 | 417.6 | 12.85 | 426.1 | 9.78 | 432.1 | 8.43 |
| 0.55 | 347.4 | 167.97 | 364.5 | 81.36 | 377.3 | 48.95 | 387.7 | 32.83 | 395.9 | 23.95 | 402.6 | 18.66 | 408.0 | 15.35 | 416.1 | 11.72 | 421.8 | 9.94 |
| 0.60 | 340.5 | 172.36 | 357.2 | 85.58 | 369.6 | 52.92 | 379.6 | 36.44 | 387.5 | 27.18 | 393.9 | 21.56 | 399.0 | 17.95 | 406.8 | 13.84 | 412.3 | 11.70 |
| 0.65 | 334.0 | 176.46 | 350.5 | 89.57 | 362.5 | 56.72 | 372.0 | 39.94 | 379.7 | 30.38 | 385.7 | 24.47 | 390.7 | 20.60 | 398.1 | 16.08 | 403.4 | 13.62 |
| 0.70 | 328.0 | 180.29 | 344.1 | 93.35 | 355.7 | 60.35 | 365.0 | 43.32 | 372.3 | 33.50 | 378.2 | 27.35 | 382.9 | 23.27 | 390.0 | 18.38 | 395.0 | 15.65 |
| 0.75 | 322.4 | 183.87 | 338.2 | 96.92 | 349.4 | 63.82 | 358.4 | 46.59 | 365.4 | 36.55 | 371.0 | 30.18 | 375.6 | 25.91 | 382.4 | 20.71 | 387.3 | 17.73 |
| 0.80 | 317.1 | 187.24 | 332.6 | 100.30 | 343.5 | 67.13 | 352.2 | 49.74 | 359.0 | 39.51 | 364.4 | 32.95 | 368.7 | 28.52 | 375.3 | 23.04 | 380.0 | 19.84 |
| 0.85 | 312.1 | 190.40 | 327.3 | 103.50 | 338.0 | 70.30 | 346.3 | 52.77 | 352.9 | 42.37 | 358.1 | 35.65 | 362.3 | 31.07 | 368.6 | 25.34 | 373.1 | 21.95 |
| 0.90 | 307.4 | 193.38 | 322.4 | 106.54 | 332.7 | 73.32 | 340.8 | 55.68 | 347.2 | 45.14 | 352.2 | 38.28 | 356.3 | 33.56 | 362.4 | 27.61 | 366.7 | 24.04 |
| 0.95 | 303.0 | 196.18 | 317.7 | 109.43 | 327.8 | 76.21 | 335.7 | 58.47 | 341.8 | 47.81 | 346.7 | 40.82 | 350.6 | 35.99 | 356.5 | 29.84 | 360.7 | 26.11 |
| 1.00 | 298.9 | 198.84 | 313.4 | 112.18 | 323.2 | 78.97 | 330.8 | 61.15 | 336.8 | 50.38 | 341.5 | 43.28 | 345.3 | 38.35 | 351.0 | 32.01 | 355.1 | 28.14 |
Figure 2 shows a contour of in the 2-dimensional parameter space (, ), in which is represented by colour. The increase of is shown by ColorBar from blue to red. The black ’+’ shows where occurs in the (, ) parameter space. The blue curve corresponds to , where a 1 limit of the free fit parameters and is assumed. We observe that the blue profile is closed in the (, ) space, indicating that we can provide a constraint for thermal inertia and roughness fraction simultaneously, within the 1 limit. However, when considering a higher limit of free parameters above 1, the degeneracy of thermal inertia and roughness fraction cannot be removed as well as 1 level, indicating that thermal inertia and roughness fraction may be simply separated at 1 level based on the calculations given in Table 3. Therefore, if 1 limit is reliable, we may safely conclude that the roughness fraction is likely to be in the range of 00.3, whereas the thermal inertia is possibly in the range of . Our result coincides with earlier investigations of M ¨ u ller et al. (2012) and Emery et al. (2014). Table 4 summarizes the derived results of the properties of Bennu.
| Property | Result |
|---|---|
| Thermal inertia () | |
| Roughness fraction | |
| Effective diameter (m) | |
| Geometric albedo |
In the subsequent section, we will now employ these derived parameters to evaluate the surface thermal environment of Bennu at its aphelion and perihelion, respectively.
3.2 Temperature Distribution
Since Bennu is a spacecraft target asteroid, the surface temperature is very essential to be estimated as a reference for the mission input. Now the surface nature of Bennu’s thermal inertia and geometric albedo are precisely derived from the thermal modelling process, therefore we can easily obtain the surface temperature distribution of Bennu at any epoch from the thermophysical model.


Figure 3 shows the global surface temperature distribution of Bennu at its aphelion (left panel) and perihelion (right panel), respectively. In the Figure, the utilized-coordinate can be named as ”the frame system”, where the coordinate origin represents the asteroid center, the z-axis coincides with the positive spin axis, and the x-axis follows the rules so that the Sun always locates within the x-z-plane. The profile of temperature in Figure 3 is shown by the colorbar index - the red region represents the facets are sunlit, whereas the blue facets are related to relatively low temperatures. As shown in Figure 3, the surface temperatures of its aphelion and perihelion are roughly in the range of - and - , respectively.
Figure 4 shows the equatorial temperature distributions of Bennu at its aphelion and perihelion, respectively. The maximum temperature does not appear at the sub-solar point, but delays , and the minimum temperature occurs just a little after the local sunrise, trailing . This postponed effect between absorption and emission is actually brought about by non-zero thermal inertia and the finite rotation speed of the asteroid. On the other hand, Figure 4 shows that the equatorial temperature of Bennu alters from to over an entire orbital period.
3.3 Regolith
As mentioned previously, Bennu has been chosen as the target asteroid of the OSIRIS-REx sample return mission; thus we show great interest in the surface features of the asteroid, whether a regolith layer exists on its surface. Generally, thermal inertia is a good indicator to infer the presence or absence of loose material on the asteroid’s surface. As is well known, fine dust has a very low thermal inertia of , and lunar regolith corresponds to a relatively low value about . In comparison, the soil of a sandy regolith like Eros may have a value of , but coarse sand (e.g., Itokawa’s Muses-Sea Regio) is likely to possess a relatively higher thermal inertia profile . However, bare rock has an extremely high thermal inertia, greater than (Delbo et al., 2007). In summary, the given information suggests that a lower thermal inertia for the asteroid may be related to a regolith layer. Since the derived thermal inertia of Bennu is larger than that of Eros but lower than that Itokawa, we may infer that regolith may exist on the surface of Bennu.
Although thermal inertia is associated with the surface properties, a question arises – what does the profile of thermal inertia tell us about the surface properties? Generally, we are interested in the investigation of grain size and regolith thickness of the asteroid, because these play an important role in understanding the primitive substance on/underneath the regolith layer; they further provide good engineering parameters for the sample return mission. Theoretically, the so-called ’skin depth’:
| (9) |
is usually presented to characterize the maximum grain size of regolith. Thus, if the , , and of Bennu are known, in general can be estimated to reveal the maximum grain size of regolith on the surface of Bennu. Recently, the bulk density of Bennu has been updated to (Chesley et al., 2014). However, the regolith density for Bennu is unknown, so the bulk density may work as a reference because the regolith density is generally no larger than the bulk density. Thus we adopt the bulk density as an approximation for the average density of the surface regolith when estimating the skin depth . The rotation period is about 4.2976 h according to Nolan et al. (2013). We may use the specific heat capacity of CM or CI carbonaceous chondrites to approximate the specific heat capacity of the surface regolith, where (Opeil et al., 2012). In this way, we can estimate the skin depth of Bennu to be about 1.9 cm, which suggests that the grain size may be less than cm-scale. Of course, the estimation of grain size from skin depth is rough; thus it would be appreciated if another way could be found to estimate the grain size of Bennu’s surface regolith.
According to the definition of thermal inertia:
| (10) |
where is mean density of the surface, is the grain’s density, (1-porosity) represents packing fraction of surface, is the specific heat capacity and is the thermal conductivity. Thus the thermal conductivity is directly related to the thermal inertia and packing fraction .
Gundlach & Blum (2013) builds a thermal conductivity model and provides a formula to theoretically estimate thermal conductivity from average radii of grains , packing fraction and temperature :
| (11) |
The details of eq. (11) are described in (Gundlach & Blum, 2013). Thus, the relationship between thermal inertia and grain size can be obtained by comparing the derived from to the estimated from Formula (11). Hence, we can estimate the surface grain radius with the thermal inertia derived from above-mentioned thermophysical modelling process.
Figure 5 shows that the curve is plotted with the parameters listed in Table 5 in combination of Equation 10 and 11. We assume an average surface temperature K based on Figure 4 in the computation. The other parameters are adopted from Gundlach & Blum (2013). Since there are still many assumptions and uncertainties in the parameters of Table 5, the uncertainties of (11) are rather difficult to determine. Thus we just choose the suggested parameters to estimate the most likely results for Bennu. Using the best-fit value of thermal inertia , we estimate the grain radius is likely to be in the range mm. Furthermore, considering a 1 range of thermal inertia, we may estimate the grain radius is possibly in the range between mm. According to this evaluation of grain radius, we infer that boulders or rocks may be few on the surface of Bennu, implying that the Touch-And-Go Sample Acquisition Mechanism (TAGSAM) designed by the OSIRIS-REx team will be available to be implemented successfully.
| Property | Value |
|---|---|
| [] | |
| 0.25 | |
| [Pa] | |
| [] | |
| 1 | |
| 3110 [] | |
| 560 [] | |
| 300 K | |
| : thermal conductivity of the solid material | |
| : Poisson’s ratio | |
| : Young’s modulus | |
| : specific surface energy | |
| : emissivity of the material | |
| : density of the solid material | |
| : heat capacity of the solid material | |
| : surface temperature | |

4 Discussion and Conclusion
In this work, using the thermophysical model incorporating the 3D radar-derived shape model (Nolan et al., 2013), and mid-infrared data of Spitzer-PUI, Spitzer-IRAC, Herschel/PACS and ESO VLT/VISIR observations (M ¨ u ller et al., 2012; Emery et al., 2014), we have investigated the thermophysical nature of Bennu. We show that the thermal inertia , the roughness fraction , the effective diameter , and the geometric albedo . The effective diameter acquired herein is a little larger than the former results (M ¨ u ller et al., 2012; Emery et al., 2014) and that of the radar-derived shape model (Nolan et al., 2013), but the value of geometric albedo we derived is much closer to those of M ¨ u ller et al. (2012) and Emery et al. (2014), because a greater absolute visual magnitude is used in the fitting process. The best solution of thermal inertia is even lower than that of Emery et al. (2014), whereas the low roughness results are consistent with each other. The slight deviation of Bennu’s thermal inertia between this work and Emery et al. (2014) may arise from three aspects: first of all, we adopt a different thermophysical modelling procedure (Rozitis & Green, 2011; Yu, Ji & Wang, 2014), where the beaming is modelled by solving the energy conservation equation in consideration of multiple scattering of sunlight and self-heating of thermal emission; then, the model-derived fluxes are rotationally averaged in this work, whereas Emery et al. (2014) constrained the rotational phase directly from Spitzer data; last, the thermal inertia and roughness fraction are simultaneously determined in the 2D parameter space, thus leading to a larger possible range of thermal inertia than that of Emery et al. (2014). In a word, the physical parameters for Bennu we derived are essentially supportive of those of Emery et al. (2014).
We employ the ratio of ’observation/model’ (M ¨ u ller et al., 2005; M ¨ u ller et al., 2011; M ¨ u ller et al., 2012) to examine how the theoretical model results match the observations at various phase angles and wavelengths (see Figure 6 and 7), for the reliability of our fitting process and derived outcomes may be verified from these comparisons.
In Figure 6, the observation/ATPM ratios are shown at each observational wavelength for , , and . The ratios are distributed nearly symmetrically around 1.0, despite several ratios at low-wavelength and long-wavelength about move relatively farther from unity. From Figure 7, we find that the deviations of low-wavelength and long-wavelength come from Spitzer-IRAC and Herschel/PACS, respectively. As the Wien peak of the thermal emission of NEAs approximately arises at , the deviation at those wavelengths far away from the Wien peak is inevitable, indicating that Herschel observations at long-wavelength (M ¨ u ller et al., 2012) are not very sensitive to the averaged surface temperature of Bennu, and thus have insignificant influence on the derived thermal inertia. However, the Herschel data can still be helpful to improve the determination of the effective diameter.
On the other hand, although the Spitzer-IRAC and Herschel/PACS observations appear to deviate away from unity, the degeneracy of thermal inertia and roughness are actually removed via our modelling procedure through the combination fitting to all observations (see Table 1) at discrepant phase angles. Therefore, we successfully provide a constraint for thermal inertia and roughness fraction simultaneously based on the 1 limit. This processing method differs from previous models, which usually determine thermal inertia with several empirical roughnesses. Hence, we safely come to the conclusion that the outcomes of thermal inertia and roughness are reliably derived from our modelling process.


In conclusion, the average thermal inertia of Bennu of approximately , provides direct evidence that the asteroid’s surface properties are an intermediate case between Eros and Itokawa, implying the possible existence of regolith on its surface. As described above, a very small roughness fraction for the asteroid is derived simultaneously with thermal inertia in the modelling procedure, therefore we infer that Bennu’s surface would be fairly smooth. Additionally, based on the best-estimate thermal inertia and roughness, fine-grained regolith would be likely to exist and cover a large area of the surface of Bennu. Finally, the estimated grain size ranging from to mm is indicative that Bennu would be an excellent target asteroid for the forthcoming OSIRIS-REx sample return mission.
Acknowledgments
The authors thank the anonymous referee for his/her constructive comments that greatly helped to improve the content of this manuscript. This work is financially supported by National Natural Science Foundation of China (Grants No. 11273068, 11473073, 11403105), the Strategic Priority Research Program-The Emergence of Cosmological Structures of the Chinese Academy of Sciences (Grant No. XDB09000000), the innovative and interdisciplinary program by CAS (Grant No. KJZD-EW-Z001), the Natural Science Foundation of Jiangsu Province (Grant No. BK20141509), and the Foundation of Minor Planets of Purple Mountain Observatory.
References
- Bevington & Robingson (2003) Bevington, P.R., Robinson, D.K., 2003. Data Reduction and Error Analysis for the Physical Sciences, third ed. McGraw-Hill, New York, pp. 194-217
- Bowell et al. (1989) Bowell, E., Hapke, B., Domingue, D., et al., 1989, Application of photometric models to asteroids. In Asteroids II, pp. 524-556
- Bottke et al. (2015) Bottke, W.F., et al. 2015, Icarus, 247, 191-217
- Bus & Binzel (2002) Bus S. J., Binzel R. P., 2002, Icarus, 158, 146
- Campins et al. (2010) Campins H., Morbidelli A., Tsiganis K., et al. 2010, ApJ, 721, L53
- Chesley et al. (2014) Chesley, S.R., Farnocchia, D., Nolan, M.C., et al., 2014, Icarus, 235, 5-22
- Clark et al. (2010) Clark, B.E. et al., 2010. J. Geophys. Res. 115, E06005
- Clark et al. (2011) Clark, B. E., Binzel, R. P., Howell, E., et al. 2011, Icarus, 216, 462-475
- Delbo et al. (2007) Delbo, M., Oro, A., Harris, A.W., Mottola, S., & Muller, M., 2007, Icarus, 190, 236-249
- de León et al. (2012) de León, J.,, Pinilla-Alonso, N., Campins, H., et al., 2012, Icarus, 218, 196-206
- Emery et al. (2014) Emery, J.P., Fernndez, Y.R., Kelley, M.S.P., et al., 2014, Icarus, 234, 17-35
- Fowler & Chillemi (1992) Fowler, J.W., & Chillemi, J.R., 1992, IRAS asteroids data processing. In The IRAS Minor Planet Survey, pp.17-43
- Gundlach & Blum (2013) Gundlach, B., Blum, J., 2013, Icarus, 223, 479-492
- Haack et al. (1990) Haack, H., Rasmussen, K. L., Warren, P. H., 1990, JGR, 95, 5111
- Hergenrother et al. (2013) Hergenrother, C.W., Nolan, M.C., Binzel, R.P., et al., 2013, Icarus, 226, 663-670
- Larson et al. (1983) Larson, H.P., Feierberg, M.A., Lebofsky, L.A., 1983, Icarus, 56, 398-408
- Lauretta et al. (2012) Lauretta, D. S., and the OSIRIS-REx Team, 2012, LPS XXXXIII, Abstract 2491
- Milani et al. (2009) Milani, A., Chesley, S.R., Sansaturio, M.E., et al. 2009, Icarus, 203(2), 460-471
- Mller et al. (2005) Mller, T.G., Sekiguchi, T., Kaasalainen, M., Abe, M., & Hasegawa, S., 2005, A&A, 443, 347
- Mller et al. (2011) Mller, T.G., Durech, J., Hasegawa, S., et al., 2011, A&A, 525, A145
- Mller et al. (2012) Mller, T.G., O’Rourke, L., Barucci, A.M., et al., 2012, A&A, 548, A36
- Nolan et al. (2013) Nolan, M.C., Magri, C., Howell, E.S., et al., 2013, Icarus, 226, 629-640
- Opeil et al. (2012) Opeil, C.P., Consolmagno, G.J., Safarik, D.J., Britt, D.T., 2012, Meteorit. Planet. Sci. 47, 319-329
- Rivkin & Emery (2010) Rivkin A. S., Emery J. P., 2010, Nature, 464, 1322
- Rozitis & Green (2011) Rozitis, B., & Green, S.F., 2011, MNRAS, 415, 2042
- Saito et al. (2006) Saito J., Miyamoto H., Nakamura R. 2006, Science, 312, 1341
- Wolters et al. (2011) Wolters, S.D., Rozitis, B., Duddy, S.R., et al., 2011, MNRAS, 418, 1246
- Yu, Ji & Wang (2014) Yu L.L., Ji J.H., & Wang S., 2014, MNRAS, 439, 3357
- Ziffer et al. (2011) Ziffer J., Campins H., Licandro J., et al., 2011, Icarus, 213, 538-546