Measurement of the EMC Effect in the Deuteron
Abstract
We have determined the structure function ratio from recently published data taken by the BONuS experiment using CLAS at Jefferson Lab. This ratio deviates from unity, with a slope in the range of Bjorken from 0.35 to 0.7, for invariant mass GeV and GeV2. The observed EMC effect for these kinematics is consistent with conventional nuclear physics models that include off-shell corrections, as well as with empirical analyses that find the EMC effect proportional to the probability of short-range nucleon-nucleon correlations.
pacs
21.45.Bc, 25.30.Fj, 24.85.+p, 13.60.HbI Introduction
In the early 1980s the European Muon Collaboration (EMC) discovered that deep-inelastic scattering from atomic nuclei is not simply the incoherent sum of scattering from the constituent nucleons [1]. Their data suggested that quarks with longitudinal momentum fraction in the range 0.35 to 0.7 were suppressed in bound nucleons, and their observations were quickly confirmed at SLAC [2, 3]. The deep-inelastic structure function for a nucleus with nucleons was compared to the equivalent quantity for the deuteron, such that . At intermediate , is less than unity, and this deviation grows with . Over the following three decades, subsequent dedicated measurements [4, 5, 6, 7, 8] confirmed the EMC effect with ever-increasing precision for a wide range of nuclei. Drell-Yan data from Fermilab [9], however, which were largely sensitive to sea quarks, showed no modifications of the anti-quark sea for , contrary to models predicting anti-quark enhancement. Despite many theoretical papers on the EMC effect, no universally accepted explanation has emerged. For reviews, see Refs. [10, 11, 12].
The precise, new measurements from Jefferson Lab on light nuclei [8] have generated a renewed interest in understanding the EMC effect. The slopes for increase with , however, the 9Be slope is anomalously large, suggesting perhaps that the EMC effect is dependent on local density and that 9Be might be acting like two tightly bound particles and a neutron. A recent analysis [13] suggests that is proportional to the probability of finding short-range correlations in nuclei [14, 15, 16, 17, 18, 19]. Recent work on this subject [20, 21, 22, 23, 24, 25] concludes that although binding and Fermi motion effects contribute, some modification of the bound nucleon’s structure appears to be required to explain the EMC effect. Whether this is caused by the nuclear mean field, short-range correlations, or both is still open to debate.
EMC ratios are usually taken with respect to the deuteron, which is the best proxy for an isoscalar nucleon (neutron plus proton), but the deuteron too may exhibit an EMC effect. Several data-driven, model-dependent attempts [26, 7, 13] have been made to determine , in which is the free neutron (proton) structure function. However, the lack of knowledge about the free neutron’s structure has clouded these efforts. Theoretical estimates of the deuteron EMC ratio have also been made [27, 28, 29, 30, 31, 32, 33, 34, 35, 36, 37, 38, 39], often with the goal of isolating .
A clean measurement of is greatly needed. The deuteron is weakly bound (by 2.2 MeV), and the nucleons are governed only by the interaction. Therefore, a precise measurement of can shed light on the cause of the EMC effect. Because the deuteron has a weak mean field (1 MeV/nucleon binding versus 8 MeV/nucleon for heavier nuclei), but a substantial contribution from high-momentum pairs, it is a good test-case.
II Data Analysis
A new extraction of with smaller uncertainties on is now possible thanks to the high-quality data from the BONuS experiment [40, 41, 42] using CLAS at Jefferson Lab with electron beams up to 5.26 GeV. BONuS was designed to measure the high- structure function ratio using a model-independent extraction of that relies on the spectator tagging technique. The experiment used a 7-atmosphere gaseous deuterium target surrounded by a radial time projection chamber capable of detecting recoil protons in the range 70-200 MeV/c [40]. By selecting backward-going and low-momentum spectators, final-state interactions and off-shell effects were minimized, respectively [42]. Detection of the spectator proton ensured that the electron scattered from the neutron. The initial-state kinematics of the neutron were then calculated from the spectator momentum. This technique enabled the extraction of over a wide range of for 4-momentum transfer squared between 0.7 and 4.5 GeV2, which covers the resonance region and part of the deep-inelastic region. For the present analysis we have used the published data from the 4.22 and 5.26 GeV beam energies with GeV2 and invariant final-state mass GeV to determine .
The primary data from BONuS are the ratios obtained from measuring tagged neutron event rates in CLAS and dividing them by the untagged deuteron rates recorded simultaneously at the same kinematics [42]. Consequently, detector acceptance and other systematic effects largely cancel, and the accuracy of this ratio is far better than that of alone.
The overall normalization of the BONuS data, which takes into account the spectator proton detection efficiency, was initially chosen [41] to make at agree with the CTEQ-Jefferson Lab (CJ) [43] global fit for this point. There is a 3% normalization uncertainty associated with this choice. For the final BONuS results [42], which include the resonance region, the normalization minimized the of the full data set with respect to the most recent update [44] of the Christy and Bosted (CB) fits [45, 46]. In this case, the convolution model of Ref. [25, 36] allowed for a self-consistent extraction of from and and better control over the relative normalization of and . The new model produced no change in the 5 GeV normalization, but a 10% increase in the magnitude of the 4 GeV data.
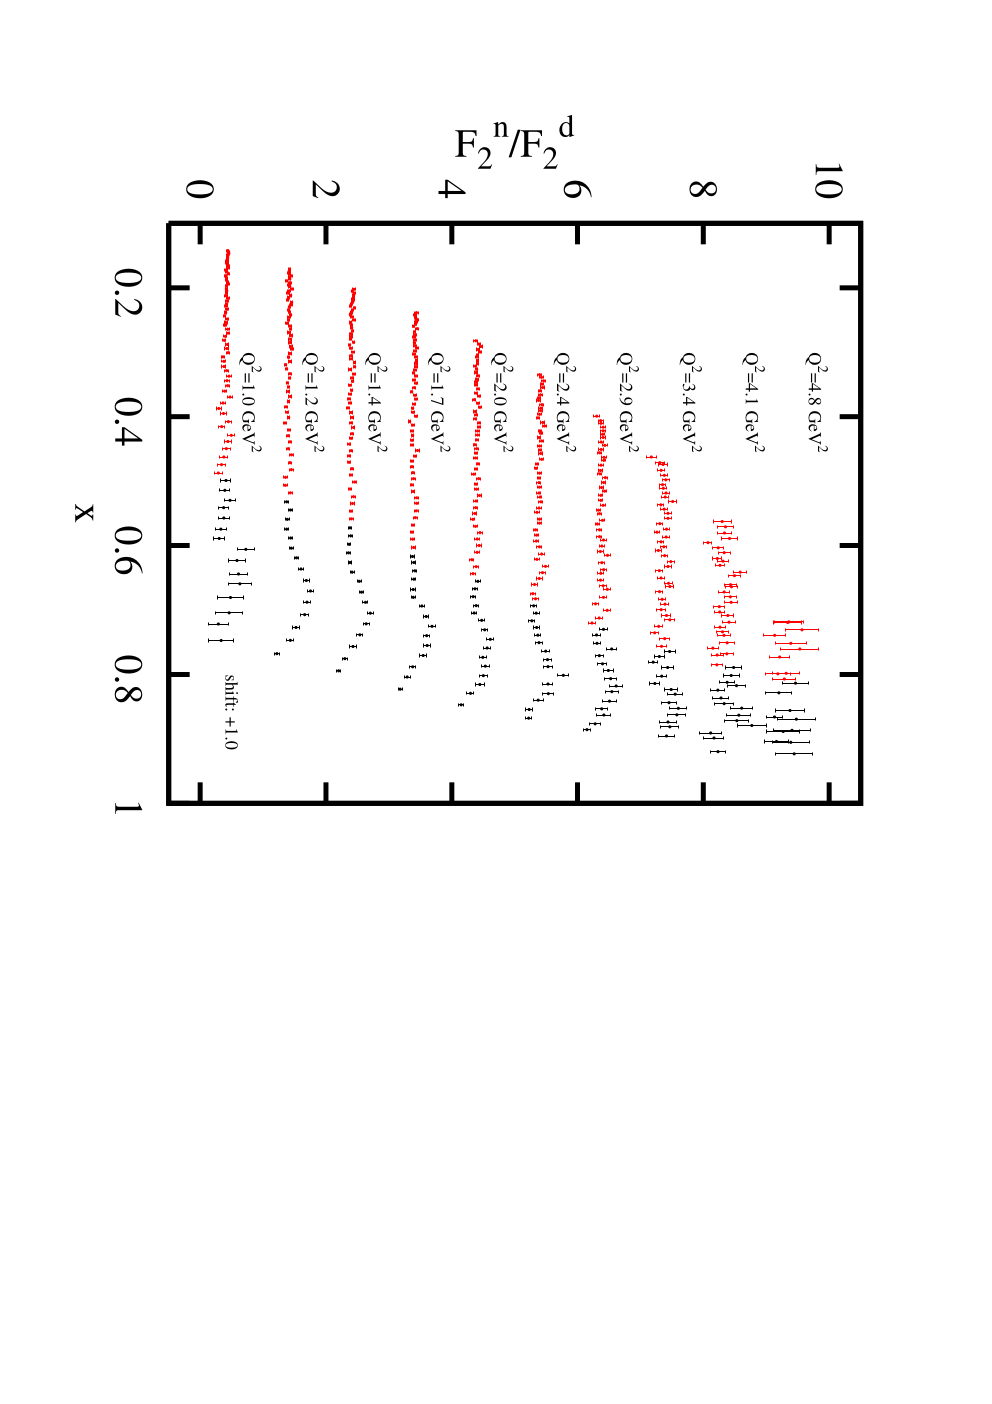
Figure 1 shows the BONuS data set taken with a 5.26 GeV beam. The red points correspond to values of the struck neutron’s invariant mass above 1.4 GeV, whereas the black points ( GeV) are excluded from this analysis to eliminate the resonance.
With the new normalization, both the 5.26 and 4.22 GeV data sets yield consistent results within the statistical uncertainties. To explore the region we pushed our analysis into the resonance region ( GeV). Available data, albeit at slightly higher , suggest that in the resonance region is similar to that in the deep-inelastic scattering region at the same [47]. Therefore, we expect that an average over many different values washes out any resonance structure and that duality ensures at fixed , averaged over , approaches the deep-inelastic limit. These assumptions were tested and confirmed within statistical and systematic uncertainties by looking for a dependence of within each -bin and by considering variations in among four kinematic cases:
- 1.
GeV and GeV2;
- 2.
GeV and GeV2;
- 3.
GeV and GeV2; and
- 4.
GeV and GeV2.
The data were sorted into 20-MeV-wide bins and into logarithmic bins (13 per decade) with edges at 0.92, 1.10, 1.31, 1.56, 1.87, 2.23, 2,66, 3.17, 3.79, 4.52, and 5.40 GeV2.
The analysis consisted of forming the quantity
| (1) |
in which the first term is the measured BONuS ratio and the second term is the parameterization of world data [45, 46, 44]. All data falling within one of the 20 -bins of width 0.05 were combined using
| (2) | |||||
| (3) | |||||
| (4) | |||||
| (5) |
in which are the statistical uncertainties and are the corresponding systematic uncertainties for the th datum.
The final values for were then calculated as
| (6) | |||||
| (7) | |||||
| (8) |
III Uncertainties
Several checks on our results were made. First, the analysis was performed by directly calculating using the same 20 -bins. The final answers were nearly identical to those in which inversion was the last step. The statistical spread in the ratio in each -bin was used to calculate a standard error. This error agreed very well with , which supports the hypothesis that variations in within a bin are purely statistical. Systematic bias was also studied using a cut for GeV2, which in the region of comparison showed no significant deviation from the data that include lower values.
Overall systematic uncertainties were estimated by varying the models for and the kinematic cuts. The model dependence was explored using the published CB fits and two later improvements applied to kinematic Case 1 using the 5 GeV data. The kinematic-dependence was explored using kinematic Cases 1–4 for the 5 GeV data and Case 1 for the 4 GeV data. In order to separate the overall normalization uncertainty from other systematic uncertainties, we fit the EMC slope in the range and rescaled the data such that the linear fit intersected unity at . This value was obtained from a global analysis of the EMC effect in all nuclei [13]. The scaling factors ranged from 0.99 to 1.01 for the different cases. The average variation in at fixed for the different cases, the 1% scale uncertainty, and the BONuS systematic uncertainty were added in quadrature to yield , which is listed in Table 1 and shown as the blue band in Figure 2. The systematic uncertainties of the BONuS data themselves dominate at large , whereas the model uncertainties of the global fits dominate at low (high ). The mid- region is dominated by the normalization uncertainty. For Case 2 with , tends to be higher than for Case 1. This arises in a region of significantly lower statistics on account of the higher -cut and fewer kinematic points available for resonance averaging. Although the slope in this case is consistent with zero, we find this result unstable to small changes in kinematics. Case 2 at high figures into the systematic errors on our quoted values, however.
Since the data span a large and relatively low range starting at 1 GeV2, one needs to worry about whether is simply an artifact of structure function evolution. To study this we looked at the contents of each -bin separately. Figure 1 shows that each -bin covers a wide enough range to study variations within that bin. For this study each data point was converted into as described above, and instead of averaging, all values were fit to a straight line vs. . Fitting to a constant slope yields , which is consistent with no observable variation.
Although the BONuS data were extracted assuming that the longitudinal-to-transverse cross section ratio cancels in the neutron to deuteron ratios, the associated uncertainty is included in the published results. Some nuclear dependence to could, however, slightly modify our EMC results [48].
IV Results

Our final result uses the new self-consistent convolution model [44] for , which was used to determine the absolute normalization of the final published BONuS data [42]. It provides an excellent representation of for our kinematics. Our result uses the combined 5.26 and 4.22 data with cuts GeV2 and GeV. A linear fit for yields where the uncertainty comes from the fit. Figure 2 shows these results together with comparisons to various models. For the EMC ratios agree within uncertainties with those obtained using more stringent cuts in . The ratio for continues the trend of the lower- data, with a hint of the expected rise above as seen in for heavier nuclei, but these high- values are more uncertain because there are fewer data points for resonance averaging. The black circles are the combined results for 4 and 5 GeV, which are clearly dominated by the 5 GeV data. The 4 GeV data by themselves (red triangles), are consistent with the combined data set. The two points between and 0.6 seem to be off the trend, one being high and the other low. Because this is consistent for the two beam energies, we suspect that there is a slight mismatch between the model form factors and the data in this region.
Table 1 gives our numerical results, in which is the number of points contributing to a bin with average kinematic values and . Here and are the statistical and systematic uncertainties that come from the BONuS data themselves, and is the total systematic uncertainty that includes plus the modeling and normalization uncertainties in .
| (GeV | ||||||
|---|---|---|---|---|---|---|
| 28 | 0.177 | 1.09 | 0.995 | 0.003 | 0.002 | 0.015 |
| 55 | 0.224 | 1.24 | 0.991 | 0.003 | 0.003 | 0.010 |
| 65 | 0.273 | 1.39 | 0.997 | 0.003 | 0.003 | 0.007 |
| 71 | 0.323 | 1.50 | 0.994 | 0.003 | 0.004 | 0.007 |
| 70 | 0.373 | 1.63 | 1.000 | 0.003 | 0.005 | 0.007 |
| 70 | 0.422 | 1.71 | 0.992 | 0.003 | 0.007 | 0.009 |
| 71 | 0.472 | 1.85 | 0.983 | 0.004 | 0.009 | 0.009 |
| 56 | 0.523 | 2.01 | 0.967 | 0.004 | 0.011 | 0.012 |
| 47 | 0.572 | 2.30 | 0.994 | 0.006 | 0.013 | 0.014 |
| 41 | 0.619 | 2.54 | 0.974 | 0.007 | 0.017 | 0.017 |
| 26 | 0.670 | 2.97 | 0.984 | 0.011 | 0.020 | 0.021 |
| 21 | 0.719 | 3.39 | 1.019 | 0.019 | 0.023 | 0.025 |
| 11 | 0.767 | 4.03 | 1.075 | 0.041 | 0.024 | 0.029 |
The current results can be compared to the SLAC model-dependent extraction from Ref. [7]. Here was estimated assuming the hypothesis of Ref. [50] that is proportional to the nucleon density. The SLAC slope is similar to our own, but its quoted uncertainty takes no account of the model-dependence. The assumption of density-dependence gives consistent results with our measurements for the deuteron. Semi-empirical models like that of Ref. [36] (blue dashed curve in Figure 2), which include Fermi motion, binding, and off-shell effects, are able to describe the shape of quite well. Our data are also consistent with the CJ12 [49] band in yellow.
We have explored whether the Nachtmann variable (with the nucleon mass) would be better suited than to represent , since our data are at relatively low . The authors of Refs. [47, 8] too have addressed this question. They and we prefer , which has been the common variable of discourse and calculation. Our EMC ratios are determined using data and model at precisely the same values of and . Therefore, plotting versus merely redistributes the EMC points along the axis. Generally, is smaller than . Consequently, more of the high- resonances in the data-set now contribute to the EMC slope. Thus, using to reduce the effect of resonances, actually increases their influence. A fit over the rescaled interval [0.35,0.65] yields . The slope is slightly smaller and the uncertainty slightly larger than when we plot versus . Resonance states above drive the slope to slightly smaller values than the fit versus .
The analysis of Ref. [13] finds a linear relationship of the EMC slopes versus the relative short-range correlation probability in a nucleus with respect to the deuteron. From that analysis the authors conclude that the deuteron EMC slope should be . This value is somewhat smaller than our result of but is consistent within 1. A more recent analysis along these same lines brackets the slope between and [19], and suggests that the uncertainties of Ref. [13] are underestimated.
V and Short-Range Correlations

We are able to use our results to estimate the in-medium correction with slope , for which the normalizing factor is the isoscalar free nucleon. We write assuming that all nuclei have ratios of unity at , as found in Ref. [13]. The nuclear EMC ratio can be multiplied by the deuteron EMC ratio to obtain . Hence, to good approximation, . Figure 3 shows the results. The data are consistent with the ansatz that is directly proportional to , the short-range correlation probability, with a proportionality constant (/dof = 1.22). This effect persists for the isospin and nuclear--corrected data from Ref. [20] (blue points), which have the same uncertainties as the red points. The linear relationship between short-range correlations and EMC slopes, with the shift for the deuteron EMC effect, is now consistent with an intercept of zero, and the relationship becomes a straight proportion described by a single free parameter.
VI Synopsis
In summary, we find an EMC-like slope in the ratio of deuteron to free nucleon structure functions, using the BONuS data (which are partially in the nucleon resonance region above the resonance). This slope is consistent with conventional nuclear physics models that include off-shell corrections, as well as with short-range-correlation models of the EMC effect. This first, direct measurement of the magnitude of the EMC effect in deuterium demonstrates that the new BONuS experiment at 11 GeV using CLAS12, with its better precision, larger average , and deep-inelastic kinematics, will be able to determine with good accuracy.
Acknowledgements.
We thank the staff of the Jefferson Lab accelerator and Hall B for their support on the BONuS experiment. This work was supported by the United States Department of Energy (DOE) Contract No. DE-AC05- 06OR23177, under which Jefferson Science Associates, LLC operates Jefferson Lab. S.K., J.A., S.T., and K.G. acknowledge support from the DOE, Office of Science, Office of Nuclear Physics, under grants DE-FG02-96ER40960, DE-AC02-06CH11357, DE-FG02-97ER41025, and DE-FG02-96ER41003, respectively. I.N. and G.N. acknowledge support from the NSF under grant PHY-1307196. M.E.C. acknowledges support from NSF grants PHY-1002644 and PHY-1307415.References
- [1] J. Aubert et al. (European Muon Collaboration), Phys. Lett. B123, 275 (1983).
- [2] A. Bodek, N. Giokaris, W. Atwood, D. Coward, D. Dubin, et al., Phys. Rev. Lett. 51, 534 (1983a).
- [3] A. Bodek, N. Giokaris, W. Atwood, D. Coward, D. Sherden, et al., Phys. Rev. Lett. 50, 1431 (1983b).
- [4] S. Dasu, P. de Barbaro, A. Bodek, H. Harada, M. Krasny, et al., Phys. Rev. Lett. 60, 2591 (1988).
- [5] J. Ashman et al. (European Muon Collaboration), Phys. Lett. B202, 603 (1988).
- [6] P. Amaudruz et al. (New Muon Collaboration), Z. Phys. C51, 387 (1991).
- [7] J. Gomez, R. Arnold, P. E. Bosted, C. Chang, A. Katramatou, et al., Phys. Rev. D49, 4348 (1994).
- [8] J. Seely, A. Daniel, D. Gaskell, J. Arrington, N. Fomin, et al., Phys. Rev. Lett. 103, 202301 (2009), eprint 0904.4448.
- [9] D. Alde, H. Baer, T. Carey, G. Garvey, A. Klein, et al., Phys. Rev. Lett. 64, 2479 (1990).
- [10] M. Arneodo, Phys. Rept. 240, 301 (1994).
- [11] D. F. Geesaman, K. Saito, and A. W. Thomas, Ann. Rev. Nucl. Part. Sci. 45, 337 (1995).
- [12] P. Norton, Rept. Prog. Phys. 66, 1253 (2003).
- [13] L. Weinstein, E. Piasetzky, D. Higinbotham, J. Gomez, O. Hen, et al., Phys. Rev. Lett. 106, 052301 (2011), eprint 1009.5666.
- [14] L. Frankfurt, M. Strikman, D. Day, and M. Sargsian, Phys. Rev. C48, 2451 (1993).
- [15] K. Egiyan et al. (CLAS), Phys.Rev. C68, 014313 (2003), eprint nucl-ex/0301008.
- [16] N. Fomin, J. Arrington, R. Asaturyan, F. Benmokhtar, W. Boeglin, et al., Phys. Rev. Lett. 108, 092502 (2012), eprint 1107.3583.
- [17] J. Arrington, D. Higinbotham, G. Rosner, and M. Sargsian, Prog. Part. Nucl. Phys. 67, 898 (2012a), eprint 1104.1196.
- [18] O. Hen, M. Sargsian, L. Weinstein, E. Piasetzky, H. Hakobyan, et al., Science 346, 614 (2014), eprint 1412.0138.
- [19] O. Hen, E. Piasetzky, and L. Weinstein, Phys. Rev. C85, 047301 (2012), eprint 1202.3452.
- [20] O. Hen, D. Higinbotham, G. Miller, E. Piasetzky, and L. Weinstein, Int. J. Mod. Phys. E22, 1330017 (2013), eprint 1304.2813.
- [21] C. Ciofi degli Atti, L. Frankfurt, L. Kaptari, and M. Strikman, Phys. Rev. C76, 055206 (2007), eprint 0706.2937.
- [22] W. Melnitchouk, M. Sargsian, and M. Strikman, Z. Phys. A359, 99 (1997), eprint nucl-th/9609048.
- [23] J. Arrington, A. Daniel, D. Day, N. Fomin, D. Gaskell, et al., Phys. Rev. C86, 065204 (2012b), eprint 1206.6343.
- [24] S. A. Kulagin and R. Petti, Nucl. Phys. Proc. Suppl. 159, 180 (2006a), eprint hep-ph/0602090.
- [25] Y. Kahn, W. Melnitchouk, and S. A. Kulagin, Phys. Rev. C79, 035205 (2009), eprint 0809.4308.
- [26] R. Lednicky, D. Peshekhonov, and G. Smirnov, Sov. J. Nucl. Phys. 52, 552 (1990).
- [27] G. West, Phys. Lett. B37, 509 (1971).
- [28] W. Atwood and G. B. West, Phys. Rev. D7, 773 (1973).
- [29] L. Frankfurt and M. Strikman, Phys. Lett. B76, 333 (1978).
- [30] D. Kusno and M. J. Moravcsik, Nucl. Phys. B184, 283 (1981).
- [31] L. Kaptar and A. Y. Umnikov, Phys. Lett. B259, 155 (1991).
- [32] K. Nakano and S. Wong, Nucl. Phys. A530, 555 (1991).
- [33] W. Melnitchouk, A. W. Schreiber, and A. W. Thomas, Phys. Lett. B335, 11 (1994), eprint nucl-th/9407007.
- [34] M. Braun and M. Tokarev, Phys. Lett. B320, 381 (1994).
- [35] V. Burov and A. Molochkov, Nucl. Phys. A637, 31 (1998).
- [36] S. A. Kulagin and R. Petti, Nucl. Phys. A765, 126 (2006b), eprint hep-ph/0412425.
- [37] J. Arrington, J. Rubin, and W. Melnitchouk, Phys. Rev. Lett. 108, 252001 (2012c), eprint 1110.3362.
- [38] J. Arrington, F. Coester, R. Holt, and T.-S. Lee, J. Phys. G36, 025005 (2009), eprint 0805.3116.
- [39] W. Melnitchouk and A. W. Thomas, Phys. Lett. B377, 11 (1996), eprint nucl-th/9602038.
- [40] H. C. Fenker, V. Burkert, R. Ent, N. Baillie, J. Evans, et al., Nucl. Instrum. Meth. A592, 273 (2008).
- [41] N. Baillie et al. (CLAS Collaboration), Phys. Rev. Lett. 108, 199902 (2012), eprint 1110.2770.
- [42] S. Tkachenko et al. (CLAS Collaboration), Phys. Rev. C89, 045206 (2014), eprint 1402.2477.
- [43] A. Accardi, W. Melnitchouk, J. Owens, M. E. Christy, C. Keppel, et al., Phys. Rev. D84, 014008 (2011), eprint 1102.3686.
- [44] N. Kalantarians, M. E. Christy, J. Ethier, and W. Melnitchouk, private communication, publication in preparation (2015).
- [45] M. E. Christy and P. E. Bosted, Phys. Rev. C81, 055213 (2010), eprint 0712.3731.
- [46] P. Bosted and M. E. Christy, Phys. Rev. C77, 065206 (2008), eprint 0711.0159.
- [47] J. Arrington, R. Ent, C. Keppel, J. Mammei, and I. Niculescu, Phys. Rev. C73, 035205 (2006), eprint nucl-ex/0307012.
- [48] V. Guzey, L. Zhu, C. E. Keppel, M. E. Christy, D. Gaskell, et al., Phys. Rev. C86, 045201 (2012), eprint 1207.0131.
- [49] J. Owens, A. Accardi, and W. Melnitchouk, Phys. Rev. D87, 094012 (2013), eprint 1212.1702.
- [50] L. Frankfurt and M. Strikman, Phys. Rept. 160, 235 (1988).