Optical Conductivity Evidence of Clean-Limit Superconductivity in LiFeAs
Abstract
We measured the optical conductivity of superconducting LiFeAs. In the superconducting state, the formation of the condensate leads to a spectral-weight loss and yields a penetration depth of 225 nm. No sharp signature of the superconducting gap is observed. This suggests that the system is likely in the clean limit. A Drude-Lorentz parametrization of the data in the normal state reveals a quasiparticle scattering rate supportive of spin fluctuations and proximity to a quantum critical point.
pacs
74.20.Rp, 74.70.Xa, 74.25.GzI Introduction
Unlike iron-based superconductors of other families, superconductivity, rather than magnetic order, emerges in LiFeAs at zero chemical doping [1, 2]. The superconducting transition temperature is rather high ( K at ambient pressure) and the electronic structure of LiFeAs shows no signatures of good nesting [3]. Angle-resolved photoemission spectroscopy (ARPES) [3, 4], scanning tunneling spectroscopy (STM) [5], neutron-scattering [6], penetration-depth [7, 8], and thermal-conductivity [9] measurements suggest multiband superconductivity and full in-plane gaps with no indications of nodes and with either absent [6, 9, 10] or modest [3, 4, 11] gap anisotropy.
Usually, LiFeAs samples have a very large residual resistivity ratio. This is a general indication of high sample quality [12, 13, 14]. As superconductivity appears in the stoichiometric composition, the properties of LiFeAs are not influenced by doping-induced defects and impurities. The availability of LiFeAs in form of large high-quality single crystals, makes it a prime material for optical investigations.
To date, only Min et al. [10] reported on the far-infrared conductivity of LiFeAs. They described their data in the framework of multiple superconducting gaps, and found two fully open, gaps at meV and meV. These data were further analyzed in terms of Eliashberg theory [15]. STM also finds two homogeneous nodeless gaps, but with values twice as large [5].
In this paper, we study the optical properties of superconducting LiFeAs. The overall response of this material is similar to other FeAs-based superconductors. Upon entering the superconducting state, LiFeAs shows a loss of spectral weight related to the formation of the superconducting condensate with a penetration depth of 225 nm. However, contrary to Min et al. findings [10], we do not observe a clear gap signature, suggesting that the system is likely in the clean limit. The high residual-resistance ratio of our sample and the presence of quantum oscillations in samples from the same batch [16] further support this clean limit picture. In the normal state, a Drude-Lorentz decomposition of the optical conductivity leads to a scattering rate that evolves linearly with temperature, a property observed in other optimally doped pnictide superconductors and suggestive of the proximity to a quantum critical point (QCP).
II Methods
High-quality single crystals of LiFeAs were grown by a self-flux method using Li ingots and FeAs powder. The starting materials were placed in a BN crucible, and sealed in a quartz tube. The tube was heated to 1100∘C, then slowly cooled down to 600∘C. The typical linear size of the single crystals obtained was 3 to 5 mm in each direction. DC resistivity measurements, showing K, have been reported earlier [12].
Near normal incidence reflectivity from 20 to was measured on Bruker IFS113 and IFS66v spectrometers at 5, 10, 15, 20, 25, 50, 100, 200, and 300 K. The absolute reflectivity of the sample was obtained with an in situ gold overfilling technique [17]. The reflectivity has an absolute accuracy better than 0.5% and a relative accuracy better than 0.1%. The data were extended to the visible and UV ( to ) at room temperature with an AvaSpec- spectrometer.
LiFeAs is highly air sensitive. To preserve the sample, it was kept in a sealed vial in Ar atmosphere and mounted in the cryostat cold finger inside a glove box, also in Ar atmosphere. The sample was cleaved prior to each temperature run.
III Results
Figure 1 displays the ab-plane reflectivity of LiFeAs above and below . The low-frequency reflectivity increases steadily with decreasing temperature. Contrary to an s-wave BCS superconductor, there is no sharp rise of the reflectivity upon entering the superconducting state. There is also no sign of a flat 100% reflectivity at low frequencies. The sharp peak around 240(30 meV) is a polar phonon of LiFeAs.

The real part, , of the optical conductivity was derived from the reflectivity through Kramers-Kronig analysis. At low frequencies we utilized either a Hagen-Rubens () or a superconducting () extrapolation. At high frequencies we applied a constant reflectivity to 12.5 eV followed by a free-electron termination.
Figure 2 shows at various temperatures for wave numbers above 40, our limit of confidence in Kramers-Kronig obtained data. At 300 K, the optical conductivity signals an almost incoherent transport: it depicts a very broad Drude-like peak as well as a bump around 200(25 meV), which could be related to low-energy interband transitions, in particular in view of the presence of shallow bands in LiFeAs [3]. However, we cannot exclude a small surface contamination due to the fragile chemical stability of LiFeAs. We will not discuss this feature any further. When cooling down the sample, in the normal state, the Drude-like term increases and fully develops into a coherent peak. Upon crossing into the superconducting state, the low frequency optical conductivity decreases for energies below 600(75 meV). The inset of Fig. 2 shows a sum-rule analysis that is discussed in Sec. V.

IV Clean Limit Superconductivity
Looking at Fig. 2, one cannot pinpoint a clear-cut sharp energy edge characteristic of an s-wave, BCS superconducting gap. There are two main possibilities for the absence of a superconducting gap edge. The first option is a strong anisotropy in the gap, preferably with nodes. Although some anisotropy has been observed by ARPES [3, 4] and momentum-resolved tunneling spectroscopy [11], it is too small to account for a non-vanishing low-energy optical conductivity originating from unpaired quasiparticles. Indeed, virtually every measurement of the gap in LiFeAs indicates a nodeless state [3, 5, 4, 6, 7, 8, 9, 10, 11].
The second possibility is a superconductor in a clean limit, which seems to be the case for LiFeAs [9, 12, 6, 7]. As pointed out by Kamarás et al. [18], one does not see the gap in the optical conductivity of a clean superconductor. To understand this statement, let us remark that, optically speaking, the clean limit corresponds to the case where the quasiparticle scattering rate () is small compared to the superconducting gap, i.e., . In the Drude model, most of the spectral weight is comprised below . At the superconducting transition, spectral weight below is transferred to a function representing the condensate. If is larger than the spectral weight around is vanishingly small — both in the normal and superconducting states — and thus no clear signature of the gap in the optical conductivity exists. Utilizing the Drude-Lorentz model discussed further in this paper and constraining our fits to respect the temperature dependence of the resistivity, we estimate the low-temperature scattering rate to be close to 3 meV (25). Several estimates for the gap value in LiFeAs are available. The smallest value reported is 3 meV () [10]. Every other estimate and measurement fall into the range between 4 meV () and 10 meV () [6, 3, 5, 4]. This strongly supports the picture where the absence of a gap signature in the optical conductivity of LiFeAs is a clean-limit effect.
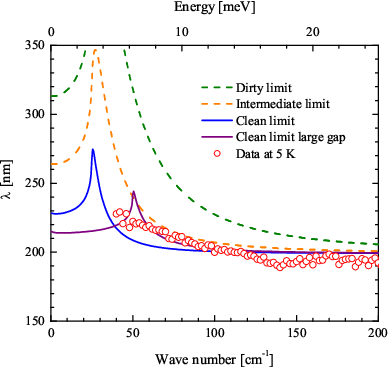
Another confirmation of the clean-limit superconductivity in LiFeAs comes from the analysis of the frequency-dependent penetration depth, , where is the vacuum permeability. For a BCS superconductor of arbitrary scattering, the measured penetration depth (as defined above) is related to the London penetration depth (, where is the free-carrier plasma frequency) in a complex way, with the mean free path being involved in the relation [19]. In terms of optical response, one can show that at frequencies above the scattering rate (but still well below ), coincides with . This is because the penetration depth at a fixed frequency is defined by the integral response of the carriers at all frequencies below this one. At high enough frequencies (above the scattering rate) the unpaired electrons screen the external field as efficiently as the superconducting currents. Note that at frequencies above the scattering rate, the unpaired electrons do not scatter. In the clean limit at , there are no unpaired electrons at all, thus the high-frequency value of the penetration depth (the London penetration depth) will span down to zero frequency. Conversely, in the dirty limit, there are some unpaired electrons even at . The response of these electrons appear in at frequencies between the gap value and the scattering rate. In this frequency range, the measured penetration depth will deviate from . The value will not be recovered at because a part of electrons remains unpaired and do not participate in the field screening [but instead contribute to ].
Figure 3 shows that, at our lowest temperature, the spectrum of is basically flat below . According to the above, this indicates that our sample is in the clean limit. For comparison, we utilized the parametrization of Zimmermann et al. [20] to calculate the frequency dependence for a BCS superconductor with different combinations of optical gap and scattering rate values. Regardless of the gap value, our data correspond to clean limit calculations.
V Sum-Rule Penetration Depth
Rather than the superconducting gap, the important optical signature of the superconducting transition is the loss of spectral weight below , related to the formation of the superfluid condensate. The inset of Fig. 2 shows the spectral weight () corresponding to an integration of the optical conductivity up to (0.5 eV), below 100 K. In the normal state, this value is constant up to 300 K, within 4%. Below , the occurrence of the superfluid condensate implies a transfer of spectral weight from finite frequencies to a function representative of the infinite DC conductivity. As the measured real part of the optical conductivity has no access to zero frequency, the value of its integral drops when the superfluid forms. The difference between the spectral weights in the normal and superconducting states leads to the penetration depth through , where is the vacuum permittivity and the subscripts in refer to the normal and superconducting states. For LiFeAs, we find nm at 5 K. This is in very close agreement to values obtained from neutron-scattering (210 nm) [6], infrared (240 nm) [10], transport (210 nm) [12], and muon spin rotation (195 nm) [21] data, as well as with our calculations from , discussed above and shown in Fig. 3.
VI Normal State Scattering
Above , shows a metallic response which can be modelled by a Drude-Lorentz optical conductivity:
| (1) |
The first term in Eq. 1 corresponds to a free-carrier Drude response, characterized by a plasma frequency () and a scattering rate (). The second term is a sum of Lorentz oscillators characterized by a resonance frequency (), a line width (), and a plasma frequency (). Figure 4 shows the result of a fit with Eq. 1 to our data at 100 K. We utilized a Drude peak (hatched red area) to describe the free carriers and 4 Lorentz terms to account for transitions in the infrared. These 5 contributions account for the optical conductivity at all temperatures above up to (0.75 eV). The scattering rate of the Drude term is the only parameter with a significant temperature dependence. Our Drude fitting parameters were constrained in order to have a temperature dependence of following the inverse DC resistivity.

Although band-structure calculations predict multiple bands at the Fermi level [22, 23], one has to consider that the optical conductivity is a reciprocal-space averaged quantity. Therefore, all bands with similar carrier lifetimes will contribute to the same Drude term in . In this perspective, Wu et al. [24] showed that two Drude terms (a narrow one with a small scattering rate and a broad one with a large scattering rate) are sufficient to describe the optical conductivity of most iron-arsenide superconductors. There are two important points to remark in this double Drude fitting: (i) most, if not all, of the temperature dependence of the spectra is related to the narrow Drude peak, in particular to its scattering rate; and (ii), the large scattering rate Drude term systematically leads to a mean free path comparable to the lattice parameter. Therefore, the broad Drude term is representative of an incoherent conductivity, probably with bound carriers. In this case, it can be substituted by a Lorentz oscillator with the proper spectral weight. We chose a low-energy Lorentz approach for our fit. This choice is substantiated by the fact that, had we utilized a broad Drude term in our fits, its scattering rate would be around (0.3 eV). Taking a Fermi velocity of eVÅ [25], one would find a mean free path in the range of 1 Å, which is obviously smaller than the unit cell size. Looking at mobility values reported for LiFeAs [12], one can safely assume that the narrow, coherent, Drude peak is representative of the electron bands.
A multiband analysis of transport data by Rullier-Albenque et al. [14], proposes a quadratic temperature dependence for the electron and hole scattering rates in LiFeAs. Their coefficients are very large, suggestive of strong spin fluctuations. The inset of Fig. 4 shows the temperature dependence of the Drude scattering rate, obtained by fitting the data in the normal state with Eq. 1. We do not have enough temperatures to make a strong claim, but our data seem to be better described by a linear temperature dependence (dashed line), a trend that is also compatible with spin fluctuations. Interestingly, the actual resistivity of LiFeAs (solid line) shows neither a linear, nor a quadratic temperature evolution of . This fact is related to the multiband character of pnictides. Electron-like and hole-like transport properties vary differently with temperature. At low temperatures electron carriers have a dominating role whereas a crossover regime appears at higher temperatures where electrons and holes have similar mobilities. This seems to be a common trend in optimally doped FeAs-based superconductors [26].
The multiband character of the transport properties, both DC and optical, suggests a material with strong spin fluctuations associated with a competition between magnetism and superconductivity and a possible existence of a quantum critical point. The ground state of (nominally) undoped LiFeAs is a superconductor with no long-range magnetic order. This suggests that spin fluctuations are not important in this material. Indeed, Borisenko et al. [3] interpreted their ARPES data in the framework of no static or fluctuating magnetic order. This observation would be at odds with the spin-fluctuations driven superconductivity leading to an order parameter proposed for iron pnictides in general [27, 28], and for LiFeAs in particular [4]. However, a different picture emerges from NMR experiments. Ma et al. [29] showed that small deviations from stoichiometry can tune LiFeAs from a material with spin fluctuations to a system with a spin-density-wave QCP. They assign these deviations to the easiness of reversibly intercalating lithium in interstitial sites. This QCP gets further support from the linear temperature dependence of the scattering rate shown in Fig. 4.
VII Summary
In summary, our optical results show a consistent picture of clean-limit superconductivity in LiFeAs. In the normal state LiFeAs shows an optical conductivity dominated by a narrow Drude-like peak with a strong temperature dependence. When crossing into the superconducting state, this Drude-like peak shows a gradual decrease in its spectral weight, characteristic of a superfluid condensate. From the lost spectral weight, we calculate a penetration depth of 225 nm at 5 K. We did not observe any sharp edge in the spectra, indicating that no superconducting gap signature is observed in the infrared. We conclude that this is a consequence of the system being in the clean limit, a property further confirmed by our detailed analysis of the frequency dependent penetration depth. The normal-state optical conductivity can be parameterized by a Drude-Lorentz dielectric function. We find that all parameters in the Drude-Lorentz model are temperature independent, except for the scattering rate of a coherent Drude peak, representative of quasiparticles on the electron Fermi sheets. A multiband analysis of the scattering rate indicates a non-Fermi-liquid behavior. The linear behavior observed for the scattering rate is compatible with spin fluctuations and supports the presence of a quantum critical point.
Acknowledgements.
Part of this work was supported by HLD at HZDR, member of the European Magnetic Field Laboratory (EMFL).References
- [1] X. C. Wang, Q. Q. Liu, Y. X. Lv, W. B. Gao, L. X. Yang, R. C. Yu, F. Y. Li, and C. Q. Jin, Solid State Commun. 148, 538 (2008).
- [2] J. H. Tapp, Z. Tang, B. Lv, K. Sasma, B. Lorenz, P. C. W. Chu, and A. M. Guloy, Phys. Rev. B 78, 060505(R) (2008).
- [3] S. V. Borisenko, V. B. Zabolotnyy, D. V. Evtushinsky, T. K. Kim, I. V. Morozov, A. N. Yaresko, A. A. Kordyuk, G. Behr, A. Vasiliev, R. Follath, et al., Phys. Rev. Lett. 105, 067002 (2010).
- [4] K. Umezawa, Y. Li, H. Miao, K. Nakayama, Z.-H. Liu, P. Richard, T. Sato, J. B. He, D.-M. Wang, G. F. Chen, et al., Phys. Rev. Lett. 108, 037002 (2012).
- [5] S. Chi, S. Grothe, R. Liang, P. Dosanjh, W. N. Hardy, S. A. Burke, D. A. Bonn, and Y. Pennec, Phys. Rev. Lett. 109, 087002 (2012).
- [6] D. S. Inosov, J. S. White, D. V. Evtushinsky, I. V. Morozov, A. Cameron, U. Stockert, V. B. Zabolotnyy, T. K. Kim, A. A. Kordyuk, S. V. Borisenko, et al., Phys. Rev. Lett. 104, 187001 (2010).
- [7] H. Kim, M. A. Tanatar, Y. J. Song, Y. S. Kwon, and R. Prozorov, Phys. Rev. B 83, 100502(R) (2011).
- [8] K. Hashimoto, S. Kasahara, R. Katsumata, Y. Mizukami, M. Yamashita, H. Ikeda, T. Terashima, A. Carrington, Y. Matsuda, and T. Shibauchi, Phys. Rev. Lett. 108, 047003 (2012).
- [9] M. A. Tanatar, J.-P. Reid, S. R. de Cotret, N. Doiron-Leyraud, F. Laliberté, E. Hassinger, J. Chang, H. Kim, K. Cho, Y. J. Song, et al., Phys. Rev. B 84, 054507 (2011).
- [10] B. H. Min, J. B. Hong, J. H. Yun, T. Iizuka, S. Kimura, Y. Bang, and Y. S. Kwon, New J. Phys. 15, 073029 (2013).
- [11] M. P. Allan, A. W. Rost, A. P. Mackenzie, Y. Xie, J. C. Davis, K. Kihou, C. H. Lee, A. Iyo, H. Eisaki, and T.-M. Chuang, Science 336, 563 (2012).
- [12] S. Kasahara, K. Hashimoto, H. Ikeda, T. Terashima, Y. Matsuda, and T. Shibauchi, Phys. Rev. B 85, 060503 (2012).
- [13] O. Heyer, T. Lorenz, V. B. Zabolotnyy, D. V. Evtushinsky, S. V. Borisenko, I. Morozov, L. Harnagea, S. Wurmehl, C. Hess, and B. Büchner, Phys. Rev. B 84, 064512 (2011).
- [14] F. Rullier-Albenque, D. Colson, A. Forget, and H. Alloul, Phys. Rev. Lett. 109, 187005 (2012).
- [15] J. Hwang, J. P. Carbotte, B. H. Min, Y. S. Kwon, and T. Timusk, J. Phys.: Condens. Matter 27, 055071 (2015).
- [16] C. Putzke, A. I. Coldea, I. Guillamón, D. Vignolles, A. McCollam, D. LeBoeuf, M. D. Watson, I. I. Mazin, S. Kasahara, T. Terashima, et al., Phys. Rev. Lett. 108, 047002 (2012).
- [17] C. C. Homes, M. Reedyk, D. A. Cradles, and T. Timusk, Appl. Optics 32, 2976 (1993).
- [18] K. Kamarás, S. L. Herr, C. D. Porter, N. Tache, D. B. Tanner, S. Etemad, T. Venkatesan, E. Chase, A. Inam, X. D. Wu, et al., Phys. Rev. Lett. 64, 84 (1990).
- [19] P. B. Miller, Phys. Rev. 113, 1209 (1959).
- [20] W. Zimmermann, E. H. Brandt, M. Bauer, E. Seider, and L. Genzel, Physica C 183, 99 (1991).
- [21] F. L. Pratt, P. J. Baker, S. J. Blundell, T. Lancaster, H. J. Lewtas, P. Adamson, M. J. Pitcher, D. R. Parker, and S. J. Clarke, Phys. Rev. B 79,, 052508 (2009).
- [22] I. A. Nekrasov, Z. V. Pchelkina, and M. V. Sadovskii, JETP Letters 88, 543 (2008).
- [23] D. J. Singh, Phys. Rev. B 78, 094511 (2008).
- [24] D. Wu, N. Barišić, P. Kallina, A. Faridian, B. Gorshunov, N. Drichko, L. J. Li, X. Lin, G. H. Cao, Z. A. Xu, et al., Phys. Rev. B 81, 100512 (2010).
- [25] H. Ding, K. Nakayama, P. Richard, S. Souma, T. Sato, T. Takahashi, M. Neupane, Y. M. Xu, Z. H. Pan, A. V. Fedorov, et al., J. Phys.: Condens. Matter 23, 135701 (2011).
- [26] Y. M. Dai, B. Xu, B. Shen, H. Xiao, H. H. Wen, X. G. Qiu, C. C. Homes, and R. P. S. M. Lobo, Phys. Rev. Lett. 111 (2013).
- [27] I. I. Mazin, D. J. Singh, M. D. Johannes, and M. H. Du, Phys. Rev. Lett. 101, 057003 (2008).
- [28] V. Cvetkovic and Z. Tesanovic, EPL 85, 37002 (2009).
- [29] L. Ma, J. Zhang, G. F. Chen, and W. Yu, Phys. Rev. B 82, 180501 (2010).