The origin of anomalous diffusion in iron mononitride thin films
Abstract
We have studied the origin of a counter intuitive diffusion behavior of Fe and N atoms in a iron mononitride (FeN) thin film. It was observed that in-spite of a larger atomic size, Fe tend to diffuse more rapidly than smaller N atoms. This only happens in the N-rich region of Fe-N phase diagram, in the N-poor regions, N diffusion coefficient is orders of magnitude larger than Fe. Detailed self-diffusion measurements performed in FeN thin films reveal that the diffusion mechanism of Fe and N is different - Fe atoms diffuse through a complex process, which in addition to a volume diffusion, pre-dominantly controlled by a fast grain boundary diffusion. On the other hand N atoms diffuse through a classical volume-type diffusion process. Observed results have been explained in terms of stronger Fe-N (than Fe-Fe) bonds generally predicted theoretically for mononitride compositions of transition metals.
I Introduction
Transition metal nitrides (TMN), specially 3 TM mononitrides (TMMN) are an important class of materials exhibiting several interesting properties such as superhardness [1, 2, 3, 4], superconductivity [5], corrosion and wear resistance [6, 7], etc. Along the 3 series, there is a characteristic variation in the heat of formation () for the 3 TMMN - an initial increases to a maximum is followed by a decrease and a plateau in . [8] This inherently makes formation of early 3 TMMN viz. ScN, TiN, VN, CrN easier than that of late ones viz. MnN, FeN, CoN, NiN; e.g. =- 338 kJmol-1 for TiN and - 47 kJmol-1 for FeN at 298 K. As a result, mononitrides of Ti,V,Cr can be easily prepared and possess excellent thermal stability due to which they have been intensely investigated. [12, 13, 9, 10, 11] On the other hand, magnetic mononitrides (e.g. MnN,FeN, CoN) started to gain attention rather recently. [16, 14, 15, 17, 18, 19, 20, 21] Unlike early 3 TMMN, FeN or CoN can only be formed in the form of thin films using non-equilibrium processes such as reactive sputtering [22, 15, 14, 23], pulsed laser deposition [24], and more recently by molecular beam epitaxy assisted with a rf-discharge nitrogen/ammonia source. [25, 19] Nickel mononitrides are yet to be evidenced experimentally. [26, 27] On the basis of energetics of mononitrides, FeN and CoN are expected to be metastable.
The metastable nature of FeN turned out to be a boon as FeN films were exploited as a source of spin-injection to semiconductors or diluted magnetic semiconductor in spintronics. [28] FeN when heated above 650 K yields a thermally stable giving rise to an array of lithographically defined spin-valves. [28] The mechanism leading to such structural transformation was assumed to be controlled by N-diffusion. XPS measurements for Fe 2 and N 1 peaks were used to measure N diffusion in Fe. [29] However, the conclusion drawn from such measurements that fast N diffusion leads to such transformations can be misleading since interdiffusion of N in Fe, self-diffusion of N was measured.
Recent Fe and N self-diffusion measurements performed using neutron reflectivity (NR) show that N self-diffusion is slower than Fe. [15] This is a counter-intuitive result, defying established diffusion models for binary metal-metalloid systems where a smaller atom always diffuses faster than a larger atom. [30] In absence of a suitable radioactive tracer, N self-diffusion is rather difficult to measure. [9, 31] Nevertheless by using 15N labelling, it can be obtained by doing depth-profile measurements using secondary ion mass spectroscopy (SIMS) [33, 32], nuclear reaction analysis (NRA) [9] and NR. Among these, later provides an unique opportunity to measure self-diffusion lengths down to 0.1 nm and a possibility to measure N self-diffusion in the low temperature regime (below 500 K). [34, 15]
In the present work, we have carried out a study of Fe and N self-diffusion process to understand the origin of anomalous diffusion in non-magnetic FeN compound. Thin film samples were prepared using nitrogen alone as a sputtering gas in a reactive magnetron sputtering process. X-ray diffraction, absorption and Mössbauer spectroscopy measurements confirmed ZnS-type structure of samples. NR measurements show that N diffusion is slower than Fe, however detailed diffusion mechanism was obtained from SIMS depth profiles using Le Claire’s analysis [35, 36] for grain-boundary () diffusion. It was found that in the low temperatures regime (up to 550 K) fast Fe diffusion takes place predominantly through the regions while N diffusion is a conventional volume type diffusion. As the temperature is increased beyond it, the difference between Fe and N diffusion decreases leading to structural transformations - essentially triggered by Fe diffusion and followed by N diffusion to the extent that N diffuses out of the system. This is an important result defying a general misconception the fast N diffusion leads to structural instability and can be applied to understand the thermal stability of transition metal mononitrides.
II Experimental
In a direct current-magnetron sputtering (dc-MS) technique an iron
target (purity 99.95%) was sputtered using nitrogen (purity
99.9995%) alone as the sputtering medium at a constant power of
100 W. N2 gas was flown at a constant flow of 10 sccm
yielding a pressure of about 0.4 Pa, while the pressure before
gas flow was about 110-5 Pa. Fe target was
pre-sputtered for 10 minutes using Ar gas to remove surface
contaminations. Following samples were prepared at ambient
temperature on Si(100) and float glass substrates:
(N1): [FeN(7.5 nm)FeN(7.5 nm)]×10
(N2): [FeN(7.5 nm)Fe15N(7.5 nm)]×10
(S): [FeN(100 nm)Fe15N(2 nm)FeN(100 nm)]
Samples (N1) and (N2) were used to measure Fe and N self-diffusion using NR, sample (S) was used to measure Fe and N self-diffusion simultaneously using SIMS. Natural Fe and 57Fe (95% enriched) targets were sputtered using natural nitrogen and 15N (98% enriched) gases. To avoid any mixing of nitrogen isotope gases, chamber was evacuated after deposition of each layer and gas flows were monitored using a residual gas analyzer (RGA).
The long-range structure transformation in the samples were studied using x-ray diffraction (XRD) using a standard diffractometer (Bruker D8Advance) equipped with Cu K- x-ray source and a silicon stripe detector (Lynxeye). The local structure was investigated using x-ray absorption spectroscopy (XAS) and conversion electron Mössbauer spectroscopy (CEMS). The XAS measurements at Fe K-edge were performed at BL-9 beamline [37] and those at N K-edge at BL-1 beamline [38], both at Indus-2 synchrotron radiation source at Indore. While Fe K-edge measurements were carried out in fluorescence mode, those at N K-edge were measured in total electron yield mode. To study the phase transformation, samples were annealed using a vacuum furnace for about two hours at each temperatures. NR measurements were performed at AMOR reflectometer at SINQ/PSI, Villigen, Switzerland. SIMS measurements were carried out on a Hiden Analytical SIMS Workstation using O as primary with 5 keV energy and 400 nA beam current. The base pressure in SIMS measurement chamber was 1 Pa and during measurement pressure was of the order of 1 Pa due to differentially pumping of oxygen gas source.
III Results and discussion
III.1 Structural measurements

Figure 1(a) shows XRD patterns of sample (N1) in the as-deposited state and after annealing at various temperatures. In the as-deposited state, a single broad peak appears around 2=56 degree. From CEMS and XAS measurements (shown later), it was confirmed that the formed phase is -FeN having ZnS-type structure oriented along (220) plane. [17, 14] After annealing at 475 K, a shift in the peak position towards higher angle was observed. However, the XRD pattern of sample annealed at 525 K is almost identical to that of previously annealed sample. Such shift in the peak position is an indication of annihilation of free volume leading to densification of the structure. [39, 40] It is interesting to note that the average crystallite size () (calculated using Scherrer formula [41]) remains at a value of about nm upto an annealing temperature of 525 K. At a higher temperature of 575 K, additional peaks corresponding to (0z1) start to appear. With further increasing annealing temperatures, growth of phase can be seen. Along with it a continuous shift of peaks position towards higher 2 values were observed indicating ‘’.
Figure 1(b) shows CEMS spectra for sample (N1) in the as-deposited state and after annealing. Obtained CEMS spectra were fitted using a computer program NORMOS/SITE [42] and fitted parameters are given in table 1. As-deposited and the sample annealed at 525 K shows an asymmetric doublet which is typically observed for -FeN in ZnS-type structure. Such spectra can be de-convoluted into two singlets: one with a smaller and other with a larger value of isomer shift (). The singlet with =0.01 mm/s corresponds to Fe surrounded tetrahedrally to N, while other singlet originates due to defects and vacancies. [43, 17, 14] Annealing above 575 K results in appreciable changes in CEMS spectrum, at this temperature it can be best fitted using mixture of two singlets and two quadrupole split doublets corresponding to and phase, respectively. Obtained fitting parameters match-well with the reported values. [43, 22] It is known that phase exist in a wide composition range in which its magnetic properties also get tuned with nitrogen concentration. [44] It was observed that, at room temperature, as ‘1’ phase becomes non-magnetic, whereas as ‘0’ it becomes ferromagnetic. Appearance of sextet confirms ferromagnetic ordering which is also supported by XRD results indicating ‘0’ in . Obtained fitting parameters (table 1) for CEMS spectra measured above 575 K match-well with the reported values. [44]
| T | Component | RA | |||
| (K) | (mm/s) | (mm/s) | (Tesla) | (%) | |
| 300 | S1 | 0.10 | – | – | 54 |
| S2 | 0.57 | – | – | 46 | |
| 525 | S1 | 0.11 | – | – | 57 |
| S2 | 0.60 | – | – | 43 | |
| 575 | S1 | 0.11 | – | – | 40 |
| S2 | 0.60 | – | – | 34 | |
| Q1 | 0.46 | 0.31 | – | 23 | |
| Q2 | 0.30 | 0.50 | – | 3 | |
| 625 | H1 | 0.38 | 0.0 | 8.7 | 13 |
| H2 | 0.31 | 0.0 | 17.4 | 17 | |
| H3 | 0.33 | 0.65 | – | 70 | |
| 675 | H1 | 0.40 | 0.0 | 7.6 | 22 |
| H2 | 0.31 | 0.0 | 21.7 | 68 | |
| H3 | 0.30 | 0.0 | 3.6 | 10 |
To get precise information about the local structure of Fe and N, XAS measurements at Fe and N K-edge were performed on sample (N1) and are shown in figure 2. A strong pre-edge peak around 7113 eV can be seen before Fe K-edge. This is a signature of quadrupole transition and its probability strongly depends on the direction of the local electric field, which in turns gets influenced by local site symmetry. [45] For such a pre-edge peak to appear, inversion symmetry must be broken (transition from a bound core level to a higher level empty state). This is only possible when Fe is surrounded tetrahedrally to N atoms because this arrangement is asymmetric under inversion. [45] This clearly indicates ZnS-type structure (tetrahedral coordination of Fe atoms) in our samples. Such pre-edge feature has been frequently used to assign tetrahedral or octahedral coordination in transition metal complexes such as Mn [46], Cr [47], etc. To further confirm this result, XAS spectra was also taken at N K-edge (shown in the inset of figure 2). Apart from edge feature ‘’ at 401 eV, three features that are assigned as (, and ), are observed due to the electronic transition to empty N-2p state hybridized to Fe-3d state. [17] Various TMMN (viz. Ti, Cr, V) having NaCl type structure, the feature ‘’ splits into two components due to crystal field splitting caused by the octahedral coordination of N atoms surrounding the metal ions. [48, 49] Absence of any splitting around the feature ‘’ is a clear indication of tetrahedral coordination of Fe surrounding N atoms. Less intense features () and () observed in the spectra are due to surface oxidation state. [17] Combining the information obtained from XAS measurements, it can be confirmed that FeN phase has a ZnS-type structure. This is also in agreement with low temperature high field Mössbauer spectroscopy measurements in this compound. [14]

III.2 Self-diffusion measurements
NR is a precise tool to measure atomic self-diffusion and diffusivity as low as 110 have been measured using this technique. [50, 51, 52, 34, 32] It is known that neutron scattering length () varies for isotopes for naturalFe, 57Fe, naturalN, and 15N =9.45 fm, 2.3 fm, 9.36 fm and 6.6 fm, respectively. Therefore, periodic isotope multilayer are widely used to study atomic self-diffusion using NR. [50, 51, 52, 34, 32, 15] Figure 3 (a) and (b) shows NR patterns for samples (N1) and (N2), respectively. Bragg peaks appearing due to isotopic contrast of natFe/57Fe and natN/15N can be seen clearly. Patterns were fitted using a computer program based on Parratt formulism [53, 54] and obtained layer thickness for sample (N1) is 7.9 nm, (N2) is 7.3 nm, close to nominal values.

After annealing the intensity of Bragg peak start to decay and such decay is more rapid for sample (N1) than for (N2). A decay of Bragg peak intensity is a measure of atomic diffusion across interfaces. Obtained results clearly indicate that Fe self-diffusion is faster than N. Detailed fitting of NR data yields diffusion length(Ld), which are plotted in the inset of figure 3(b). Clearly, Ld is significantly larger for Fe than for N. This result, although counter intuitive, agrees well with previous studies on -FeN compound. [15] To get further insight leading to such anomalous behavior, we did detailed SIMS measurements on sample (S). With SIMS, unlike NR, both Fe and N self-diffusion can be measured simultaneously.


Figure 4 shows SIMS depth-profile in sample (S) for 57Fe(a) and 15N(b), isochronally annealed for 1 hr at each temperature. As annealing temperature is increased, the width of 57Fe profiles become broader than those of 15N, indicating faster Fe self-diffusion than N, in agreement with NR results. For such SIMS depth-profiles, concentration profile of an element at a depth can be fitted using a Gaussian distribution function to obtain volume diffusivity() using [55]:
| (1) |
Here is annealing time at a temperature . Alternatively, a linear relation between and , yields slope of the fitted line, given by: slope=. Obtained N diffusivities are shown in 6(c). While 15N profiles fits well to this equation, 57Fe profiles cannot be fitted using equation 1 alone, specially above 475 K. As shown more clearly in figure 5, 15N profiles have single slope, 57Fe profiles have two distinct slopes. Fe diffusivity upto 475 K can be obtained using equation 1, above it, the additional slope can be fitted using Le Claire’s analysis [35] for diffusion. An skewness in 57Fe depth-profiles above 475 K (marked by an arrow in figure 4(a)) is an indication of competing diffusion processes taking place through grain-boundaries in addition to a volume type diffusion. [36, 56] Since , it can be assumed that fast Fe diffusion observed in our samples is primarily diffusion. In this case, can be obtained from the slope of ‘ln’ versus ‘’ curve, using Suzuoka’s instantaneous-source solution equation [57, 36]:
| (2) |
Here, is segregation factor, is width of . As such experimental estimation of is difficult, a good approximation is 0.5 nm, as often found in literature. [58] Eq. 2 is applicable for the condition in which a dimensionless quantity , has values between 10 and 100. Since in our case we find at 500 K, equation 2 can be applied to calculate . Inset of the figure 5(a) shows a linear fit to a curve plotted between ‘ln’ and ’ after annealing at 525 K. Similar analysis was carried out at other annealing temperatures and obtained values of and are shown figure 6 (a) and (b), respectively.
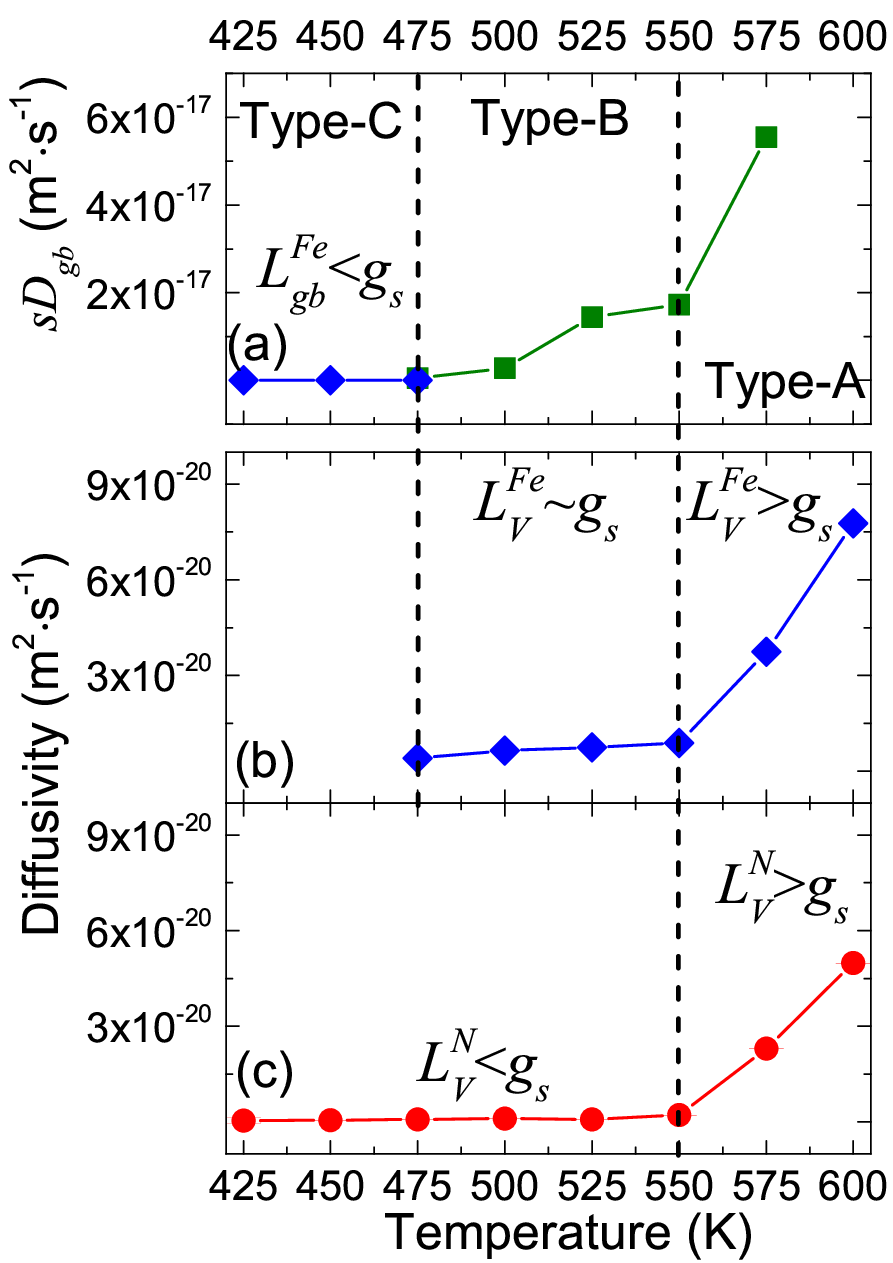
Grain-boundary diffusion is a complex process in which several competing processes may take place simultaneously. [56] However for a given temperature range and duration, only few of them may get activated. Thus different kinetic regimes of have been observed, ascribed by Harrison. [59, 36] According to this classification, has three regimes known as type-A, B, and C. These regimes can be differentiated according to a relation between penetration depth (), volume penetration depth () and grain size (). [60] For type-C regime , for type-B regime , and for type-A regime [60]. Using these inequalities, obtained values and can be divided into distinct kinetic regimes as shown in figure 6. We find that for Fe diffusion, (2 nm, 5 nm) for T475 K; for 475 KT550 K, and for T550 K corresponding to type-C, B and A kinetics, respectively.
On the other hand for N diffusion, we find below 550 K and above it . This indicates N diffusion is taking place within a grain below 550 K and as temperature is raised beyond it, multi-grain N diffusion takes over. It appears that Fe and N diffusion mechanism is significantly different. While only takes place for N, Fe diffusion process seems to be more complex having distinct kinetic regimes C, B and A as annealing temperature increases. It is known that in type-C regime, diffusion takes place pre-dominantly through grain-boundaries leading to segregating of Fe atoms in the region. In type-B regime, in addition to diffusion, starts. Though it is not too effective to cause any structural or magnetic transformation in this case. Finally above 550 K, of both Fe and N becomes comparable. Observed diffusion behavior gives a direct correlation between Fe and N self-diffusion with phase transformation. This is contrary to general preassumption that only N diffusion leads to phase transformation.
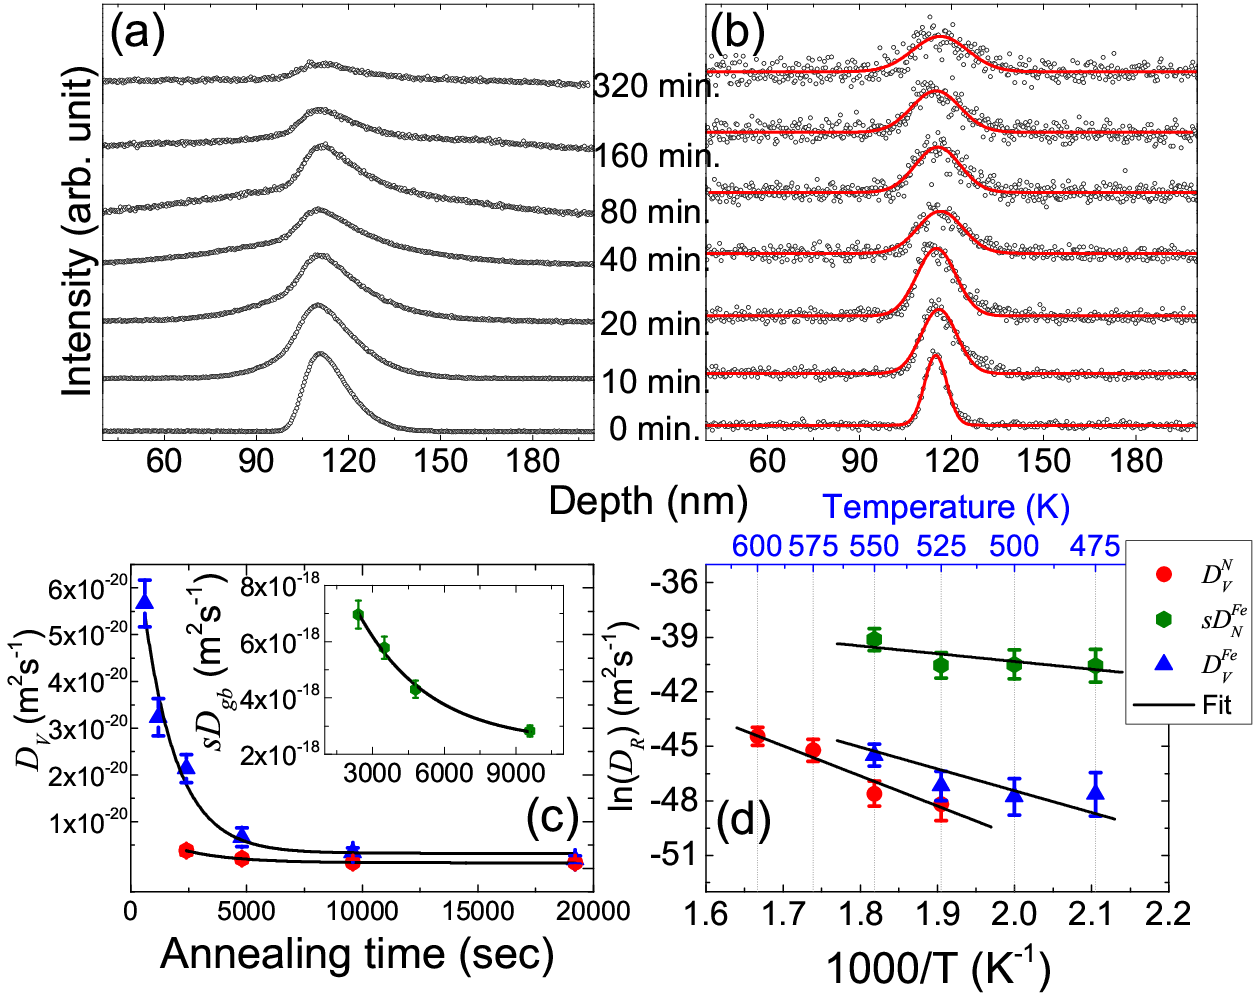
Since isochronal diffusion measurements only give a snap shot of diffusion process, more insight about involved diffusion mechanism was obtained by doing detailed isothermal diffusion measurements between 475-550 K (for Fe) and 525-600 K (for N) in the steps of 25 K for different annealing times. Representative SIMS depth-profiles taken at 525 K after various annealing times are shown in figure 7 for Fe (a) and N (b). Following a similar process DV and Dgb was calculated and shown in figure 7(c). Time-dependent diffusivity data can be fitted using:
| (3) |
Where, is diffusivity in relaxed state, a constant, annealing time, and is relaxation time. Using 3 we get =1445(300)s, and 2192(300)s, respectively for Fe and N ; while for Fe Dgb, =2986(300)s. Much longer values of for diffusion indicate that it remain active for a longer time due to availability of large volume of . Obtained values of follows Arrhenius behavior given by:
| (4) |
Here, denotes pre-exponential factor, activation energy, temperature and Boltzmann’s constant. The obtained values of for of Fe and N are 1.00.2 eV and 1.40.2 eV, respectively while for Fe it is 0.60.2 eV. As expected, smaller value of for the diffusion signifies that it starts at a relatively lower temperature as compared to . Interestingly, we observe a slightly higher value of the activation energy for of N as compared to Fe (also for N was larger than Fe). Observed discrepancy within of Fe and N can be understood due to a stronger metal-nitrogen (than metal-metal) interaction predicted theoretically for TMMN [8, 61]. Unlike oxides, TMN are stabilized by a dominant metal-metal interaction and therefore metal-metal bonds are stronger. However mononitride having ZnS-type or NaCl-type structure, a volume expansion of lattice takes place to accommodate N atoms in the interstitial positions. Early theoretical calculations predicted that the interaction distances are larger and bond energies are significantly smaller for metal-metal bonds as compared to metal-nitrogen bonds for 3 TMMN. [62] More recent band structure calculations based of density-functional theory, observed localization of metal valance bonds leading to weakened metal-metal bonding in mononitrides. [61] In additions a suppression in N migration vacancy was predicted for slightly off-stoichiometry mononitrides of various TMN. [12, 13] From these theoretical studies it can be inferred that metal-metal bonds are readily broken. This situation may lead to segregation of Fe atoms in the region, leading to faster Fe diffusion as compared to N diffusion, under identical thermodynamic conditions.
IV Conclusion
Iron mononitride thin films studied in this work, show an anomalous self-diffusion behavior in which N atoms tend to diffuse slower than Fe atoms. SIMS depth-profile measurements reveal that the diffusion mechanism for Fe and N is different. While N diffuses only via a volume-type diffusion process, Fe in addition to volume, pre-dominantly diffuses through grain-boundaries. Fe grain-boundary diffusion was about two orders of magnitude more than its volume diffusion. Even for volume diffusion, N diffusion was found to be less than Fe. This can be understood in terms of stronger metal-nitrogen bonds (than metal-metal) predicted theoretically for transition metal mononitrides, evidenced experimentally in this work.
Acknowledgments
A part of this work was performed at AMOR, Swiss Spallation Neutron Source, Paul Scherrer Institute, Villigen, Switzerland. We acknowledge D. M. Phase, D. K. Shukla, R. Sah and S. Karwal for utilization of BL1 beamline and S. N. Jha, D. Bhattachrya for BL9 beamline. We are thankful to V. R. Reddy and A. Gome for CEMS measurements; M. Horisberger for sample preparation; L. Behra for XRD and SIMS measurements. We are thankful to A. K. Sinha and V. Ganesan for support and encouragement. A.T. is thankful to CSIR India for a research fellowship.
References
- [1] S. Vepřek, Journal of Vacuum Science and Technology A 17 (1999)
- [2] S.-H. Jhi, S. G. Louie, M. L. Cohen, and J. Ihm, Phys. Rev. Lett. 86, 3348 (Apr 2001), http://link.aps.org/doi/10.1103/PhysRevLett.86.3348
- [3] S.-H. Jhi, J. Ihm, S. G. Louie, and M. L. Cohen, Nature 399, 132 (1999)
- [4] S. Hao, B. Delley, S. Veprek, and C. Stampfl, Phys. Rev. Lett. 97, 086102 (Aug 2006), http://link.aps.org/doi/10.1103/PhysRevLett.97.086102
- [5] S. Yamanaka, K.-i. Hotehama, and H. Kawaji, Nature 392, 580 (1998)
- [6] P. Steneteg, O. Hellman, O. Y. Vekilova, N. Shulumba, F. Tasnádi, and I. A. Abrikosov, Phys. Rev. B 87, 094114 (Mar 2013), http://link.aps.org/doi/10.1103/PhysRevB.87.094114
- [7] W. D. Sproul, Science 273, 889 (1996), http://www.sciencemag.org/content/273/5277/889.full.pdf, http://www.sciencemag.org/content/273/5277/889.abstract
- [8] J. Häglund, A. Fernández Guillermet, G. Grimvall, and M. Körling, Phys. Rev. B 48, 11685 (Oct 1993), http://link.aps.org/doi/10.1103/PhysRevB.48.11685
- [9] L. Hultman, Vacuum 57, 1 (2000), ISSN 0042-207X, http://www.sciencedirect.com/science/article/pii/S0042207X00001433
- [10] S. Zhang, D. Sun, Y. Fu, and H. Du, Surface and Coatings Technology 167, 113 (2003), ISSN 0257-8972, proceedings of the Symposium on Technological Advances and Performance of Engineering Thin Films and Surface Coatings at the 1st International Conference on Materials Processing for Properties and Performance (MP3), http://www.sciencedirect.com/science/article/pii/S0257897202009039
- [11] I. Milošev, H.-H. Strehblow, and B. Navinšek, Thin Solid Films 303, 246 (1997), ISSN 0040-6090, http://www.sciencedirect.com/science/article/pii/S0040609097000692
- [12] L. Tsetseris, N. Kalfagiannis, S. Logothetidis, and S. T. Pantelides, Phys. Rev. B 76, 224107 (Dec 2007), http://link.aps.org/doi/10.1103/PhysRevB.76.224107
- [13] L. Tsetseris, N. Kalfagiannis, S. Logothetidis, and S. T. Pantelides, Phys. Rev. Lett. 99, 125503 (Sep 2007), http://link.aps.org/doi/10.1103/PhysRevLett.99.125503
- [14] M. Gupta, A. Tayal, A. Gupta, V. Reddy, M. Horisberger, and J. Stahn, J. Alloys and Compounds 509, 8283 (2011), ISSN 0925-8388, http://www.sciencedirect.com/science/article/pii/S0925838811010206
- [15] M. Gupta, A. Tayal, A. Gupta, R. Gupta, J. Stahn, M. Horisberger, and A. Wildes, J. Appl. Phys. 110, 123518 (2011)
- [16] A. Houari, S. F. Matar, M. A. Belkhir, and M. Nakhl, Phys. Rev. B 75, 064420 (Feb 2007), http://link.aps.org/doi/10.1103/PhysRevB.75.064420
- [17] I. Jouanny, P. Weisbecker, V. Demange, M. Grafouté, O. Peña, and E. Bauer-Grosse, Thin Solid Films 518, 1883 (2010)
- [18] X. Liu, H. Lu, M. He, K. Jin, G. Yang, H. Ni, and K. Zhao, Journal of Alloys and Compounds 582, 75 (2014), ISSN 0925-8388, http://www.sciencedirect.com/science/article/pii/S092583881301846X
- [19] C. Navío, J. Alvarez, M. J. Capitan, F. Yndurain, and R. Miranda, Phys. Rev. B 78, 155417 (2008)
- [20] X. Wang, H. Jia, W. Zheng, Y. Chen, and S. Feng, Thin Solid Films 517, 4419 (2009), ISSN 0040-6090, http://www.sciencedirect.com/science/article/pii/S0040609009006695
- [21] S. Bhattacharyya, The Journal of Physical Chemistry C 119, 1601 (2015), http://dx.doi.org/10.1021/jp510606z, http://dx.doi.org/10.1021/jp510606z
- [22] P. Schaaf, Prog. Mater. Sci. 47, 1 (2002)
- [23] J.-S. Fang, L.-C. Yang, C.-S. Hsu, G.-S. Chen, Y.-W. Lin, and G.-S. Chen, Journal of Vacuum Science & Technology A 22 (2004)
- [24] M. Gupta, A. Gupta, P. Bhattacharya, P. Misra, and L. Kukreja, J. Alloys and Compounds 326, 265 (2001), http://www.sciencedirect.com/science/article/pii/S0925838801013160
- [25] M. Naito, K. Uehara, R. Takeda, Y. Taniyasu, and H. Yamamoto, Journal of Crystal Growth 415, 36 (2015), ISSN 0022-0248, http://www.sciencedirect.com/science/article/pii/S0022024814008379
- [26] D. Vempaire, F. Fettar, L. Ortega, F. Pierre, S. Miraglia, A. Sulpice, J. Pelletier, E. K. Hlil, and D. Fruchart, Journal of Applied Physics 106, 073911 (2009), http://scitation.aip.org/content/aip/journal/jap/106/7/10.1063/1.3238290
- [27] H. Nishihara, K. Suzuki, R. Umetsu, T. Kanomata, T. Kaneko, M. Zhou, M. Tsujikawa, M. Shirai, T. Sakon, T. Wada, K. Terashima, and S. Imada, Physica B: Condensed Matter 449, 85 (2014), ISSN 0921-4526, http://www.sciencedirect.com/science/article/pii/S0921452614003998
- [28] C. Navío, J. Alvarez, M. J. Capitan, J. Camarero, and R. Miranda, Appl. Phys. Lett. 94, 263112 (2009)
- [29] C. Navío, M. J. Capitán, J. Álvarez, R. Miranda, and F. Yndurain, New J. Phys. 12, 073004 (2010)
- [30] F. Faupel, W. Frank, M. P. Macht, H. Mehrer, K. Rätzke, H. Schober, S. K. Sharma, and H. Teichler, Rev. Mod. Phys. 75, 237 (2003)
- [31] H. Matzke, in Defect and Diffusion Forum, Vol. 83 (Trans Tech Publ, 1992) pp. 111–130
- [32] A. Tayal, M. Gupta, N. P. Lalla, A. Gupta, M. Horisberger, J. Stahn, K. Schlage, and H.-C. Wille, Phys. Rev. B 90, 144412 (Oct 2014), http://link.aps.org/doi/10.1103/PhysRevB.90.144412
- [33] H. Schmidt, G. Borchardt, M. Rudolphi, H. Baumann, and M. Bruns, Appl. Phys. Letters 85, 582 (2004)
- [34] H. Schmidt, M. Gupta, and M. Bruns, Phys. Rev. Lett. 96, 055901 (2006)
- [35] A. D. L. Claire, British Journal of Applied Physics 14, 351 (1963), http://stacks.iop.org/0508-3443/14/i=6/a=317
- [36] I. Kaur, Y. Mishin, and W. Gust, Fundamentals of Grain and Interphase Boundary Diffusion (Wiley, 1995) ISBN 9780471938194, http://books.google.co.in/books?id=RnmAQgAACAAJ
- [37] S. Basu, C. Nayak, A. K. Yadav, A. Agrawal, A. K. Poswal, D. Bhattacharyya, S. N. Jha, and N. K. Sahoo, Journal of Physics: Conference Series 493, 012032 (2014), http://stacks.iop.org/1742-6596/493/i=1/a=012032
- [38] D. M. Phase, M. Gupta, S. Potdar, L. Behera, R. Sah, and A. Gupta, AIP Conference Proceedings 1591, 685 (2014), http://scitation.aip.org/content/aip/proceeding/aipcp/10.1063/1.4872719
- [39] A. Guinier
- [40] B. E. Warren, X-ray Diffraction (Courier Corporation, 1969)
- [41] B. D. Cullity, Elements of X-ray Diffraction (Addison-Wesley,MA, 1978)
- [42] R. Brand, Wissenschaftlich Elektronik GmbH, Starnberg(1995)
- [43] D. M. Borsa and D. O. Boerma, Hyp. Int. 151-152, 31 (2003)
- [44] G. Chen, N. Jaggi, J. Butt, E. Yeh, and L. Schwartz, Journal of physical chemistry 87, 5326 (1983)
- [45] G. Bunker, Introduction to XAFS: a practical guide to X-ray absorption fine structure spectroscopy (Cambridge University Press, 2010)
- [46] T. Yamamoto, X-Ray Spectrometry 37, 572 (2008), ISSN 1097-4539, http://dx.doi.org/10.1002/xrs.1103
- [47] A. Pantelouris, H. Modrow, M. Pantelouris, J. Hormes, and D. Reinen, Chemical Physics 300, 13 (2004), ISSN 0301-0104, http://www.sciencedirect.com/science/article/pii/S0301010404000059
- [48] C. Mitterbauer, C. HAbert, G. Kothleitner, F. Hofer, P. Schattschneider, and H. Zandbergen, Solid State Communications 130, 209 (2004), ISSN 0038-1098, http://www.sciencedirect.com/science/article/pii/S0038109804000936
- [49] J. Pfluger, J. Fink, G. Crecelius, K. Bohnen, and H. Winter, Solid State Communications 44, 489 (1982), ISSN 0038-1098, http://www.sciencedirect.com/science/article/pii/0038109882901302
- [50] M. P. Rosenblum, F. Spaepen, and D. Turnbull, Appl. Phys. Lett. 37, 184 (1980)
- [51] J. Speakman, P. Rose, J. Hunt, N. Cowlam, R. E. Somekh, and A. Greer, J. Magn. Magn. Mat. 156, 411 (1996)
- [52] M. Gupta, A. Gupta, J. Stahn, M. Horisberger, T. Gutberlet, and P. Allenspach, Phys. Rev. B 70, 184206 (2004)
- [53] L. G. Parratt, Phys. Rev. 95, 359 (1954)
- [54] C. Braun, Parratt32- The Reflectivity Tool (HMI Berlin, 1997-99)
- [55] M. Gupta, A. Gupta, S. Rajagopalan, and A. K. Tyagi, Phys. Rev. B 65, 214204 (2002)
- [56] Y. Mishin and C. Herzig, Materials Science and Engineering: A 260, 55 (1999), ISSN 0921-5093, http://www.sciencedirect.com/science/article/pii/S0921509398009782
- [57] T. Suzuoka, Journal of the Physical Society of Japan 19, 839 (1964), http://dx.doi.org/10.1143/JPSJ.19.839, http://dx.doi.org/10.1143/JPSJ.19.839
- [58] J. C. Fisher, Journal of Applied Physics 22, 74 (1951)
- [59] L. G. Harrison, Trans. Faraday Soc. 57, 1191 (1961), http://dx.doi.org/10.1039/TF9615701191
- [60] Y. Mishin and C. Herzig, Nanostructured Materials 6, 859 (1995), ISSN 0965-9773, proceedings of the Second International Conference on Nanostructured Materials, http://www.sciencedirect.com/science/article/pii/0965977395001956
- [61] C. Paduani, Solid State Communications 148, 297 (2008), ISSN 0038-1098, http://www.sciencedirect.com/science/article/pii/S0038109808005164
- [62] B. Eck, R. Dronskowski, M. Takahashi, and S. Kikkawa, J. Mater. Chem. 9, 1527 (1999), http://dx.doi.org/10.1039/A809935I