The number fraction of discs around brown dwarfs in Orion OB1a and the 25 Orionis group
Abstract
We present a study of 15 new brown dwarfs belonging to the old 25 Orionis group and Orion OB1a sub-association with spectral types between M6 and M9 and estimated masses between and . By comparing them through a Bayesian method with low mass stars () from previous works in the 25 Orionis group, we found statistically significant differences in the number fraction of classical T Tauri stars, weak T Tauri stars, class II, evolved discs and purely photospheric emitters at both sides of the sub-stellar mass limit. Particularly we found a fraction of low mass stars classified as CTTS and class II or evolved discs, against a fraction of in the sub-stellar mass domain. Our results support the suggested scenario in which the dissipation of discs is less efficient for decreasing mass of the central object.
Keywords:
stars: low-mass, brown dwarf, open clusters and associations: individual (25 Orionis)1 Introduction
After two decades of studying the properties of young brown dwarfs (BD), there is an agreement that these objects and very low mass stars (VLMS) have similar formation processes (Luhman, 2012, e.g.) although some issues about their early evolution are still matter of intense research. For instance, it is well accepted that the number fractions of VLMS and BD harbouring primordial discs drop off during the first of their evolution (Luhman, 2012, e.g.). However, there is growing evidence suggesting that the time scale for disc dissipation could depend on stellar mass, because the fraction of objects that retain circumstellar discs increases for those with lower masses (Luhman & Mamajek, 2012, e.g.). Such a dependency could have remarkable implications on the efficiency for the formation of giant and terrestrial planets around stars of different masses (Pascucci et al., 2009; Pascucci et al., 2013, e.g.).
The first evidences of such a dependency came from studies in the stellar mass domain. Hernández et al. (2005) found that the inner disc frequency at ages between 3 and 10 in intermediate-mass stars is lower than in low-mass stars and suggested that it could be a consequence of a more efficient mechanism of primordial disc dispersal in the intermediate-mass stars. These results were subsequently supported by Megeath et al. (2005), Sicilia-Aguilar et al. (2006) and Lada et al. (2006). Furthermore, Carpenter et al. (2006) studied the number fraction of discs surrounding stars in the wide mass range in the Upper Sco association, finding that the fraction of primordial optically thick discs decreases as the mass of the star increases. Hernández et al. (2007a) studied stars with spectral types K6 to M4 in the Orion OB1 association and found the maximum of the disc frequency in M0. In the younger Ori cluster Hernández et al. (2007b) reported disc fractions of for and for . This tendency is also supported by results in the Orionis association from Hernández et al. (2010) who found a disc fraction of for K-type stars and for M5 stars or later.
The unprecedented capabilities of the Spitzer Space Telescope (Fazio et al., 2004; Rieke et al., 2004) and the WISE survey (Wright et al., 2010) allowed to extend these studies down to the sub-stellar mass domain. Luhman et al. (2008) complemented the results from Hernández et al. (2007b) for the Ori cluster finding that of the BDs shows IR excesses consistent with discs. Riaz & Gizis (2008) studied the TW Hya association and found that of the BDs show IR excesses, against of the VLMS and Riaz, Lodieu & Gizis (2009) suggest that the longer disc lifetimes in TW Hya could be a consequence of its lower BD spatial density. In the same region, Morrow et al. (2008) showed that the BDs having irradiated accretion discs do not show the silicate emission found in discs around VLMS (Uchida et al., 2004; Furlan et al., 2007) and in younger VLMS and BDs. They interpreted these results as an indication that grain growth occurs more rapidly in discs around BD than in those around stars or that grains grow faster at smaller disc radii as suggested by Kessler-Silacci et al. (2007) and Sicilia-Aguilar et al. (2007).
Particularly, the old Upper Sco association (Preibisch et al., 2002, e.g) has been the subject of several studies about the fraction of BD harboring discs. Scholz et al. (2007) studied VLMS and BD with spectral types from M5 to M9, finding a disc frequency of . They also reported that of such objects also show H emissions consistent with active accretion. Riaz et al. (2012) compiled all the spectroscopically confirmed BDs and identified discs based on WISE photometry. They found a disc frequency of and that half of the VLMS and BD harboring discs also show signatures of accretion. They did not find any dependence of the disc fraction with the stellar number density or the BD/star number ratio and suggested that the differences in disc life times could also be a consequence of different BD formation mechanisms and/or different initial disc fractions. Considering the latest age estimate for that region (Pecaut, Mamajek & Bubar, 2012, ;), Luhman & Mamajek (2012) found that the disc fraction of objects with masses reaches , which indicates that such primordial discs could survive for at least . Recently, in this region, Dawson et al. (2013) reported that of the BDs are class II and that are transitional discs. They also compared their fractions with those for K and M-type stars in Upper Sco, ChaI, IC348 and Ori (Luhman et al., 2005; Damjanov et al., 2007; Lada et al., 2006; Hernández et al., 2007a, respectively) and argued that the correlation between the disc fraction and the stellar mass is not statistically significant, and that the average lifetimes of discs around such stars could not depend on the stellar mass. Using VISTA (Emerson et al., 2004; Emerson & Sutherland, 2010; Petr-Gotzens et al., 2011), IRAC-Spitzer and WISE photometry Downes et al. (2014) studied the old 25 Orionis group and Orion OB1a finding a number fraction of candidates low-mass stars (LMS) showing IR excesses between and while for BDs candidates the number fraction increases up to to .
In summary, there are several indications on a possible dependence of the characteristic time scale of disc dissipation with stellar mass, that extends down to the sub-stellar mass regime, although some issues related to the estimation of ages and the uncertainties in the number fractions need to be clarified. These issues could be addressed by studying different disc indicators in slightly more evolved regions () with consistent age estimations. This, together with the use of numerous samples of LMS and BDs and a thorough statistical treatment, can provide a robust analysis of the variations of disk fractions with age.
In this paper we present an optical spectroscopic and optical/near-IR photometric study of 15 BDs with masses (spectral types between M6 and M9), together with the sample of 77 LMS with masses (spectral types between M0.5 to M5.5) from Downes et al. (2014). These 15 BDs were spectroscopically confirmed as members of the 25 Orionis group and its surroundings in Orion OB1a, from an initial sample of 21 BD candidates. These regions have an age of , estimated from LMS and BD samples (Briceño et al., 2005; Briceño et al., 2007; Downes et al., 2014), all of which are consistent. We obtain the disc number fractions of BD and LMS from two different indicators: IR-excesses and spectroscopic signatures of ongoing accretion. We compute the fractions on both sides of the sub-stellar mass limit following the same procedure, and provide a statistically robust treatment that allows us to compute the probability that the disc fractions of LMS and BD are different.
The paper is organized as follows: In Section 2 we define the sample and describe the photometric database, the spectroscopic observations and data reduction. The membership diagnoses are discussed in Section 3. In Section 4 we classify the new members as class II, evolved discs and class III according to the IR photometric signatures. In Section 6 we analyse the spectroscopic signatures of accretion and classify the new BDs as Classic T Tauri star (CTTS) or Weak T Tauri star (WTTS) sub-stellar analogous. In Section 7 we comment on particular objects and the discussion and conclusions are summarized in Section 8.
2 The sample, observations and data reduction
For the present work we studied 21 targets from the sample of photometric BD candidates with expected spectral types between M6 and L1, obtained during the survey of the 25 Orionis group and its surroundings carried out by Downes et al. (2014). The candidate selection was performed based on their position in colour-magnitude diagrams that combine I-band optical photometry from the CIDA Deep Survey of Orion (Downes et al., 2014, CDSO,) and near IR photometry in the J, H and Ks bands from the Visible and Infrared Survey Telescope for Astronomy (Emerson et al., 2004; Emerson & Sutherland, 2010; Petr-Gotzens et al., 2011, VISTA,).
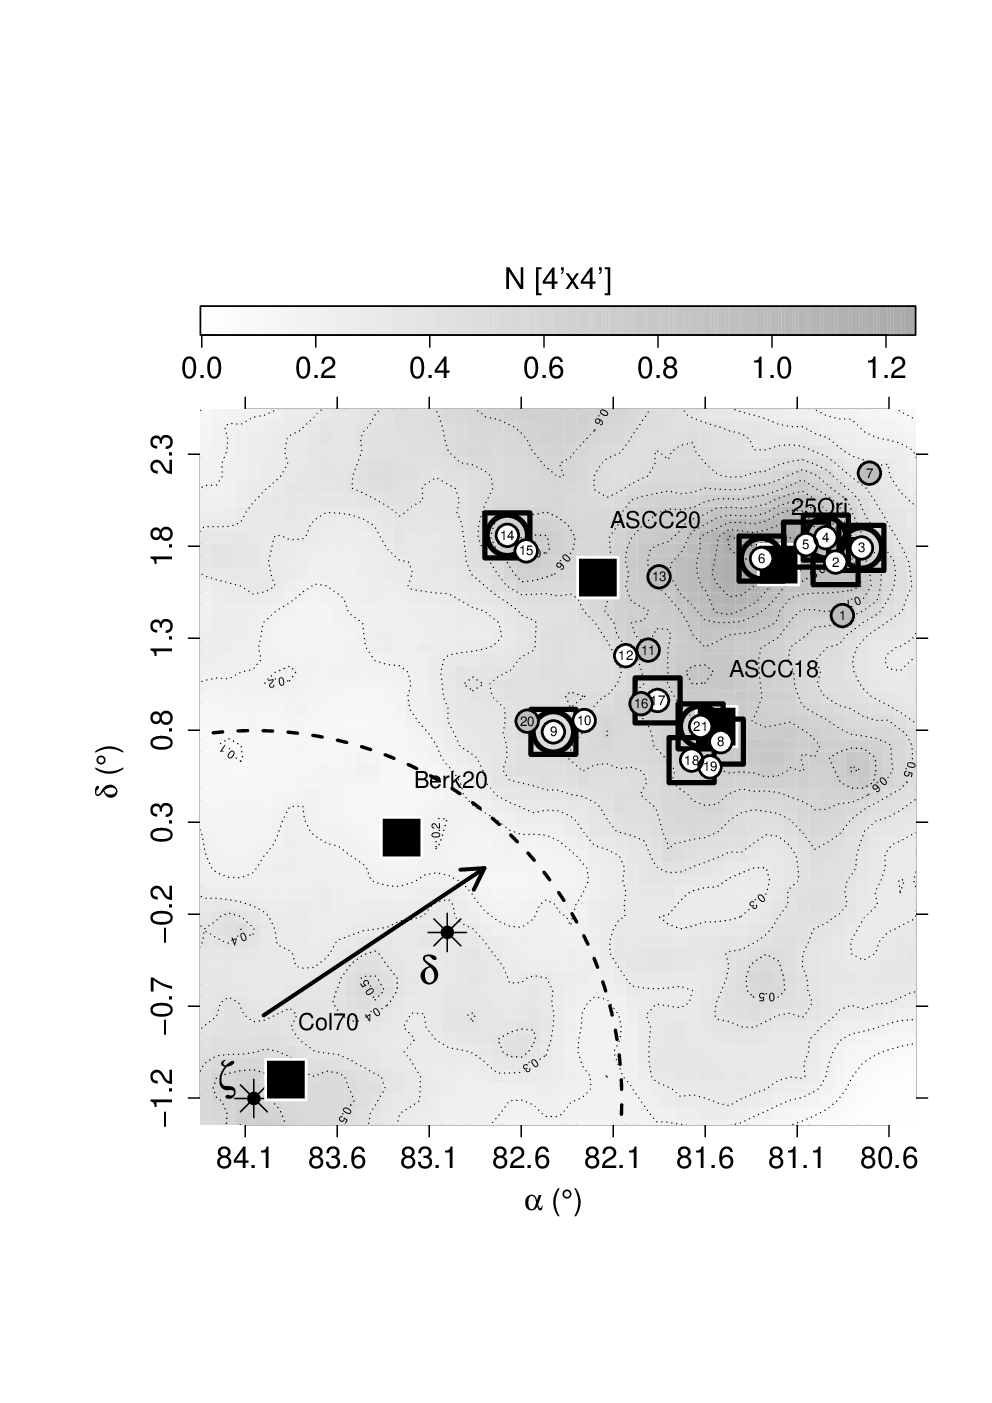
We have carried out the spectroscopic observations of the 21 candidates with the OSIRIS instrument (Cepa et al., 2000) at the Gran Telescopio de Canarias (GTC). The 21 candidates analysed in this work were selected as follows: First we chose 16 candidates with photometric colours consistent with members of Orion with spectral types M7 to L1. These were randomly selected from the full catalog of BD candidates, i.e. without imposing any further cuts that might bias the sample towards objects harbouring discs. Out of these 16 candidates, 5 objects had another M6 to M7 candidate at a distance smaller than 7.4′, which is close enough to be observed simultaneously with the single long-slit configuration of OSIRIS. In this way, we obtained the spectra for 21 candidates with estimated spectral types between M6 and L1, in only 16 observations. The spatial distribution of the sample with respect to the Orion OB1 association is shown in Figure 1.
The observations were performed in service mode during March, October and December 2012 and October and November 2013 as part of the guaranteed Mexican time with GTC. We used the OSIRIS spectrograph in the single long-slit configuration with a 1′′ wide slit and the R500R grism, which results in a Å wavelength coverage with a dispersion of 4.88 Å and a nominal resolution of 587 at 7319 Å. Sky flats, dome flats, bias frames and several spectra of comparison lamps for wavelength calibration were obtained each night. The observing log is shown in Table 1.
| Target11 1 These IDs allow the identification of the targets in the figures and tables of the article. Additional designations from literature are included in the electronic version of Table 3. | Beginning of the observation | Air mass | Seeing | Observing conditions | |
|---|---|---|---|---|---|
| ID | [UT] | [s] | [′′] | ||
| 1 | 2012-03-12T21:02:06.050 | 2400 | 1.26 | 1.5 | clear/dark |
| 2 | 2012-10-08T03:28:22.655 | 2600 | 1.28 | 1.1 | clear/gray |
| 3 | 2012-10-08T04:32:45.348 | 2600 | 1.15 | 1.1 | clear/gray |
| 4 | 2012-12-09T03:15:59.351 | 2600 | 1.26 | 1.0 | spectroscopic/dark |
| 5 | 2012-12-17T01:06:16.672 | 2500 | 1.12 | 1.0 | photometric/dark |
| 6 | 2012-12-17T03:24:48.060 | 2500 | 1.41 | 1.0 | photometric/dark |
| 7 | 2012-12-21T21:25:13.901 | 2600 | 1.61 | 0.8 | spectroscopic/gray |
| 8 | 2013-10-30T06:02:09.175 | 2100 | 1.29 | 0.8 | clear/dark |
| 9 | 2013-10-13T05:02:08.778 | 2500 | 1.13 | 0.7 | clear/dark |
| 10 | 2013-10-13T05:02:08.778 | 2500 | 1.13 | 0.7 | clear/dark |
| 11 | 2013-10-14T05:01:06.925 | 2300 | 1.12 | 0.9 | photometric/bright |
| 12 | 2013-10-14T05:01:06.925 | 2300 | 1.12 | 0.9 | photometric/bright |
| 13 | 2013-11-06T05:05:57.362 | 2300 | 1.20 | 0.7 | spectroscopic/dark |
| 14 | 2013-11-05T04:39:54.909 | 2400 | 1.15 | 0.7 | spectroscopic/dark |
| 15 | 2013-11-05T04:39:54.909 | 2400 | 1.15 | 0.7 | spectroscopic/dark |
| 16 | 2013-11-06T01:50:38.996 | 2300 | 1.26 | 0.8 | spectroscopic/dark |
| 17 | 2013-11-06T01:50:38.996 | 2300 | 1.26 | 0.8 | spectroscopic/dark |
| 18 | 2013-11-06T04:15:15.002 | 2300 | 1.14 | 0.9 | spectroscopic/dark |
| 19 | 2013-11-06T04:15:15.002 | 2300 | 1.14 | 0.9 | spectroscopic/dark |
| 20 | 2013-11-07T02:23:33.637 | 2200 | 1.19 | 0.6 | spectroscopic/dark |
| 21 | 2013-10-30T06:02:09.175 | 2100 | 1.29 | 0.8 | clear/dark |
The spectra were reduced using standard IRAF routines consisting of bias subtraction, flat-fielding, instrumental response correction, spectrum extraction, removal of atmospheric spectral features and wavelength calibration. The wavelength calibration was performed with a mean accuracy of Å and cosmic rays were successfully removed during the extraction of the spectra.
We computed the spectral types following the semi-automated scheme of Hernández et al. (2004)22 2 This procedure was performed using the code SPTCLASS, available at http://www.astro.lsa.umich.edu/hernandj/SPTclass/sptclass.html and the equivalent width of the H line was measured by a linear fit of the continuum performed with the splot task from IRAF. Figure 2 shows the spectra of the new members compared with standards from Kirkpatrick et al. (1999), Luhman (2000), Briceño et al. (2002), Luhman (2004) and Luhman et al. (2005) and Table 2 shows the derived spectral types, visual extinctions, equivalent widths of the H emission line, the surface gravity indicators and the final membership diagnosis we will explain in Section 3.

| Target | ST | CaH33 3 The flags indicate if the spectral feature is consistent with a young BD (1), with a field dwarf (-1) or not conclusive (0). See Section 3 for details. | VO1 | VO2 | KI | NaI | WH | AV | Membership |
| ID | [Å] | [mag] | |||||||
| 1 | M7.51.0 | -1 | -1 | -1 | -1 | -1 | 0 | 0.37 | field |
| 2 | M9.01.0 | 1 | 1 | 1 | 0 | 1 | -21 | 0.02 | member |
| 3 | M8.01.5 | 0 | 1 | 1 | -1 | 1 | -381 | 0 | member |
| 4 | M6.00.5 | -1 | 1 | -1 | 1 | 1 | -27 | 6.29 | member |
| 5 | M8.01.0 | 1 | 1 | 1 | 0 | 1 | -27 | 0 | member |
| 6 | M8.51.0 | 0 | 1 | 1 | 0 | 1 | -226 | 0 | member |
| 7 | M9.01.5 | -1 | 0 | 0 | 0 | 1 | 0 | 0 | field |
| 8 | M7.52.0 | 0 | 1 | 1 | 0 | 1 | -18 | 0 | member |
| 9 | M8.00.5 | 1 | 1 | 1 | 0 | 1 | -81 | 1.36 | member |
| 10 | M7.00.5 | 1 | 1 | 1 | 1 | 1 | -10 | 0 | member |
| 11 | M7.00.5 | 0 | -1 | 0 | 1 | 0 | -17 | 1.61 | field |
| 12 | M7.50.5 | 1 | 1 | 1 | 0 | 1 | -19 | 0 | member |
| 13 | M9.00.5 | 0 | 0 | 1 | 0 | 1 | 0 | 0 | field |
| 14 | M8.01.5 | -1 | 1 | 1 | 0 | 1 | -50 | 0 | member |
| 15 | M6.00.5 | 1 | 0 | 1 | 1 | 1 | -14 | 0.61 | member |
| 16 | M7.00.5 | -1 | -1 | -1 | 0 | -1 | 0 | 0 | field |
| 17 | M7.00.5 | 1 | 1 | 1 | 1 | 1 | -27 | 0 | member |
| 18 | M8.00.5 | 1 | 1 | 1 | 1 | 1 | -44 | 0 | member |
| 19 | M7.00.5 | 1 | 1 | 1 | 1 | 1 | -18 | 0.21 | member |
| 20 | L1.01.0 | 0 | -1 | 0 | -1 | -1 | 0 | field | |
| 21 | M7.50.5 | 1 | 1 | 1 | 1 | 1 | -213 | 0.12 | member |
In order to detect possible IR-excesses from the spectral energy distribution (SED), we complemented the I-band photometry from CDSO and the J, Z, Y, H and Ks-band photometry from VISTA with additional photometry at , , and from IRAC-Spitzer observations from Hernández et al. (2007a) and Briceño et al. (in preparation), and at , , and from the WISE All-Sky Source Catalog (Wright et al., 2010). Additional photometric data in the g, r, i and z-bands from the Sloan Digital Sky Survey Catalog Data Release 8 (Adelman-McCarthy & et al., 2011) were obtained using the VizieR virtual observatory system (Ochsenbein, Bauer & Marcout, 2000). Because of the different sensitivity limits and spatial coverage of each survey, not all the photometric bands are available for all the candidates. The available photometric information for the new BDs is summarized in Table 3.
| ID 44 4 The complete version of the table is available in the electronic version of the article. | RA | DEC | I | J | Z | K | ||
|---|---|---|---|---|---|---|---|---|
| 2 | 80.791100 | 1.714128 | 20.79 | 17.49 | 19.77 | 16.42 | 16.27 | 16.72 |
| 3 | 80.850308 | 1.790936 | 19.93 | 17.26 | 19.41 | 16.21 | 15.68 | 15.00 |
| 4 | 80.894376 | 1.846516 | 19.79 | 16.52 | 18.94 | 15.12 | 14.80 | 14.31 |
| 5 | 80.951425 | 1.809198 | 20.20 | 17.30 | 19.49 | 16.23 | 15.98 | 15.62 |
| 6 | 81.243647 | 1.733360 | 20.32 | 17.35 | 19.49 | 16.24 | 16.07 | 15.65 |
| 8 | 81.514956 | 0.737391 | 19.25 | 16.67 | 18.39 | 15.84 | 15.43 | 15.20 |
| 9 | 82.375058 | 0.790957 | 20.76 | 17.42 | 19.58 | 16.32 | 16.02 | 15.71 |
| 10 | 82.307508 | 0.852826 | 18.45 | 16.13 | 17.83 | 15.26 | 15.09 | 14.88 |
| 12 | 81.956878 | 1.205257 | 18.35 | 16.21 | 17.70 | 15.38 | 15.14 | 15.04 |
| 14 | 82.675353 | 1.859462 | 20.21 | 17.41 | 19.57 | 16.33 | 16.07 | 15.71 |
| 15 | 82.647725 | 1.775001 | 18.15 | 16.02 | 17.41 | 15.22 | 14.98 | 14.77 |
| 17 | 81.909127 | 0.961591 | 18.26 | 15.99 | 17.77 | 15.09 | 14.72 | 14.02 |
| 18 | 81.673711 | 0.637468 | 19.75 | 17.04 | 19.18 | 16.03 | 15.51 | 15.02 |
| 19 | 81.648441 | 0.600469 | 18.70 | 16.22 | 17.96 | 15.38 | 15.10 | 14.83 |
| 21 | 81.549774 | 0.820961 | 19.46 | 16.67 | 18.52 | 15.73 | 15.51 | 14.89 |
As discussed by Jarrett et al. (2011) there is an offset between WISE and IRAC magnitudes, as well as between WISE and IRAC magnitudes. Both offsets occur approximately for magnitudes and magnitudes in such a way that the magnitudes from WISE are increasingly fainter than the corresponding from Spitzer. According to Jarrett et al. (2011) these biases occur as a consequence of an overestimation in the background levels of the WISE images. We found exactly the same behaviour affecting all of our faint objects with available photometry from WISE and Spitzer. In order to correct the photometry from WISE, we selected objects in the Spitzer fields with available photometry from WISE and fit the residuals of the corresponding magnitudes as a function of one of them. After that, we applied the corresponding offset to the WISE photometry as a correction of the reported magnitudes. Because IRAC-Spitzer has no measurements around it was not possible to establish if the background in the WISE pass-band is also underestimated. Only two BDs (numbers 4 and 18) have measurements in the WISE pass-band with reasonable SNR. We disregard all the measurements in the WISE pass-bands because of the very low SNR.
3 Membership diagnoses
Young BDs are still contracting and their surface gravity is lower than for an old field dwarf of the same effective temperature. Since the contamination of the candidate sample comes from old field dwarfs (Downes et al., 2014), we evaluate the membership of the candidates to the 25 Orionis group or Orion OB1a, according to several spectral features sensitive to surface gravity following McGovern et al. (2004). We considered the following spectral features: The CaH ( to ) molecular band, which is stronger in field dwarfs; the VO1 and VO2 molecular bands ( to and to respectively), which are weaker in field dwarfs; the atomic lines KI and NaI , which are expected to be stronger in field dwarfs. Other spectral features sensitive to surface gravity, such as the absorption lines RbI and CsI , were marginally detected only in some of the spectra because of the low SNR and wavelength resolution and did not allow for a reliable estimation of the surface gravity, hence they were not considered further.
These 5 spectral features were compared in the spectra of our candidates to those of young dwarfs from Luhman (2000), Briceño et al. (2002), Luhman et al. (2003) and Luhman (2004), and field dwarfs from Kirkpatrick et al. (1999) of the same spectral types. We found a very good general agreement between the different surface gravity indicators as we show in Table 2 and Figure 2. Table 2 summarizes, for each of the 21 candidates, whether each of the 5 spectral features is consistent with a young or field BD of the corresponding spectral type. We classified as members those candidates showing at least 3 spectral features consistent with low surface gravity. Using these criteria we have confirmed 15 members from the sample of 21 photometric candidates.
We stress that such a selection is also supported by: all the objects classified as young BDs show H line in emission and their visual extinction is consistent with the mean value for known members in 25 Ori and Orion OB1a (Downes et al., 2014; Briceño et al., 2007; Briceño et al., 2005, ). The visual extinction for each candidate was obtained from the observed I-J colour and the intrinsic I-J colour that corresponds to the spectral type. We used the intrinsic colours to spectral type relationships used by Luhman (1999), Briceño et al. (2002) and Luhman et al. (2003), designed to match the Baraffe et al. (1998) tracks such that the components of GG Tau appear coeval on the H-R diagram, as explained by Luhman et al. (2003). We used the extinction law from Cardelli, Clayton & Mathis (1989) assuming R 3.09. The resulting extinctions are shown in Table 2 and are consistent, within the uncertainties, with previous determinations. The only exceptions are for the BDs 4 and 9 and are discussed in Section 7.
The selected young BDs could be members of the 25 Orionis group or other regions of Orion OB1a which essentially have the same age (Briceño et al., 2005; Downes et al., 2014, ,). Nevertheless, the BDs could also be members of a different sub-region within the Orion OB1 association. Particularly we are interested in determining if some of them could belong to the younger and relatively close (, Figure 1) Orion OB1b (Briceño et al., 2005, ,). However, we conclude the contamination due to members of the nearby younger Orion OB1b must be very low for the following reasons:
The spatial distribution of the new BDs is consistent with those from previously known members of the 25 Orionis group and Orion OB1a of earlier spectral types (Briceño et al., 2005; Downes et al., 2014; Kharchenko et al., 2005). As shown in the spatial overdensities of Figure 1 the candidate LMS and BDs of Orion OB1a and the 25 Orionis group are spatially distinct from the region populated by Orion OB1b sources.
Considering a velocity dispersion of , the angular separation between the sub-association Orion OB1a and OB1b and their distances to the Sun ( for OB1a (Briceño et al., 2007) and for OB1b (Briceño et al., 2005)), a member of the younger OB1b (Briceño et al., 2005, ,) would need more than to escape and end up in the line of sight to the 25 Orionis group. Thus, the possible contaminants could, at most, affect the eastern part of the survey. However, if the contamination from OB1b were significant an overdensity of class II, evolved discs and/or accretors (see Sections 4 and 6) would be expected in the eastern part of the survey closer to Orion OB1b, which is not observed in Figure 1. Therefore, we consider it much more likely that these young BDs are members of the 25 Ori group or the Orion OB1a sub-association, than Orion OB1b contaminants.
A particular case is the new BDs 8, 18, 19 and 21 which are close to the stellar group ASCC18 from the catalog of Kharchenko et al. (2005) who report it as a group in the Orion OB1 association. On the basis of one intermediate mass star, Kharchenko et al. (2005) estimated an age of for ASCC18 which is slightly older than the 25 Orionis group and Orion OB1a, something which does not affect the conclusions presented here.
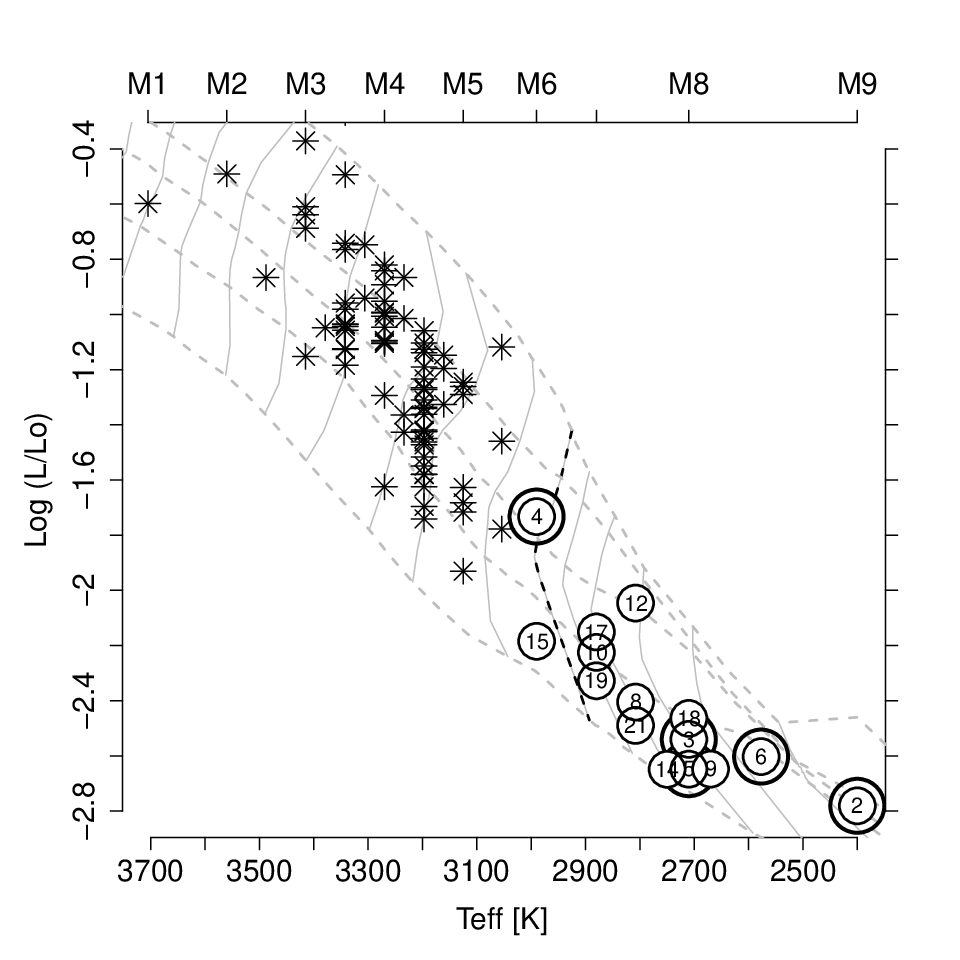
The position of the new BDs in the H-R diagram is shown in Figure 3 together with the LMS of the 25 Orionis group from (Downes et al., 2014). We computed the effective temperatures by interpolation of the spectral types into the Luhman et al. (2003) relationships for young BDs and we computed the bolometric luminosities from the dereddened I-band magnitudes, assuming a distance of (Briceño et al., 2007) and the bolometric corrections from Dahn et al. (2002). The masses were derived by interpolation of the luminosities and the effective temperatures into the DUSTY models from Chabrier et al. (2000) and are shown in Table 5.
Finally, based on simulations performed with the Besançon Galactic model (Robin et al., 2003), we showed in Downes et al. (2014) that in the spectral-type range considered here, our photometric selection procedure for candidates in the 25 Orionis group and its surroundings has a mean total contamination of , composed solely of foreground field dwarfs. In this work we spectroscopically confirmed that of the candidates are real members and the remaining targets show spectral features consistent with the high surface gravity expected from old dwarf stars from the field, which perfectly matches the expected contamination fraction.
4 Photometric signatures of discs
It is well established that some young BDs show IR excesses indicative of circumstelar discs (Luhman, 2012, e.g.). In this section we classify the discs surrounding the new BDs according to their excesses in the wavelength range . For the classification of the discs we assume the general scheme for their evolution around LMS and VLMS (Lada et al., 2006, e.g.) in which they evolve from class 0 to I, then to class II, then passing through the evolved disc stage (Hernández et al., 2007a, e.g.), perhaps passing through the pre-transitional to the transitional stages (Espaillat et al., 2007, e.g.) depending on the mass of the disc, and ending as class III objects. Thus, we follow the same classification scheme in order to compare the evolution of discs around objects at both sides of the sub-stellar mass limit.
The evolutionary stage of the discs can be inferred from the slopes of the spectral energy distributions (SED) at different wavelength ranges or equivalently from its distribution in selected colour-colour diagrams. We performed the classification according to the SEDs of each new member and plotted the results in a set of selected colour-colour diagrams in order to show the distribution of the BDs and how it supports their classification through the SEDs. All the SEDs include measurements at the I, Z, Y, J, H, Ks, and photometric-bands, although the differences in sensitivity and spatial coverage of the WISE, IRAC and SDSS surveys give us information only for a subset of the complete sample in the remaining photometric-bands mentioned in Section 2.
We consider as IR excesses all the SED points for showing fluxes above the photospheric emissions predicted by the BT-Dusty model from Allard, Homeier & Freytag (2012) which was developed for near-IR studies of BDs with . Our procedure was as follows: First, we estimate the photospheric emission for the BDs by fitting their extinction corrected SEDs to the BT-Dusty model. For all the fits we used the I, Z, Y, J and H band-passes which were complemented with the g, r, i and z photometry when available. In this way, we perform the fits with a minimum of 5 and a maximum of 10 band-passes in a wavelength range where the IR excesses are not expected to occur and where the peaks of the photospheric contribution to the SEDs are expected. Before the fits, the SEDs were corrected by reddening using the AV obtained as explained in Section 3 and the extinction law from Fitzpatrick (1999) improved by Indebetouw et al. (2005) in the infrared (), with the parameter R=3.02. We make use of the Virtual Observatory SED Analyzer (VOSA) fitting tools from Bayo et al. (2008) in order to apply the reddening corrections and make the fits to the Allard, Homeier & Freytag (2012) models. The effective temperatures obtained from the fits are consistent with those obtained by the interpolation of the spectral types in the Luhman et al. (2003) relationships.
We classify as class II those BDs showing excesses at the K-band or longer wavelengths, consistent with the median SED for Taurus from Furlan et al. (2006). We considered as evolved discs those BDs showing excesses for wavelengths longer than the Ks-band but clearly weaker than the excesses observed for class II. Finally we classify as BDs of class III those showing a purely photospheric SED consistent with the fits to the Allard, Homeier & Freytag (2012) models.
With the available photometry we cannot reliably detect BDs surrounded by transitional or pre-transitional discs (Espaillat et al., 2007) because the spectral coverage in the wavelength range is not homogeneous for most of the sources. Figure 4 shows the SEDs for all the new confirmed BDs, together with the resulting fit to the photospheric models from Allard, Homeier & Freytag (2012) and the median SED for Taurus from Furlan et al. (2006).

The IR excesses are also detectable in colour-colour diagrams supporting the results obtained from the SEDs. Figures 5 and 6 show a selection of colour-colour diagrams some of those showing the discs locii from Hartmann et al. (2005), Luhman et al. (2005) and Luhman et al. (2010).


Summarizing the results from our classification, out of the 15 new BDs, we have found 3 objects showing IR excesses consistent with BDs of class II, 8 consistent with evolved discs and 4 showing purely photospheric SEDs that were classified as BDs of class III. Using data from Downes et al. (2014), we have followed the same procedure to classify IR excesses observed in a sample of 77 LMS with spectral types between M0.5 and M5.5 and masses , confirmed as members of the 25 Orionis group. We find 3 of class II, 11 having evolved discs and 63 of class III. These results are summarized in Table 4.
An important issue is that our selection of the photometric candidates was performed inside a set of locii in the colour-magnitude diagrams I vs. I-J, I vs. I-H and I vs. I-K that enclose all the LMS and BD expected to have purely photospheric emissions as well as those showing IR excesses (Downes et al., 2014). Then, our procedure do not bias the selection of candidates towards LMS or BDs harbouring discs, even for those candidates that are fainter than the completeness limits in such diagrams (Downes et al., 2014).
| Classification | BD () | LMS () | P>0.1 | ||
|---|---|---|---|---|---|
| [N] | [%] | [N] | [%] | ||
| Class II | 3 | 3 | |||
| Evolved | 8 | 11 | |||
| CTTS | 5 | 3 | |||
| CTTS & Class II or Evolved | 5 | 3 | |||
| Class III | 4 | 63 | |||
| WTTS | 10 | 74 | |||
5 Computation of disc fractions
In order to compute discs fractions and their uncertainties given the limited number of objects with discs in our samples, we use Bayesian statistics. This allows us to state the problem in a general way providing us with a probability function for the disc fractions and, more importantly, with a quantitative way of estimating the probability that disc fractions from two independent samples differ.
We can think of the disc fraction as the probability for any single star to harbour a disc. Given a sample with a disc fraction and a total number of stars, the likelihood of observing stars with discs is then simply given by the Binomial distribution. Assuming a uniform prior probability distribution for the disc fraction in the range , from the Bayes’s theorem (Sivia & Skilling, 2006) we have the Posterior PDF expressed simply as:
| (1) |
where is a normalization constant such that .
We can now generalize this to the case where we have two independent samples, LMS and BDs, and express the full posterior probability of and as the product of the two independent probabilities:
| (2) |
where and are the observed numbers of LMS and BDs harbouring discs, in samples with a total number of and of LMS and BDs respectively. Each of the terms in the right hand side in this equation are thus given by Eq. 1.
Applying this for the LMS and BD samples detailed in the previous section, for class II objects we have , , and which results in the Posterior PDFs shown in the upper panels of Figure 7. The right panel shows isocontours of the 2D posterior of Eq. 2. The left panel shows the marginal 1D Posterior PDFs for the class II fraction of LMS (gray solid line) and BDs (black solid line). The resulting fractions are and , which correspond to the most probable values and the respective confidence intervals, computed as the 16th and 84th percentiles of the corresponding PDFs, respectively shown with dashed and dotted lines in the upper left panel of Figure 7.
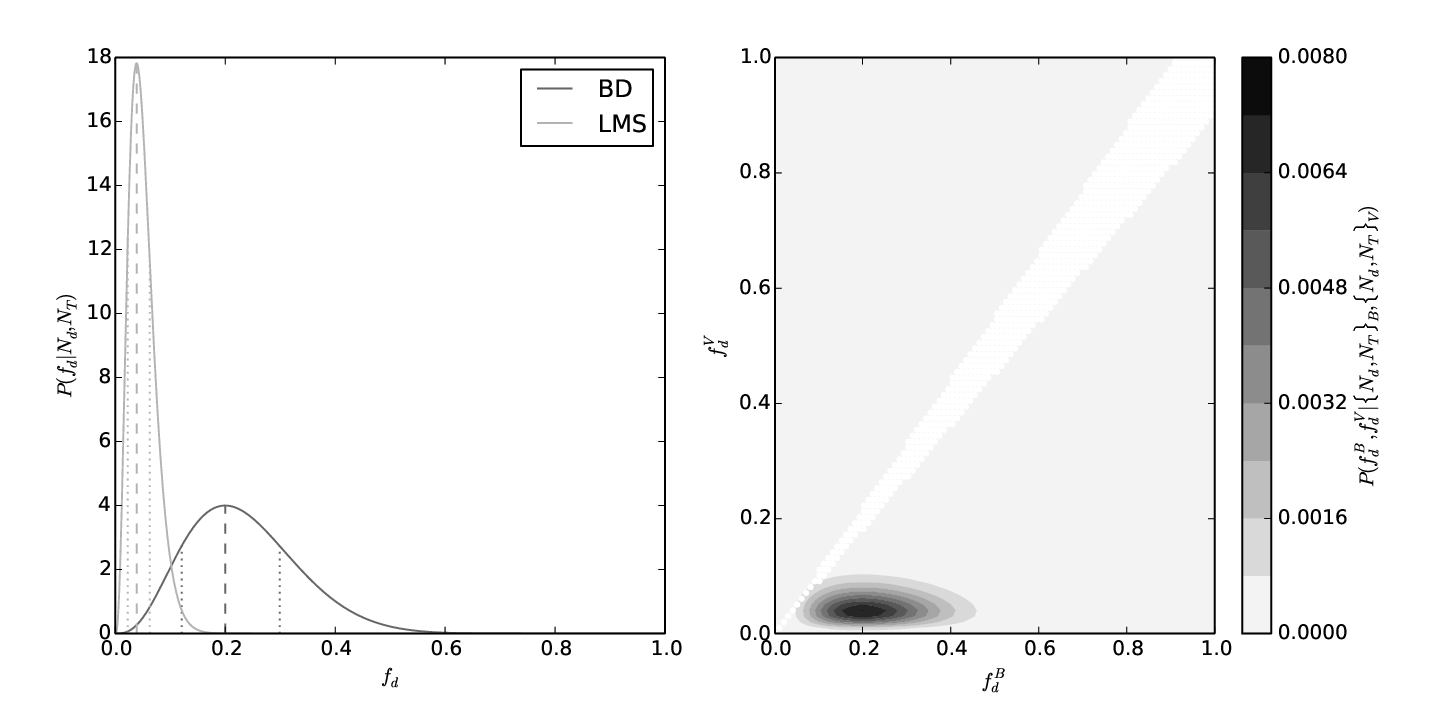
The next question is what is the probability that these two populations have differing class II fractions. It is clear that in this case the obtained disc fractions are quite different, even taking into account the reported uncertainties, but the posterior PDF of Eq. 2 allows us to quantify this probability in a general manner, which will be useful for less clear cases. Marginalizing the 2D posterior PDF, we compute the probability that the class II fractions of the two populations differ by more than a certain fractional margin as:
| (3) |
In this case, choosing a fractional difference of , we find , i.e. there is a probability that the class II fractions of LMS and BD are different by more than .
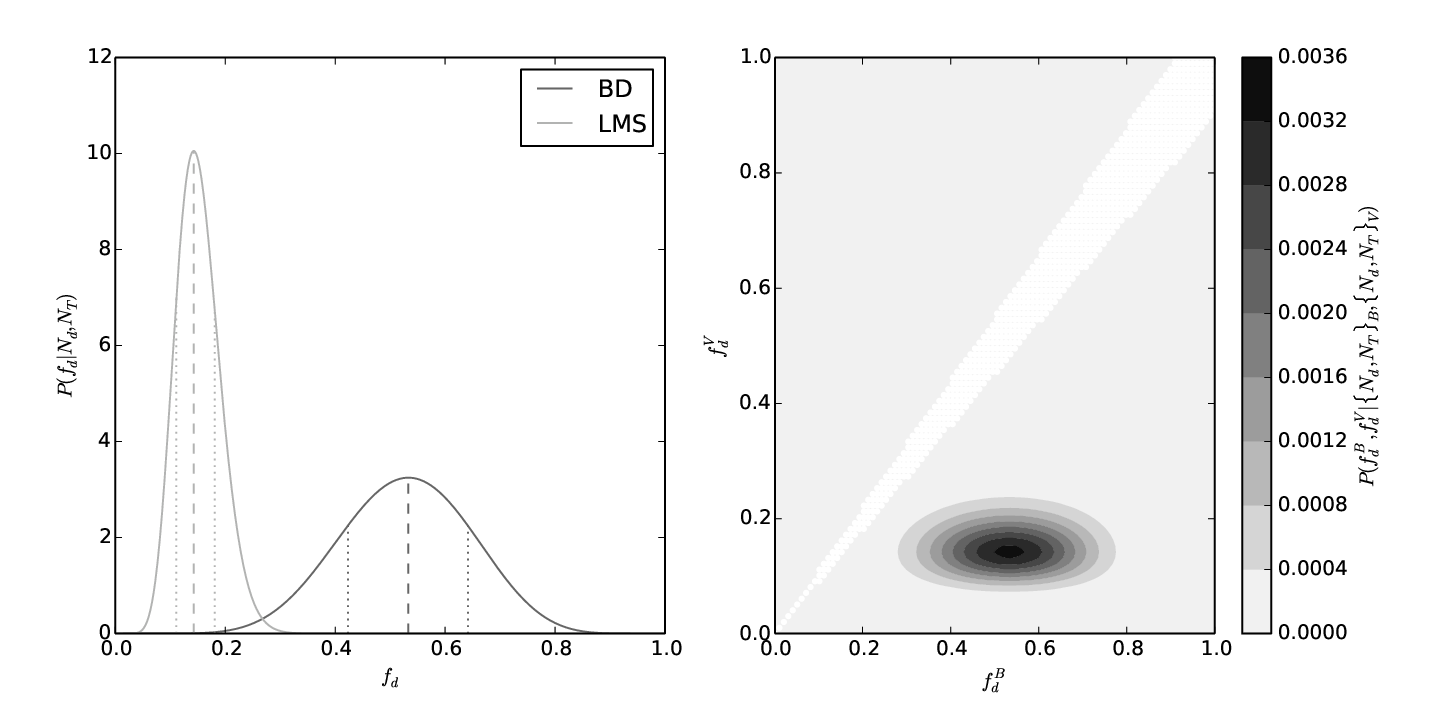
Similarly, we use Eq. 2 to compute the Posterior PDF for the fractions of evolved discs and class III objects in the LMS and BD mass regimes. For evolved discs we find fractions of and for LMS and BDs respectively, with a probability (from Eq. 3) that these two fractions differ by more than (Figure 7). For class III we obtain fractions of and for LMS and BDs respectively, with a probability . The number fractions and probabilities are summarized in Table 4. We conclude that the number fractions of class II, evolved discs and class III clearly differ at both sides of the sub-stellar mass limit. This differences are statistically robust as supported by the probabilities.
Finally, we emphasize that we confirmed the number fractions found by Downes et al. (2014) in the 25 Orionis group based only on photometric BD candidates, with a sample of spectroscopically confirmed members. The fractions we obtained following the Bayesian procedure for LMS are also consistent with those reported by Briceño et al. (2005), Briceño et al. (2007) and Downes et al. (2014). The final disc classification of each BD is shown in Table 5.
6 Spectroscopic signatures of accretion
The evidence of discs around BDs comes not only from IR excesses but also from signatures related to magnetospheric accretion such as broad permitted emission line profiles and optical continuum veiling (White & Basri, 2003; Jayawardhana, Mohanty & Basri, 2003; Muzerolle et al., 2005; Luhman, 2012, e.g.). The number fraction of BDs classified as CTTS sub-stellar analogous is also an indication of the evolutionary stage of its population in the sense that this number fraction is expected to decrease with time. In this section we study the equivalent width of H as a function of the spectral type in order to classify the new BDs as sub-stellar analogous of the WTTS or CTTS. Also, we compare these results with those from the IR excesses indicative of discs discussed in Section 4 as well as with stellar counterparts.
We classified the new BDs as sub-stellar analogous of the WTTS or CTTS based on the equivalent width of the H line in emission and their spectral types, according to the empirical classification scheme from Barrado y Navascués & Martín (2003) in which a BD is a CTTS analogue if its H emission is stronger than is expected from purely chromospheric activity which depends on their spectral type (see Figure 8). There are several optical spectral features which indicate ongoing accretion in LMS and BDs, such as H, H, HeI 5876 lines in emission as well as the veiling of the photospheric absorption lines (Muzerolle et al., 2003; Muzerolle et al., 2005). However, the low SNR in the blue-most range of our spectra does not allow for a reliable detection of most of these additional lines or to measure veiling. The equivalent widths of H are shown in Table 2 and the corresponding close up of the H line for each BD in Figure 2. Figure 8 shows the H equivalent width as a function of the spectral type for the new BDs as well as the limit between WTTS and CTTS proposed by Barrado y Navascués & Martín (2003). We find that 5 of the new BDs show signatures of active accretion consistent with CTTS and that the remaining 10 BDs of the sample show low H emissions as expected in WTTS. Following the procedure explained in Section 5, these corresponds respectively to CTTS and WTTS fractions of and among BDs (see Table 4).

| ID | Log() | Teff | Mass55 5 Masses were estimated from the interpolation of the and luminosities into the DUSTY models from Chabrier et al. (2000). | TTS | Classification |
|---|---|---|---|---|---|
| [K] | [] | ||||
| 2 | -2.7808 | 2400 | 0.01 | WTTS | Evolved |
| 3 | -2.5400 | 2710 | 0.03 | CTTS | Class II |
| 4 | -1.7326 | 2990 | 0.08 | CTTS | Class II |
| 5 | -2.6480 | 2710 | 0.03 | WTTS | Evolved |
| 6 | -2.6024 | 2577 | 0.02 | CTTS | Evolved |
| 8 | -2.4048 | 2808 | 0.04 | WTTS | Evolved |
| 9 | -2.6476 | 2710 | 0.03 | CTTS | Evolved |
| 10 | -2.2248 | 2880 | 0.06 | WTTS | Class III |
| 12 | -2.0460 | 2808 | 0.03 | WTTS | Class III |
| 14 | -2.6484 | 2710 | 0.03 | WTTS | Evolved |
| 15 | -2.1845 | 2990 | 0.08 | WTTS | Class III |
| 17 | -2.1508 | 2880 | 0.05 | WTTS | Evolved |
| 18 | -2.4640 | 2710 | 0.03 | WTTS | Class II |
| 19 | -2.3276 | 2880 | 0.06 | WTTS | Class III |
| 21 | -2.4896 | 2808 | 0.04 | CTTS | Evolved |
We classified the 77 LMS from Downes et al. (2014) as CTTS or WTTS following the same procedure we used for BDs. We find 3 CTTS (spectral types M1, M1.5 and M5.5) and 74 WTTS (spectral types between M0.5 and M5.5) corresponding respectively to and which are consistent with the results from Briceño et al. (2005) and Downes et al. (2014) in the same region. As we did for the IR excesses, in Figure 9 we show the probability distribution of the fraction of CTTS in the LMS and BD mass regimes. We found that within a margin there are, respectively, probabilities of and that the fractions of CTTS and WTTS for BDs have different values than for LMS. Again, these probabilities show that the difference observed in the CTTS and WTTS fractions obtained for LMS and BDs has a high statistical significance.

We emphasize that from the 5 BDs showing accretion signatures, 2 were classified as class II and 3 as evolved discs. In the LMS regime from the 3 objects classified as CTTS, 2 show IR excesses indicative of class II and 1 was classified as an evolved disc. Even if we considered as accretors only those BDs that were classified as CTTS and class II, the fractions at both sides of the sub-stellar mass limit remain different: for BDs, for LMSs and with a probability that both fractions are different within . Finally, the BD 4 was classified as CTTS although it is close to the WTTS/CTTS limit from Barrado y Navascués & Martín (2003). Even if we considered as CTTS only the BDs showing strong in emission (numbers 3, 6, 9 and 21), the CTTS fraction is which is still higher than the fraction obtained in the LMS regime.
7 Comments on particular objects
The BDs 4, 10, 12, 15, 17 and 19 have information in the J, H and Ks-bands from the surveys VISTA and 2MASS. From these, the BDs 19 and 17 show evidence of 1 variability in the three band-passes but such level of variability does not change the general results presented here because the fits to the Allard, Homeier & Freytag (2012) models, changing the photometry randomly within the variations we found, do not change significantly.
The BD 4 shows an unexpectedly high extinction , considering that the mean extinction towards the 25 Orionis group and Orion OB1a is . This BD shows a SED clearly consistent with the median SED for Taurus and was classified as a class II although the available photometry at wavelengths shorter than H-band, where the excesses are not detected, is not enough for a reliable fit into the photospheric models. Additionally it shows line in emission which is consistent with ongoing accretion. We speculate that its strong extinction could be a result of the disk being edge-on.
The BD 9 shows an extinction which is slightly higher but it is consistent with mean extinction towards the region if the uncertainty in the spectral type is considered.
The BD 4 was classified as CTTS and the BDs 14 and 18 as WTTS but there are close to the CTTS/WTTS limit proposed by Barrado y Navascués & Martín (2003). New spectroscopic observations with a higher SNR are needed to improve their spectral classification (particularly BD 14) as well as the measurement of the H equivalent widths in order to improve their classification as CTTS or WTTS sub-stellar analogous.
8 Summary and conclusions
We have studied 21 candidate BDs belonging to the 25 Orionis group and the Orion OB1a subassociation and spectroscopically confirmed 15 of them as new sub-stellar members with spectral types between M6 and M9. Comparing the SEDs of the new members at wavelengths beyond with those from the BT-Dusty photospheric models (Allard, Homeier & Freytag, 2012) for the temperatures corresponding to their spectral types and with the mean SED for Taurus representative of class II (Furlan et al., 2006), we detect IR excesses indicative of class II, evolved disc and class III. We also classified the new BDs as CTTS and WTTS sub-stellar analogous according to the empiric limit proposed by Barrado y Navascués & Martín (2003).
We have applyed a Bayesian analysis to compute the number fractions of BDs showing disc and magnetospheric accretion signatures and compare them with those for a sample of 77 LMS belonging to the 25 Orionis group from Downes et al. (2014), classified following the same procedures. We find a significant higher fraction of CTTS, evolved discs and class II objects in the sub-stellar mass regime than in the LMS regime and a fraction of WTTS and class III which is lower for BDs than for LMS. All the differences were found to have a high statistical significance. Our main result is that the number fractions of BDs classified as CTTS and Class II or evolved disc result to be for BDs while for the LMS is . Such difference has a probability of being real.
The differences between the fractions of discs and accretion signatures at both sides of the sub-stellar mass limit could be interpreted, at least, considering the following three scenarios:
If the disc fraction were not dependent on the mass of the central object, a way to mimic the observed fractions would be for the formation of BDs to occur over a longer period of time than for the LMS. In this scenario, the younger BDs would still retain the discs, increasing the mean disc fractions for BDs with respect to the LMS. Nevertheless, we found of BDs are CTTS and class II or evolved disc which is similar to the fraction observed for LMS at ages of (e.g. Hernández et al., 2007b, Ori; ). Therefore, the observed population should have started to form ago and extended only for BDs until ago. Such an age difference should be reflected in the H-R diagram as a larger scatter of the BD locus relative to the LMS, which is not observed in the results presented here. In addition, extinction patterns commonly found in regions of about , such as Ori or Orion OB1b, are not observed in the surveyed area (Downes et al., 2014).
If the time scale for disc dissipation were the same for BDs and LMS, the initial fraction of discs would have to be higher for BDs than for LMS, as suggested by Riaz et al. (2012), in order to reproduce the larger disc fractions observed for BDs relative to LMS at a given age. Since we are measuring LMS and BD disc fractions at a single age of , our observations alone cannot rule out a difference in the initial disc fractions. However, comparing with observations in the old Ori from Hernández et al. (2007b, ∼ % 35 for LMS) and Luhman et al. (2008, ∼ % 60 for BDs), we see that for LMS the fraction drops from to while for BDs it drops from to . This means the disc fraction drops by a factor for LMS and by a factor of for BDs in the period of time from to . This strongly suggest that, regardless of the initial disc fractions, disc evolution occurred faster for LMS than for BDs, which leads us to the third and last scenario.
The BD and LMS populations are coeval and the time scale for disc evolution depends on the mass of the central object, being slower for BDs than for LMS. Our results support this scenario, which has been previously suggested by [e.g.] Riaz et al. (2012) and Luhman & Mamajek (2012).
More spectroscopic and photometric optical and near-IR observations for LMS and BDs populations in star forming regions with ages around old and older are needed in order to clearly constrain how the evolution of the discs proceeds and what is its dependency with the mass of the central object. In order to understand the physical scenarios involved, modeling and simulations are also needed, as well as a consistent statistical estimation of the number fractions and their comparisons for different regions.
Acknowledgments
J. J. Downes and C. Román-Zúñiga acknowledges support from Consejo Nacional de Ciencia y Tecnología de México (CONACYT) grant number 152160. C. Mateu acknowledges support from the postdoctoral Fellowship of DGAPA-UNAM, México.
We thank the assistance of the personnel, observers, telescope operators and technical staff at GTC and CIDA, who made possible the observations at the Gran Telescopio de Canarias and at the Jürgen Stock telescope of the Venezuela National Astronomical Observatory (OAN), especially Antonio Cabrera Lavers, Daniel Cardozo, Orlando Contreras, Franco Della Prugna, Freddy Moreno, Richard Rojas, Gregore Rojas, Gerardo Sánchez, Gustavo Sánchez and Ubaldo Sánchez.
We thank Gladis Magris at CIDA for useful comments that helped improve the explanation of the Bayesian technique presented here.
Based on observations made with the Gran Telescopio Canarias (GTC), installed in the Spanish Observatorio del Roque de los Muchachos of the Instituto de Astrofísica de Canarias, in the island of La Palma.
Based on observations obtained at the Llano del Hato National Astronomical Observatory of Venezuela, operated by Centro de Investigaciones de Astronomía (CIDA) for the Ministerio de Educación, Ciencia y Tecnología.
This work is based [in part] on observations made with the Spitzer Space Telescope, which is operated by the Jet Propulsion Laboratory, California Institute of Technology under a contract with NASA. Support for this work was provided by NASA through an award issued by JPL/Caltech.
This publication makes use of data products from the Wide-field Infrared Survey Explorer, which is a joint project of the University of California, Los Angeles, and the Jet Propulsion Laboratory/California Institute of Technology, funded by the National Aeronautics and Space Administration.
Funding for the SDSS and SDSS-II has been provided by the Alfred P. Sloan Foundation, the Participating Institutions, the National Science Foundation, the U.S. Department of Energy, the National Aeronautics and Space Administration, the Japanese Monbukagakusho, the Max Planck Society, and the Higher Education Funding Council for England. The SDSS Web Site is http://www.sdss.org/. The SDSS is managed by the Astrophysical Research Consortium for the Participating Institutions. The Participating Institutions are the American Museum of Natural History, Astrophysical Institute Potsdam, University of Basel, University of Cambridge, Case Western Reserve University, University of Chicago, Drexel University, Fermilab, the Institute for Advanced Study, the Japan Participation Group, Johns Hopkins University, the Joint Institute for Nuclear Astrophysics, the Kavli Institute for Particle Astrophysics and Cosmology, the Korean Scientist Group, the Chinese Academy of Sciences (LAMOST), Los Alamos National Laboratory, the Max-Planck-Institute for Astronomy (MPIA), the Max-Planck-Institute for Astrophysics (MPA), New Mexico State University, Ohio State University, University of Pittsburgh, University of Portsmouth, Princeton University, the United States Naval Observatory, and the University of Washington.
This work makes extensive use of the following tools: TOPCAT and STILTS available at http://www.starlink.ac.uk/topcat/ and http://www.starlink.ac.uk/stilts/, R from the R Development Core Team (2011) available at http://www.R-project.org/ and described in R: A language and environment for statistical computing from R Foundation for Statistical Computing, Vienna, Austria. ISBN 3-900051-07-0, IRAF which is distributed by the National Optical Astronomy Observatories, which are operated by the Association of Universities for Research in Astronomy, Inc., under cooperative agreement with the National Science Foundation and the Virtual Observatory Spectral Energy Distribution Analyzer (VOSA), developed under the Spanish Virtual Observatory project supported from the Spanish MICINN through grant AyA2008-02156.
References
- Adelman-McCarthy & et al. (2011) Adelman-McCarthy J. K., et al., 2011, VizieR Online Data Catalog, 2306, 0
- Allard, Homeier & Freytag (2012) Allard F., Homeier D., Freytag B., 2012, Royal Society of London Philosophical Transactions Series A, 370, 2765
- Baraffe et al. (1998) Baraffe I., Chabrier G., Allard F., Hauschildt P. H., 1998, A&A, 337, 403
- Barrado y Navascués & Martín (2003) Barrado y Navascués D., Martín E. L., 2003, AJ, 126, 2997
- Bayo et al. (2008) Bayo A., Rodrigo C., Barrado Y Navascués D., Solano E., Gutiérrez R., Morales-Calderón M., Allard F., 2008, A&A, 492, 277
- Briceño et al. (2002) Briceño C., Luhman K. L., Hartmann L., Stauffer J. R., Kirkpatrick J. D., 2002, ApJ, 580, 317
- Briceño et al. (2005) Briceño C., Calvet N., Hernández J., Vivas A. K., Hartmann L., Downes J. J., Berlind P., 2005, AJ, 129, 907
- Briceño et al. (2007) Briceño C., Hartmann L., Hernández J., Calvet N., Vivas A. K., Furesz G., Szentgyorgyi A., 2007, ApJ, 661, 1119
- Cardelli, Clayton & Mathis (1989) Cardelli J. A., Clayton G. C., Mathis J. S., 1989, ApJ, 345, 245
- Carpenter et al. (2006) Carpenter J. M., Mamajek E. E., Hillenbrand L. A., Meyer M. R., 2006, ApJL, 651, L49
- Cepa et al. (2000) Cepa J. et al., 2000, in Society of Photo-Optical Instrumentation Engineers (SPIE) Conference Series, Vol. 4008, Society of Photo-Optical Instrumentation Engineers (SPIE) Conference Series, Iye M., Moorwood A. F., eds., pp. 623–631
- Chabrier et al. (2000) Chabrier G., Baraffe I., Allard F., Hauschildt P., 2000, ApJ, 542, 464
- Dahn et al. (2002) Dahn C. C. et al., 2002, AJ, 124, 1170
- Damjanov et al. (2007) Damjanov I., Jayawardhana R., Scholz A., Ahmic M., Nguyen D. C., Brandeker A., van Kerkwijk M. H., 2007, ApJ, 670, 1337
- Dawson et al. (2013) Dawson P., Scholz A., Ray T. P., Marsh K. A., Wood K., Natta A., Padgett D., Ressler M. E., 2013, MNRAS, 429, 903
- Downes et al. (2014) Downes J. J. et al., 2014, MNRAS, 444, 1793
- Emerson et al. (2004) Emerson J. P., Sutherland W. J., McPherson A. M., Craig S. C., Dalton G. B., Ward A. K., 2004, The Messenger, 117, 27
- Emerson & Sutherland (2010) Emerson J. P., Sutherland W. J., 2010, in Society of Photo-Optical Instrumentation Engineers (SPIE) Conference Series, Vol. 7733, Society of Photo-Optical Instrumentation Engineers (SPIE) Conference Series
- Espaillat et al. (2007) Espaillat C., Calvet N., D’Alessio P., Hernández J., Qi C., Hartmann L., Furlan E., Watson D. M., 2007, ApJL, 670, L135
- Fazio et al. (2004) Fazio G. G. et al., 2004, ApJS, 154, 10
- Fitzpatrick (1999) Fitzpatrick E. L., 1999, PASP, 111, 63
- Furlan et al. (2006) Furlan E. et al., 2006, ApJS, 165, 568
- Furlan et al. (2007) Furlan E. et al., 2007, ApJ, 664, 1176
- Hartmann et al. (2005) Hartmann L., Megeath S. T., Allen L., Luhman K., Calvet N., D’Alessio P., Franco-Hernandez R., Fazio G., 2005, ApJ, 629, 881
- Hernández et al. (2004) Hernández J., Calvet N., Briceño C., Hartmann L., Berlind P., 2004, AJ, 127, 1682
- Hernández et al. (2005) Hernández J., Calvet N., Hartmann L., Briceño C., Sicilia-Aguilar A., Berlind P., 2005, AJ, 129, 856
- Hernández et al. (2007a) Hernández J. et al., 2007a, ApJ, 671, 1784
- Hernández et al. (2007b) Hernández J. et al., 2007b, ApJ, 662, 1067
- Hernández et al. (2010) Hernández J., Morales-Calderon M., Calvet N., Hartmann L., Muzerolle J., Gutermuth R., Luhman K. L., Stauffer J., 2010, ApJ, 722, 1226
- Indebetouw et al. (2005) Indebetouw R. et al., 2005, ApJ, 619, 931
- Jarrett et al. (2011) Jarrett T. H. et al., 2011, ApJ, 735, 112
- Jayawardhana, Mohanty & Basri (2003) Jayawardhana R., Mohanty S., Basri G., 2003, ApJ, 592, 282
- Kessler-Silacci et al. (2007) Kessler-Silacci J. E. et al., 2007, ApJ, 659, 680
- Kharchenko et al. (2005) Kharchenko N. V., Piskunov A. E., Röser S., Schilbach E., Scholz R., 2005, A&A, 440, 403
- Kirkpatrick et al. (1999) Kirkpatrick J. D. et al., 1999, ApJ, 519, 802
- Lada et al. (2006) Lada C. J. et al., 2006, AJ, 131, 1574
- Luhman (1999) Luhman K. L., 1999, ApJ, 525, 466
- Luhman (2000) Luhman K. L., 2000, ApJ, 544, 1044
- Luhman et al. (2003) Luhman K. L., Stauffer J. R., Muench A. A., Rieke G. H., Lada E. A., Bouvier J., Lada C. J., 2003, ApJ, 593, 1093
- Luhman (2004) Luhman K. L., 2004, ApJ, 617, 1216
- Luhman et al. (2005) Luhman K. L. et al., 2005, ApJL, 631, L69
- Luhman et al. (2008) Luhman K. L., Hernández J., Downes J. J., Hartmann L., Briceño C., 2008, ApJ, 688, 362
- Luhman et al. (2010) Luhman K. L., Allen P. R., Espaillat C., Hartmann L., Calvet N., 2010, ApJS, 186, 111
- Luhman (2012) Luhman K. L., 2012, ARA&A, 50, 65
- Luhman & Mamajek (2012) Luhman K. L., Mamajek E. E., 2012, ApJ, 758, 31
- McGovern et al. (2004) McGovern M. R., Kirkpatrick J. D., McLean I. S., Burgasser A. J., Prato L., Lowrance P. J., 2004, ApJ, 600, 1020
- Megeath et al. (2005) Megeath S. T., Hartmann L., Luhman K. L., Fazio G. G., 2005, ApJL, 634, L113
- Meyer, Calvet & Hillenbrand (1997) Meyer M. R., Calvet N., Hillenbrand L. A., 1997, AJ, 114, 288
- Morrow et al. (2008) Morrow A. L. et al., 2008, ApJL, 676, L143
- Muzerolle et al. (2003) Muzerolle J., Hillenbrand L., Calvet N., Briceño C., Hartmann L., 2003, ApJ, 592, 266
- Muzerolle et al. (2005) Muzerolle J., Luhman K. L., Briceño C., Hartmann L., Calvet N., 2005, ApJ, 625, 906
- Ochsenbein, Bauer & Marcout (2000) Ochsenbein F., Bauer P., Marcout J., 2000, A&AS, 143, 23
- Pascucci et al. (2009) Pascucci I., Apai D., Luhman K., Henning T., Bouwman J., Meyer M. R., Lahuis F., Natta A., 2009, ApJ, 696, 143
- Pascucci et al. (2013) Pascucci I., Herczeg G., Carr J. S., Bruderer S., 2013, ApJ, 779, 178
- Pecaut, Mamajek & Bubar (2012) Pecaut M. J., Mamajek E. E., Bubar E. J., 2012, ApJ, 746, 154
- Pecaut & Mamajek (2013) Pecaut M. J., Mamajek E. E., 2013, ApJS, 208, 9
- Petr-Gotzens et al. (2011) Petr-Gotzens M. et al., 2011, The Messenger, 145, 29
- Preibisch et al. (2002) Preibisch T., Brown A. G. A., Bridges T., Guenther E., Zinnecker H., 2002, AJ, 124, 404
- Riaz & Gizis (2008) Riaz B., Gizis J. E., 2008, ApJ, 681, 1584
- Riaz, Lodieu & Gizis (2009) Riaz B., Lodieu N., Gizis J. E., 2009, ApJ, 705, 1173
- Riaz et al. (2012) Riaz B., Lodieu N., Goodwin S., Stamatellos D., Thompson M., 2012, MNRAS, 420, 2497
- Rieke et al. (2004) Rieke G. H. et al., 2004, ApJS, 154, 25
- Robin et al. (2003) Robin A. C., Reylé C., Derrière S., Picaud S., 2003, A&A, 409, 523
- Scholz et al. (2007) Scholz A., Jayawardhana R., Wood K., Meeus G., Stelzer B., Walker C., O’Sullivan M., 2007, ApJ, 660, 1517
- Sicilia-Aguilar et al. (2006) Sicilia-Aguilar A., Hartmann L. W., Fürész G., Henning T., Dullemond C., Brandner W., 2006, AJ, 132, 2135
- Sicilia-Aguilar et al. (2007) Sicilia-Aguilar A., Hartmann L. W., Watson D., Bohac C., Henning T., Bouwman J., 2007, ApJ, 659, 1637
- Sivia & Skilling (2006) Sivia D. S., Skilling J., 2006, Data Analysis: A Bayesian Tutorial, Oxford University Press, ed. Oxford University Press
- Uchida et al. (2004) Uchida K. I. et al., 2004, ApJS, 154, 439
- White & Basri (2003) White R. J., Basri G., 2003, ApJ, 582, 1109
- Wright et al. (2010) Wright E. L. et al., 2010, AJ, 140, 1868