The Gaia-ESO Survey: Detailed Abundances in the Metal-poor Globular Cluster NGC 4372
Abstract
We present the abundance analysis for a sample of 7 red giant branch stars in the metal-poor globular cluster NGC 4372 based on UVES spectra acquired as part of the Gaia-ESO Survey. This is the first extensive study of this cluster from high resolution spectroscopy. We derive abundances of O, Na, Mg, Al, Si, Ca, Sc, Ti, Fe, Cr, Ni, Y, Ba, and La. We find a metallicity of [Fe/H] = -2.19 0.03 and find no evidence for a metallicity spread. This metallicity makes NGC 4372 one of the most metal-poor galactic globular clusters. We also find an -enhancement typical of halo globular clusters at this metallicity. Significant spreads are observed in the abundances of light elements. In particular we find a Na-O anti-correlation. Abundances of O are relatively high compared with other globular clusters. This could indicate that NGC 4372 was formed in an environment with high O for its metallicity. A Mg-Al spread is also present which spans a range of more than 0.5 dex in Al abundances. Na is correlated with Al and Mg abundances at a lower significance level. This pattern suggests that the Mg-Al burning cycle is active. This behavior can also be seen in giant stars of other massive, metal-poor clusters. A relation between light and heavy s-process elements has been identified.
Key Words.
Galaxy: Globular Cluster:Individual: NGC4372 – Stars:Abundances1 Introduction
Globular clusters (GCs) provide an exceptional laboratory for studying the star formation history of a galaxy because they are powerful tracers of the various components (halo, thick disk and bulge). Moreover, the ages, abundances and kinematics of these objects represent the fossil record of the galaxy formation process, since they are amongst the oldest objects in the Universe. Starting several decades ago, spectroscopy as well as photometry (Piotto et al., 2007; Gratton, Carretta & Bragaglia, 2012, e.g.) have shown that GCs are much more complex than previously imagined, in particular with the almost ubiquitous discovery of multiple populations. None of the scenarios proposed to date can fully account for the abundance trends observed in Galactic Globular Clusters (GGCs). Detailed chemical studies of large samples of GGCs are required to uncover the evolution of these objects. Providing high quality data on more GCs is clearly needed to strengthen any conclusion. We present here results of the first ever high-resolution spectroscopic analysis of the globular cluster NGC 4372 based on observations from the Gaia-ESO survey (Gilmore et al., 2012; Randich & Gilmore, 2012, GES, ).
The GES is a public spectroscopic survey using the high-resolution multi-object spectrograph FLAMES on the Very Large Telescope. Targeting more than 105 stars, GES covers all the major components of the Milky Way, from halo to star forming regions, providing a homogeneous overview of the distribution of kinematics and elemental abundances. The survey also maps a significant sample of more than 80 open clusters, covering all the accessible cluster ages and masses.
Ensuring that GES has maximal legacy impact is of key priority. Thus the survey has identified a suitable set of objects and fields for the calibration of the data in terms of astrophysical parameters and abundance ratios (Pancino et al. 2012). By including objects and fields that are a) well studied in the literature; b) in common with other large spectroscopic surveys; and/or c) with extremely well measured properties; the results can be put in context, compared with other surveys and when available combine different data-sets. The GES includes GGCs as calibrators, adding some relatively unstudied clusters to the ones already present in the ESO archive. To maximize the scientific output from the calibrator data-set, a good balance of mandatory, known and new/interesting GGCs has been included in the target selection. Within this context, this study is focused on the chemical abundances of NGC 4372. With limited spectroscopic data, nothing is known about any possible abundance variations of this metal-poor halo cluster. We present here an abundance analysis of a large number of elements (eg. light elements, -elements, iron peak elements and neutron-capture elements) and analyze its stellar population.
The vast majority of old GGCs studied in detail to date, with the possible exception of Rup 106 (Villanova et al., 2013), show the chemical signatures of hosting (at least) two stellar populations. Several other cases like Pal 12 (Cohen, 2004), Ter 7 (Tautvaišienė et al., 2004; Sbordone et al., 2005) or Ter 8 (Carretta et al., 2014) have been proposed as potential single population globular clusters but the small sample investigated does not allow for clear conclusions. We also note that all these objects except for Rup 106 are associated to the Sgr dwarf galaxy. There has been much improvement on the study of multiple populations within GGCs. The main evidence for this complexity comes from the presence of chemical inhomogeneities that in most cases are limited to light elements. Light elements like Li, C, N, O, Na, Mg, Al, are known to (anti-)correlate. The most outstanding signature is the Na-O anti-correlation, detected so far in every GC study (Carretta et al., 2009a; Carretta et al., 2009b), again with the likely exception of Rup 106. These anomalies have been observed also in old, massive extra-galactic GCs in Fornax (Letarte et al., 2006) and in the Large Magellanic Cloud (LMC) (Mucciarelli et al., 2009), but not in intermediate-age LMC clusters (Mucciarelli et al., 2014). A similar feature, often observed in some GCs but not all, is the anti-correlation between Al and Mg (Gratton et al., 2001; Carretta et al., 2009b). It is important to mention that such abundance trends are not seen in the halo field stars.
This spectroscopic evidence has been interpreted as the signature of material processed during H-burning by high temperature proton-capture reactions (like the Ne-Na and Mg-Al cycles). Several theoretical models have been proposed in order to describe the formation and early evolution of GCs (D’Ercole et al., 2008). The preferred explanation involves a self-enrichment scenario, within which two subsequent generations of stars co-exist in globular clusters and where the second is formed from gas polluted by processed material produced by massive stars of the first (Caloi & D’Antona, 2011). Several sources of processed ejecta have been proposed: the slow winds of intermediate-mass AGB stars (D’Antona et al., 2002), fast rotating massive stars (Decressin et al., 2007) and massive binaries (de Mink et al., 2009). A recent attractive alternative has been proposed by Bastian et al. (2013), that implies only a single burst of star formation. They postulate that the polluted gas concentrates in the center and is acquired by low mass stars of the first (and only) generation via disk accretion while they are in the pre-main sequence fully convective phase. This scenario has the distinct advantage that it does not require a very large percentage of the original cluster population to have been lost. In addition, variations in heavier elements have also been found in some massive GCs such as Centauri (Marino et al., 2011), M54 (Carretta et al., 2010b), M22 (Marino et al., 2009), NGC 1851 (Carretta et al., 2011), Terzan5 (Ferraro et al., 2009), NGC 2419 (Cohen et al., 2010), M2 (Lardo et al., 2013; Yong et al., 2014) and M75 (Kacharov, Koch & McWilliam, 2013). They are generally thought to be the vestige of more massive primitive dwarf galaxies that merged with the Galaxy. Therefore, they have important implications for the hierarchical merging scenario of galaxy formation (Joo & Lee, 2013). In this paper, we use the widely accepted terminology of first and second generation of stars referring to the unpolluted and polluted populations regardless of the formation scenario.
NGC 4372 is an old and very metal-poor globular cluster that despite its low degree of central concentration, has received little attention, mostly due to reddening problems. It is located close to the Galactic disk and in a dusty area of the Southern Musca Constellation (RA = 12:25:45.40, Dec=-72:39:32.4; l=300.99∘, b=-9.88∘ Harris, 1996, 2010 edition). At a Galactocentric distance of Rgc = 7.1 Kpc, NGC 4372 is listed in the Harris catalog as having a low metallicity of [Fe/H] = -2.17 and a fairly high reddening of E(B-V) =0.39, which makes it a visually challenging object. In addition, NGC 4372 has been claimed to be dynamically associated with NGC 2808 (Casetti-Dinescu et al., 2007).
Early photometric studies of this cluster (Hartwick & Hesser, 1973; Alcaino, 1974; Brocato et al., 1996) already revealed a color-magnitude diagram characteristic of very metal-poor clusters, with a well-defined horizontal branch that extends far to the blue, and with a large and variable absorption. Alcaino et al. (1991) present BVRI CCD photometry in two overlapping fields. By comparison with theoretical isochrones, they derive an age of 15 4 Gyr. In a more recent study, Rosenberg et al. (2000) present a homogeneous photometric catalog of 39 GGCs in the southern hemisphere. They report for NGC 4372 a foreground reddening of E(B-V) = 0.42 , horizontal branch (HB) level of VHB = 15.30 with a HB ratio (B-R)/(B+V+R) = 1.00. They explain the broadening of the CMD sequences as a consequence of the high differential reddening probably due to the nearby Coal-sack Nebulae. A de-reddened, narrower CMD has recently been constructed by Kacharov et al. (2014)
Spectroscopic studies of NGC 4372 are limited to medium-resolution spectra. Using the near-infrared Ca ii triplet, Geisler et al. (1995) determine a mean metal abundance of [Fe/H] = -2.10 0.04 from 11 giant stars. They also report a mean heliocentric radial velocity of = 73.2 1.4 km/s. Using a similar technique, Rutledge, Hesser & Stetson (1997) estimate a value of [Fe/H] = -2.03 0.03 on Zinn & West (1984, ZW84) scale and a value of [Fe/H]= -1.88 0.05 on Carretta & Gratton (1997, CG97) scale. A more updated value of [Fe/H]=-2.19 0.08 is provided by Carretta et al. (2009a). This value is determined from the previously mentioned Ca ii triplet data but based on a more accurate metallicity scale. No further chemical study has been performed.
In this paper, we present the first extensive study of NGC 4372 from high-resolution spectroscopy. We perform an abundance analysis of a large number of elements and analyze the stellar population of the cluster. This paper is organized as follows: Section 2 describes the observations and data reduction and Section 3 describes the methodology used to obtain the atmospheric parameters and chemical abundances. Section 4 presents our results including analysis of iron-peak elements, -elements and any (anti-)correlation. Finally, Section 5 presents a summary of our main results.


2 Observations and Data Reduction

The present work is based on the data collected by the GES from the beginning of the Survey up to the end of June 2013. These observations are referred to as gesiDR2iDR3 and are available inside the GES collaboration. As explained in Gilmore et al. (2012), the GES consortium is structured in several working groups, WGs, having specific duties from target selection and data reduction to delivery of science data. The data reduction has been performed using a workflow specifically developed for and by GES that runs the ESO public pipeline (Modigliani et al., 2004; Modigliani & Larsen, 2012). The pipeline has been optimized to reduce GES data and performs automatically sky subtraction, barycentric correction and normalization. In addition the pipeline calculates radial velocities and a first guess of the rotational velocities. A quality control is performed using the output parameters from the ESO pipeline, by a visual inspection of the spectra and by the analysis of the signal-to-noise ratio of the spectra. A detailed description of the data reduction methods can be found in Sacco et al. (2014).
The present study makes use only of the UVES observations. While a small number of fibers can be dedicated to UVES, their spectra have a higher resolution than GIRAFFE and, just as important, have ten times wider spectral coverage. For this reason, UVES data are crucial for studies of precise chemical abundances of a large number of elements. As explained in Section 3, this paper makes use only of Concepcion Node atmospheric parameters and chemical abundances rather than the recommended GES values. Unfortunately, this Node does not analyze GIRAFFE spectra. Although ideally the used of GES GIRAFFE spectra for NGC 4372 would strengthen the conclusion of this paper, the different techniques and methods employed, for this specific science case, would introduce an undesirable heterogeneity.
In this paper, we present a detailed chemical abundance analysis of seven red giant branch (RGB) stars observed with UVES. The stars are observed in the set-up with central wavelength 580 nm. The spectra are taken in two arms, resulting in a wavelength coverage of 470-684 nm with a gap of 5 nm in the center. The FLAMES-UVES fibers have an aperture on the sky of 1”, resulting in a resolving power of R=47000. The observations were taken between March 11 and March 16 of 2012 with a mean signal-to-noise ratio in the spectrum of 50. Targets for UVES were high probability cluster members and in particular evolved stars. Figure 1 shows the spatial distribution of the 7 RGB stars covering a wide area around NGC 4372 while Figure 2 presents color-magnitude diagrams of the cluster with the analyzed stars indicated. Target selection for globular clusters has been made by WG5 (Calibrators and Standards; coordinator: E. Pancino). More details can be found in Pancino et al. (2015, in prep).
The radial velocity information, available for all the targets observed, is determined within WG8 by cross-correlation against real and synthetic templates. The typical error on the radial velocities of UVES targets is about 0.4 km s-1. The mean radial velocity value for the seven targets is = 72.6 1.3 km/s while the dispersion is 3.6 km/s. The mean radial velocity is in excellent agreement with the value found by Geisler et al. (1995) of =73.2 1.4 km/s where the error is given by the standard error of the mean. More recently, Kacharov et al. (2014) present an extensive kinematic study of this cluster using FLAMES/GIRAFFE observations of 131 stars. They find a mean radial velocity of vr=75.9 0.3 km/s and a central velocity dispersion of = 4.5 0.3 km/s. As part of the Gaia-ESO survey the kinematics of seven GGCs is present in Lardo et al. (2014). They obtained from FLAMES/GIRAFFE spectra of more than 100 stars a mean radial velocity of vr=75.2 0.4 km/s with a velocity dispersion of 3.9 km/s, confirming the membership of our objects. The stellar parameters of stars analyzed in our study are summarized in Table 1. Photometric magnitudes of the observed stars are compiled by GES and presented in Table 2.
| Cnamea | vrad | SNRb | log(g) | ||||
| (km/s) | (K) | (dex) | (km/s) | (dex) | |||
| 1 | 12250638-7243067 | 68.6 0.5 | 51.17 | 4586 86 | 0.70 0.20 | 1.56 0.10 | -2.23 0.21 |
| 2 | 12250660-7239224 | 67.9 0.3 | 34.63 | 4646 56 | 1.17 0.15 | 1.68 0.03 | -2.22 0.15 |
| 3 | 12253419-7235252 | 72.7 0.7 | 55.73 | 4527 33 | 0.55 0.07 | 1.50 0.17 | -2.15 0.07 |
| 4 | 12253882-7245095 | 76.0 0.6 | 45.45 | 4656 114 | 1.19 0.47 | 1.56 0.20 | -2.21 0.20 |
| 5 | 12260765-7236514 | 75.2 0.5 | 71.14 | 4466 38 | 0.55 0.09 | 1.65 0.05 | -2.20 0.17 |
| 6 | 12264293-7241576 | 71.0 0.7 | 44.35 | 4712 87 | 1.19 0.21 | 1.55 0.13 | -2.15 0.12 |
| 7 | 12264875-7239413 | 76.9 0.4 | 43.89 | 4633 68 | 0.84 0.34 | 1.54 0.05 | -2.44 0.16 |
| a GES object name. It is formed from the coordinates of the object splicing the RA in hours, minutes and seconds (to 2 decimal places) and the Dec in degrees, minutes and seconds (to 1 decimal place) together, including a sign for the declination. | |||||||
| b Mean signal-to-noise ratio in the spectrum. | |||||||
| Cnamea | ||||||||||
| (mag) | (mag) | (mag) | (mag) | (mag) | (mag) | (mag) | (mas/yr) | (mas/yr) | ||
| 1 | 12250638-7243067 | 14.70 | 13.22 | 11.52 | 10.30 | 9.61 | 9.44 | 0.57 | -6.10 | 4.80 |
| 2 | 12250660-7239224 | 15.22 | 13.80 | 12.11 | 10.86 | 10.15 | 9.98 | 0.57 | -12.40 | 6.70 |
| 3 | 12253419-7235252 | 14.83 | 13.21 | 11.29 | 9.92 | 9.18 | 8.97 | 0.59 | -7.10 | 8.60 |
| 4 | 12253882-7245095 | 15.15 | 13.84 | 12.21 | 11.10 | 10.43 | 10.28 | 0.54 | -5.50 | 9.90 |
| 5 | 12260765-7236514 | 14.66 | 13.12 | 11.25 | 9.92 | 9.19 | 8.97 | 0.58 | -13.80 | 9.00 |
| 6 | 12264293-7241576 | 15.08 | 13.76 | 12.14 | 10.98 | 10.30 | 10.16 | 0.54 | -1.10 | 0.60 |
| 7 | 12264875-7239413 | 15.16 | 13.82 | 12.08 | 10.87 | 10.17 | 9.98 | 0.55 | -0.10 | 13.40 |
| a GES object name. It is formed from the coordinates of the object splicing the RA in hours, minutes and seconds (to 2 decimal places) and the Dec in degrees, minutes and seconds (to 1 decimal place) together, including a sign for the declination. | ||||||||||
| b Magnitudes from APASS (AAVSO photometric All-sky Survey). | ||||||||||
| c Magnitudes from 2MASS (Skrutskie et al., 2006). | ||||||||||
| d Reddening values from the Galactic dust extinction (Schlegel, Finkbeiner & Davis, 1998). | ||||||||||
| e Proper motion in RA and Dec from UCAC (Zacharias et al., 2010) . | ||||||||||
| El. | Methoda | Nlinesb | 1 | 2 | 3 | 4 | 5 | 6 | 7 | Meanc |
| SYNTH | 1 | 0.22 | 0.36 | 0.53 | 0.46 | 0.67 | 0.39 | 0.80 | 0.44 0.07 | |
| SYNTH | 2 | 0.39 | 0.91 | 0.53 | 0.69 | 0.07 | 0.67 | 0.53 | 0.54 0.13 | |
| EW | 4 | 0.41 | 0.69 | 0.37 | 0.45 | 0.20 | 0.53 | 0.62 | 0.44 0.07 | |
| EW | 2 | 0.65 | 1.16 | 0.85 | 1.12 | … | 1.01 | 0.01 | 0.96 0.10 | |
| EW | 1 | … | … | 0.46 | 0.52 | 0.48 | … | 0.77 | 0.48 0.02 | |
| EW | 18 | 0.25 | 0.29 | 0.19 | 0.24 | 0.22 | 0.28 | 0.60 | 0.24 0.02 | |
| SYNTH | 1 | -0.04 | -0.09 | -0.14 | -0.14 | -0.03 | -0.11 | -0.01 | -0.09 0.02 | |
| EW | 14 | 0.29 | 0.40 | 0.24 | 0.30 | 0.23 | 0.38 | 0.53 | 0.31 0.03 | |
| EW | 100 | -2.23 | -2.22 | -2.15 | -2.21 | -2.20 | -2.15 | -2.44 | -2.19 0.02 | |
| EW | 6 | -0.38 | -0.20 | -0.33 | -0.37 | -0.36 | -0.28 | -0.15 | -0.32 0.03 | |
| EW | 6 | 0.07 | -0.03 | 0.14 | -0.03 | -0.06 | 0.07 | 0.06 | 0.03 0.03 | |
| SYNTH | 1 | 0.05 | 0.01 | 0.03 | 0.00 | 0.10 | 0.09 | 0.06 | 0.05 0.02 | |
| SYNTH | 1 | -0.29 | -0.15 | -0.09 | -0.16 | -0.11 | -0.17 | -0.23 | -0.16 0.03 | |
| SYNTH | 1 | 0.09 | -0.03 | -0.36 | -0.31 | -0.06 | -0.06 | 0.14 | -0.12 0.08 | |
| a Method used in the abundance determination: SYNTH (Spectrum-synthesis method), EW (Equivalent Width method). | ||||||||||
| b Average number of lines employed in the abundance determination. | ||||||||||
| c Values obtained excluding star #7. | ||||||||||
| d Values obtained from the average of Ti i and Ti ii. | ||||||||||

| =70 (k) | log g=0.19(dex) | =0.14 (km/s) | ||||
| 0.04 | 0.07 | 0.03 | 0.04 | 0.09 | 0.15 | |
| 0.00 | -0.07 | -0.03 | 0.04 | 0.09 | 0.29 | |
| 0.11 | -0.08 | -0.07 | 0.02 | 0.15 | 0.16 | |
| 0.02 | 0.04 | 0.03 | 0.04 | 0.07 | 0.21 | |
| 0.04 | 0.00 | -0.02 | 0.02 | 0.05 | 0.03 | |
| 0.08 | -0.01 | -0.06 | 0.02 | 0.10 | 0.04 | |
| 0.12 | 0.16 | 0.10 | 0.05 | 0.23 | 0.05 | |
| 0.00 | 0.07 | -0.04 | 0.05 | 0.09 | 0.07 | |
| 0.14 | 0.01 | -0.10 | 0.03 | 0.17 | 0.07 | |
| 0.13 | 0.01 | -0.08 | 0.02 | 0.15 | 0.08 | |
| 0.03 | 0.07 | -0.01 | 0.06 | 0.10 | 0.04 | |
| -0.09 | -0.06 | -0.02 | 0.06 | 0.13 | 0.07 | |
| 0.12 | 0.14 | 0.08 | 0.07 | 0.21 | 0.17 | |
| Note.- The sensitivity determination was performed for star . | ||||||
| is the error in the measurements. | ||||||
| is the squared root of the sum of the squares of the individual errors. | ||||||
| is the mean observed dispersion. | ||||||
3 Atmospheric Parameters and Abundance Analysis
The astrophysical parameters obtained from the analysis of the gesiDR2iDR3 data set will be part of the first Gaia-ESO public release of advanced data products. Within WG11, the spectroscopic analysis of UVES data is performed by 13 sub-groups, so-called Nodes. A multiple parallel analysis of the full data set has been implemented where different Nodes use different methodologies. Unfortunately, only a small number of Nodes reported atmospheric parameters for NGC 4372 stars. As explained in Smiljanic et al. (2014), GES recommended parameters are computed only if at least 3 Nodes provided parameters for a given star. This decision is made based on internal policy rather than the reliability of the values. We decided to make use of Concepcion Node atmospheric parameters and chemical abundances during the following analysis. A critical evaluation of the performance of Concepcion Node, based on a series of calibrators, is presented in (Smiljanic et al., 2014). In addition, Concepcion Node is the only one that provide, for the 7 stars observed in NGC 4372, key elements such as O or Na.
The atmospheric parameters for NGC 4372 reported by the Concepcion Node correspond to the GES iDR1 (internal data release 1) and were determined by at least 5 different Nodes in a system of multiple parallel analysis. The methodology and codes used by each Node are described in detail in Appendix A of Smiljanic et al. (2014) and they range from the classical method of equivalent width (EW) to the use of libraries of observed and/or synthetic spectra. This strategy has two main advantages: 1) Ensure that all sources of errors are well-understood and quantified, including method-dependent effects, 2) Ensure that all types of objects can be properly analyzed. To guarantee the homogeneity of the final results, a number of constraints have been imposed. These constraints include: the use of a common line list (Heiter et al., 2015, in prep), the use of one single set of model-atmospheres (the MARCS models, Gustafsson et al. (2008)), the use of a single synthetic spectrum library (de Laverny et al., 2012; Recio-Blanco et al., 2015, in prep), a common solar zero point (Grevesse, Asplund & Sauval, 2007) and the analysis of common calibration targets. In order to understand the precision and accuracy of the atmospheric parameters, GES makes use of the Gaia benchmark stars and a set of calibration clusters. The accuracy is judged by the ability of a given Node to recover the reference atmospheric parameters of the benchmark stars from their analysis. The precision is judged by the ability of a Node to reproduce their own results from multiple analysis of the same star. A detail explanation of the performance of each Node as well as how the atmospheric parameters were determined can be found in Smiljanic et al. (2014). Table 1 summarizes the derived atmospheric parameters for NGC 4372 stars. The error reported for each parameter corresponds to the dispersion among the results from different methodologies. This method-to-method dispersion is defined as the degree to which multiple methodologies can agree on the abundance of a star. Although this dispersion is not properly the physical uncertainty of the values, it is a good indicator of the precision and is adopted as the typical uncertainty. To further investigate the reliability of these values Fig. 3 shows the derived atmospheric parameters of the stars compared with those derived from isochrones.
The chemical abundances for Mg, Al, Si, Ca, Ti, Cr and Ni were obtained using EWs of the spectral lines. The EWs were determined with the automatic code DAOSPEC (Stetson & Pancino, 2008). GALA (Mucciarelli et al., 2013) was used to determined the elemental abundances. To complete the analysis and include other key elements the abundances of O, Na, Sc, Y, Ba, and La were also obtained. For this set of elements whose lines are affected by blending, the spectrum-synthesis method were used. The local Thermodynamic Equilibrium (LTE) program MOOG (Sneden, 1973) was used for this purpose. Five synthetic spectra having different abundances for each line were calculated, and the best-fitting value estimated as the one that minimizes the RMS scatter. Only lines not contaminated by telluric lines were used. For both methods, the GES guidelines regarding the use of the GES line list (Heiter et al., 2015, in prep), the use of MARCS model atmospheres (Gustafsson et al., 2008) and the use of Grevesse, Asplund & Sauval (2007) solar-zero point were strictly followed. In addition, the Na abundance was recomputed and a non-LTE correction was applied based on Mashonkina, Shimanskiĭ & Sakhibullin (2000). All the used Na abundances are NLTE corrected. We refer the reader to Smiljanic et al. (2014) for a detailed description of the abundance analysis. The chemical abundances of the observed stars are presented in Table 3.
An internal error (star-to-star) analysis of the derived abundances has been performed to properly quantify the internal spread of abundance within a cluster.
Table 4 lists the two primary sources of errors contributing to the total budget (): the uncertainties in the measurements and the uncertainties associated with the atmospheric parameters. The parameter corresponds with the mean chemical abundance variation due to error on the EW measurements. Uncertainties in the measurements of EWs are computed by DAOSPEC (Stetson & Pancino, 2008). These confidence intervals estimate the goodness of the fit but also take into account the quality of the spectrum (resolution, S/N, spectra defects, …). These EW errors , , are used by GALA (Mucciarelli et al., 2013) to obtain the uncertainty on the abundance of each element by varying the EW by 1. For the elements whose abundance was obtained by spectrum-synthesis was obtained as the error given by the fitting procedure. An internal error analysis was performed by varying , log(g) and and redetermined abundances of star , selected as having representative atmospheric parameters. Parameters were varied by = +70 K, log(g)= +0.19 and =+0.14 km s-1, which correspond with the mean error of the sample parameters. We note that these parameter variations are smaller than the standard steps in the MARCS model grid. The MARCS model interpolator22 2 The program and a detailed user manual are available on the MARCS web site: http://marcs.astro.uu.se. has been used to generate intermediate models from the initial grid. The program interpolates the thermal structure (T), the electronic pressure (Pe), the gas pressure (Pg), the opacity () and the micro turbulence velocity () as a function of Teff, log(g) and metallicity [M/H]. The interpolator has been extensively tested on a previous grid of MARCS models considering the following range of parameters: 3800 K < Teff < 7000 K, 0.0 < log g < 5.0, -4.0 < [M/H] < 0.0 (Masseron, 2006). The interpolation is optimized to account for non-linearities in the grid and the new interpolated model must lie inside a complete cube of existing models in the parameter space (Teff, log g, [M/H]). With the actual grid parameter steps, maximum errors in the interpolated quantities remain below 0.25 and a few for Pg and Pe. Within these limits, we do not consider that the error budget might increase dramatically and that the mean method-to-method dispersion drives the sensitivity to atmospheric parameter variations. This estimation of the internal error was performed following the prescription of Marino et al. (2008). The final total error, (), has been computed as the square root of the sum of the squares of the individual errors. Table 4 lists also the observed star-to-star dispersion (). We remark that our goal is to search for evidence of star-to-star intrinsic abundance variation in each element by comparing the observed dispersion ) and the internal errors (). For this reason, external sources of error as systematics that do not affect relative abundances are not considered.
4 Results
4.1 Chemical homogeneity of the cluster
Chemically inhomogeneous populations are observed in virtually all massive, old globular clusters well-studied to date, but not in open clusters, with the possible exception of NGC 6791 (Geisler et al., 2012, but see Bragaglia et al. (2014) and Cunha et al. (2014)). Studying the chemical homogeneity or inhomogeneity of a cluster is necessary to better understand the mechanism of their formation. A large body of evidence now shows that the stars in a GC do not share the same chemical composition (Gratton, Carretta & Bragaglia, 2012). As a general rule we can define a globular cluster as an object homogeneous in its Fe content and most other heavy elements, but the light elements Li, C, N, O, Na, Mg and Al can show substantial intracluster variations. We investigate the degree of inhomogeneity of the abundances of cluster members in NGC 4372.
Figure 4 shows the abundance ratios versus [Fe/H] for individual member stars in the cluster. In each panel, the intersection of the dashed lines delimit a 1 area around the average value. Star-to-star error bar is indicated. Star 7 stands out as slightly more metal poor than the main body of cluster members. The -elements of this peculiar star also stand out from the cluster mean abundances, except for Mg. The radial velocity and stellar parameters for this object shown in Table 1 are in agreement with those of the rest of the observed stars but the distinct chemical pattern of this star suggests wither that it has some kind of anomaly or it may not be a member. The possibility of star 7 being in a binary system would likely alter its radial velocity as well as artificially lower its derived metallicity due to increased continuum flux. As part of the quality control, GES final products include two binary flags: a) a visual inspection of the cross-correlation function (CCF), computed before co-adding multi-epoch observations, has been performed. A star is flagged as a candidate double-lined spectroscopic binary, if the CCFs are characterized by the presence of more than one peak or a single peak with strong asymmetries; b) a star is classified as a single-lined spectroscopic binary if the median absolute deviation of multi-epoch repeated measurements of the radial velocity is larger than twice the error on the radial velocity. None of the NGC 4372 observed stars have been flagged as binary candidates. Given its spatial location, velocity, position in the CMD and low metallicity, it seems very unlikely that this is a field star. Kacharov et al. (2014) show that according to the prediction of the Besancon Galactic model, only a few field stars with that velocity are expected in the direction of NGC 4372 where none of them are more metal-poor than -1.8 dex. This support the view that star 7 is a cluster member. Lapenna et al. (2014) suggest that NLTE effects driven by over ionization mechanisms are present in the atmosphere of AGB stars and significantly affect FeI lines, while leaving FeII features unaltered. This effect could underestimate the metallicity of AGB stars. The low metallicity value of this peculiar star could be due to the fact that it is an AGB star. It is still unclear why the -elements of this star are also significantly different. To be cautious and conservative, we exclude star from the analysis.
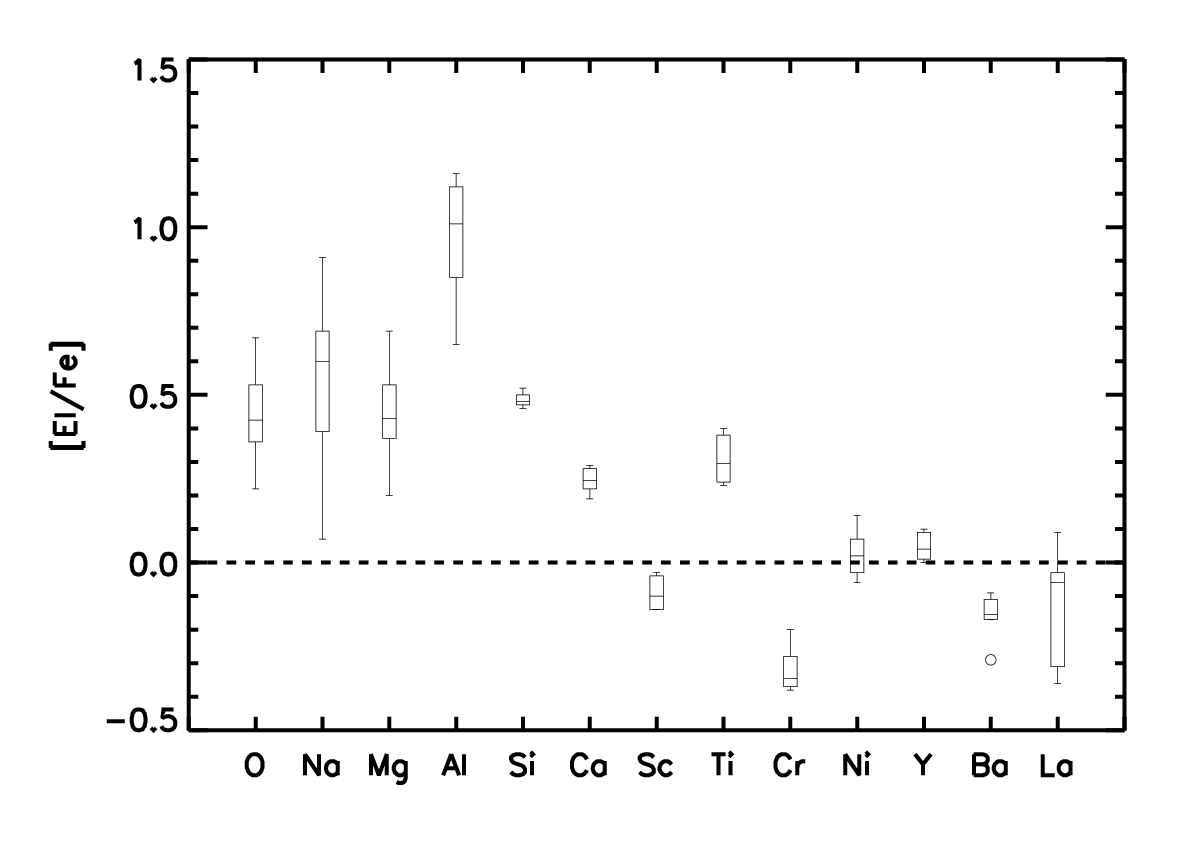
Fig. 5 presents the abundance pattern analyzed in NGC 4372. The box plot illustrates the median and the interquartile range (IQR) of the derived values. Possible outliers are also included where an outlier is defined if it deviates by more than 1.5 IQR. A large abundance ratio range is present for O, Na, Mg and Al. The star-to-star variations are smaller for the heavier elements. La presents a large abundance range but we note that the errors in the derived abundances of Sc and La are very large. For both elements, the spectrum-synthesis method with only a single line (Sc ii 5684.202 and La ii 5122.995 ) was used to derived the abundances. The sensitivity of the derived abundances for these two elements to the atmospheric parameters, and specifically to Teff and log g (see Table 4), is very significant and any conclusion drawn from these two elements should be treated with caution.To further investigate the degree of homogeneity of the abundances, we compare the scatter produced by internal errors, (), with the observed dispersion in the chemical abundances, (). These values correspond to columns 6 and 7 of Table 4. One can consider inhomogeneity when the intrinsic scatter is significantly higher than the expected dispersion given by the internal errors. If we exclude star 7 from the error estimation, a clear intrinsic spread can be identified only in O, Na and Al.

4.2 Iron and Iron-peak elements
We obtain a mean metallicity for NGC 4372 of [Fe/H]= -2.23 0.10. Figure. 4 shows no evidence for an intrinsic Fe abundance spread with the exception of star 7. As discussed in the previous section, this star is anomalous in its chemical behavior and we prefer to exclude it from cluster means. The issue of intrinsic metallicity spreads in GGCs is of great current interest. Such spreads are found generally only in the most luminous GGCs, with MV -8.5. NGC 4372 has MV = -7.8 so it is unlikely to host an intrinsic Fe abundance spread. However, we do note that Geisler et al. (1995) did find one of their sample of 11 stars to be significantly (about 0.5 dex) more metal-poor than the rest. This star, like star 7, also had a velocity compatible with membership. Excluding star 7, we found a mean [Fe/H] value of:
[Fe/H]= -2.19 0.03
The first attempt to derive a metallicity for NGC 4372 was by Zinn & West (1984, ZW84) obtaining a value of [Fe/H]= -2.08 0.15. Most recently, Geisler et al. (1995) analyzed medium-resolution spectra of ten giant stars and obtain, through the near-infrared Ca ii triplet technique, a mean metallicity of [Fe/H]=-2.10 0.04. Several other authors have attempted to derive the metallicity based on similar techniques but using different scales with a variety of results (eg. [Fe/H]ZW84=-2.03; Rutledge, Hesser & Stetson (1997)). Carretta et al. (2009c) adopt a new scale that is a fundamental shift from the older and widely used ZW84 metallicity scale. The authors argue that this traditional scale was calibrated against only a handful of high-dispersion spectroscopic [Fe/H] values available at that time. Carretta et al. (2009c) define an accurate and updated metallicity scale using high-dispersion and high signal-to-noise spectroscopic measures of 19 GCs covering the metallicity range of the bulk of GGCs. Based on this scale they provide a value of [Fe/H]=-2.19 0.08 for NGC 4372 metallicity, based on Geisler et al. (1995) Ca ii triplet data. This updated result is in excellent agreement with our metallicity. The RMS scatter of our metallicity is a measure of the intrinsic spread of iron in the cluster. Carretta et al. (2009c) confirm that the scatter in Fe of most GCs is very small with an upper limit of less than 0.05 dex. Our observed scatter is consistent with that expected from errors and thus we conclude that there is no clear metallicity spread in NGC 4372, with the caveat that star 7 is considered either an outlier for other reasons or a non-member.
The chemical abundances for the iron-peak elements Sc, Cr and Ni are listed in Table 3. The values are solar within the errors except for the Cr abundance which is underabundant. Figure 6 shows the elemental abundance of each star compared with a variety of galactic and extra-galactic objects. We have included values from GGCs (Ivans et al., 2001; Lee, Carney & Habgood, 2005; Lee & Carney, 2002; Carretta, 2006; Carretta et al., 2009a; Carretta et al., 2010a; Villanova & Geisler, 2011; Muñoz, Geisler & Villanova, 2013; Koch & McWilliam, 2011); disk and halo stars (Fulbright, 2000; Reddy et al., 2003; Reddy, Lambert & Allende Prieto, 2006; Cayrel et al., 2004) and extra-galactic objects such as Draco, Sextans, Ursa Minor and Sagittarius dwarf galaxy and the ultra-faint dwarf spheroidals Boötes I and Hercules (Shetrone, Côté & Sargent, 2001; Sbordone et al., 2007; Ishigaki et al., 2014; Koch et al., 2008a; Koch et al., 2008b).
In general, we found that NGC 4372 stars have abundances of these elements which agree with those of other GCs and halo field stars of similar metallicity.
4.3 elements
All the elements listed in Table 3 (Mg, Si, Ca, Ti)33 3 Since O shows a star-to-star variation and the Na-O anti-correlation (see Section 4.4), it will be treated separately. are overabundant relative to the Sun. This is a common feature among almost every GC as well as among similarly metal-poor halo field stars in the Galaxy. A glaring exception is Rup 106 (Villanova et al., 2013), which shows solar element abundances. Figure 7 shows the -element (Mg, Si, Ca, Ti) ratios as a function of metallicity. For comparison purpose, we have included values from GGCs, disk and halo stars and extra-galactic objects. The sources of the data are the same as those given in the previous section. The elements in NGC 4372 seem to follow the same trend as GGCs and are fully compatible with halo field stars. Star 7 stands out from the cluster behavior, suggesting once again the singularity of this star. Excluding star 7, we derive for NGC 4372 a mean element abundance of:
Figure 8 represents the [/Fe] versus [Fe/H] relation. Different symbols and colors are defined as in Figure 7. Similar to halo Milky Way stars, GGCs show a constant overabundance of elements over a wide range of metallicities ([Fe/H] -1). Contrarily metal-rich dwarf spheroidal galaxies, [Fe/H] -2, tend to have a much lower content than Galactic objects at similar metallicity leading in some cases to even sub-solar ratios (Geisler et al., 2007). NGC 4372 falls in a region where both Galactic and extraGalactic objects overlap in their element content so it is not possible to draw conclusions regarding its origin from this diagram.


4.4 Na-O anticorrelation
The Na-O anticorrelation is the classical signature of the process of proton-capture reactions in H-burning at high temperature in a previous generation of stars. All GGCs studied in detail to date show this feature with the possible exception of Ruprecht 106 (Villanova et al., 2013). It is important to mention that such abundance trends are not seen in the halo field stars with similar metallicity. As described in the Introduction, this chemical signature has been proposed to define a GC (Carretta et al., 2010c). Figure 9 shows the Na-O abundances in the stars of our sample. For comparison purposes, abundances of GGCs and halo and disk field stars have been overplotted. In addition, two distinct Na-O anticorrelations have been over-plotted as blue solid lines, which correspond to the dilution models determined by Carretta et al. (2009b). One is O richer and is represented by the trend of the stars in NGC 7078 (M15) ([Fe/H]=-2.31) while the other is O poorer and is represented by the trend of the stars in NGC 2808 ([Fe/H]=-1.51). Following Carretta et al. (2009b) we have obtained the dilution model for NGC 4372. The red dash-dotted line was obtained using the full sample and the dashed line excludes star . NGC 4372 stars have a clear intrinsic dispersion and apparent anti-correlation, which corroborate the chemical inhomogeneities found in section 4.1. Figure 9 confirms the initial assumption that NGC 4372 is a multiple population GC. Star poses a value of [O/Fe] significantly smaller than the rest of the sample. This star does not follow the Na-O anti correlation describe by the rest of the stars in NGC 4372. The O abundances were obtained using the line 6300.30 . This line is significantly weaker in star than in the rest of the sample. In addition, NGC 4372 stars inhabit an area in the figure that follows the general GCs trend, although our sample lies at the high [O/Fe] end.
Some interesting characteristics can be identified among our sample. One star is very Na-poor/O-rich, which corresponds to the putative primordial stellar component, while a group of Na-rich/O-poor stars would be associated with a second generation of stars. However the low number statistics can not confirm that split. Our sample does not seem to show any star with very large O-depletion which would lie in the Extreme region, resembling the behavior of other metal-poor clusters such as NGC 7078 (M15), NGC 7099 or NGC 4590 (Carretta et al., 2009b).
The dilution model considered by Carretta et al. (2009b) to explain the Na-O anti-correlation (Fig. 9, blue and red lines), makes the basic assumptions: a) the polluting material has a well-defined composition and b) that polluting material is then diluted with a variable amount of primordial material producing the characteristic pattern of the Na-O anti-correlation. The minimum Na and maximum O abundances in each cluster represent the original Na and O composition of the cluster. NGC 4372 has abundances for O slightly high compared with the sample of Carretta et al. (2009b). High values of O content (as an -element) would imply a marginal contribution by type Ia SNe to their original composition. However, the rest of the abundances (Mg, Si, Ca and Ti) analyzed in NGC 4372 are full compatible with GGCs (Fig.7 and 8). The apparent offset of the Na-O anti-correlation observed in Fig. 9 could indicate that NGC 4372 was formed in an environment with high O for its metallicity.

4.5 Mg-Al cycle


In addition to the CNO and Ne-Na cycle, there is evidence that the Mg-Al cycle is also active in GC polluters. Models predict that Al should show correlations with elements that are enhanced by the action of the Ne-Na (such as Na) and Mg-Al cycles and should anti-correlate with elements that are depleted in H-burning at high temperature (such as O and Mg) (Gratton, Carretta & Bragaglia, 2012, see discussion in). We analyze the abundances of some proton-capture elements to identify any (anti-)correlation in the cluster.
The pattern of abundances of the elements participating in proton-capture reactions (Na, Al, Mg, Si) observed in NGC 4372 giant stars is summarized in Figure 10 and Figure 11. The level of scatter in all these plots is significant. For comparison purposes, abundances of GGCs and halo and disk field stars have been over-plotted. If the temperature is high enough, one should expect some degree of anti correlation between Mg and Al. However the production of Al at the expense of Mg via the MgAl-cycle does not result into such a well-defined anticorrelation as the Na-O one (Langer & Hoffman, 1995). In fact, large variations in Al are often accompanied by much smaller changes in Mg abundances (Carretta et al., 2009a). The Mg-Al behavior in NGC 4372 (Figure 10) presents similar features to the ones found in studies of other GGCs (Carretta et al., 2009a).
A clear Al spread is present in our sample with a star-to-star variation range in the Al abundances of 0.5 dex (excluding star 7). However we need to consider the potential influence of NLTE effect in Al abundances. Thygesen et al. (2014) show that there is a non negligible NLTE effect on at least some Al lines. This NLTE effect correlates with Teff where cooler stars would show stronger negative NLTE correction that warmer ones. Taking into account the small range of stellar parameters (and in particular Teff) of our sample stars, the Al spread should not be affected significantly by NLTE corrections. On the other hand, the larger uncertainty on Mg suggests that Mg may be consistent with no spread. The correlation detected among stars of NGC 4372 follows the behavior displayed by GGC stars with a clear distinction from disk and halo field stars. Unlike the well-known O-Na anti correlation, the Mg-Al anti correlation is more difficult to reproduce in simulations (Denissenkov et al., 1998; Ventura et al., 2001). Carretta et al. (2009a) show that Al-rich and Mg-depleted stars are present only in massive clusters (NGC 2808, NGC 6388, NGC 6441), metal-poor clusters (NGC 6752) or both (NGC 7078 = M15). In those clusters a clear Mg-Al anti correlation is observed even among main sequence stars (Bragaglia et al., 2010). More precise Mg values would be required to clarify the present of a Mg spread in NGC4372. The presence of a Mg-Al anti correlation in NGC4372 would indicate that the polluted generation has been enriched by material from stars where the Mg-Al burning cycle was active.
Top panels in Figure 11 show the abundances of elements involved in the Ne-Na, Mg-Al cycles of proton-capture reactions in high temperature H-burning. The dotted red line in each panel of Figure 11 corresponds to a linear fit of the sample (excluding star ) where the parameter represents the slope of the fit with the sigma error. The Pearson correlation coefficient, r, is also shown in each panel. Carretta et al. (2009a) found that stars with extreme Al overabundance also show Si enhancement with respect to the remaining stars in the same cluster. Again, this effect is limited to massive or metal-poor GGCs. The correlation between Si and Al abundances is a signature of production of 28Si from the Mg-Al cycle (Yong et al., 2005). The reaction producing this isotope becomes predominant in the Mg-Al cycle when the temperature is very high (exceeding T6 = 65 K) (Arnould, Goriely & Jorissen, 1999). The chemical pattern observed in these giant stars must be imprinted by a previous generation of massive stars to be capable to reach those high temperatures. If we exclude star 7 from the analysis (open red symbol), Si does not show large star-to-star variations but unfortunately the number of stars with reliable Si abundances are very limited. A clear Na-Al correlation is evident in our data. This is a reflection of the relation between Mg-Al and Ne-Na cycles (Gratton, Carretta & Bragaglia, 2012, see discussion in). In fact, Al and Na are predicted to be simultaneously enhanced when the Ne-Na and Mg-Al cycles are both acting. A Na-Mg relation is also identified in NGC 4372 stars. This behavior does not follow the general trend of GGCs and in fact one would expect to find a Na-Mg anti correlation. This relation is driven mostly by two stars only. Large Mg errors could cause this unexpected relation. More extensive samples of stars with accurate determinations of abundances are required for a more detailed analysis.


4.6 Heavy Elements
While light-element variations are well-known in GCs, intrinsic dispersion among heavier elements is less common. Most of the heavier elements (Z 30) are produced either by slow or rapid neutron-capture reactions (the so-called s- and r- processes). S-process happens in a different physical condition with respect to r-process and are thus likely to happen in different astrophysical sites. We measured the abundances of the neutron-capture elements: Y, La and Ba. These elements are mainly produced by the s-process at solar metallicity in which the neutron-capture time is much longer than the beta-decay lifetime. From our data we could not determine the r- and s-process ratio of neutron capture, because we did not measure a reliable abundance for a typical r-process species (e.g. Eu).
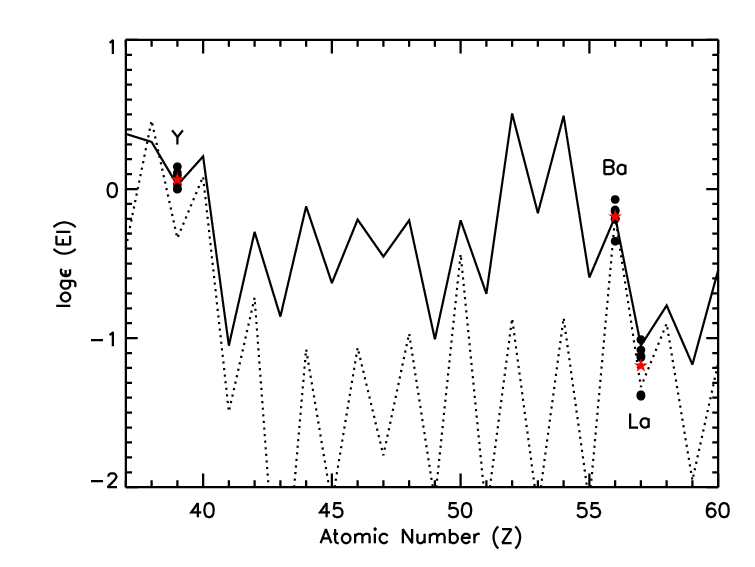
The abundance pattern of heavy neutron-capture elements (Y, Ba, La) is shown in Fig. 12. We have over plotted the pure r- and s-process patterns from Simmerer et al. (2004). The Ba abundance was used to set the zero point of the curves. Although the analysis includes very few points for any solid conclusion, the observed abundance of Y can be reproduced by a pure r-process pattern.
Figure 13 shows the abundance ratios of the heavy elements analyzed as a function of [Na/Fe] and [Al/Fe]. The [Ba/Fe] abundance ratio is sub-solar in agreement with recent studies which found that [Ba/Fe] decreases with low metallicites and becomes sub-solar at least in fields stars with [Fe/H] -2.0 (Gratton & Sneden, 1994; Fulbright, 2002, e.g.). These sub-solar values will agree with recent studies that indicate that metal-poor globular clusters primarily exhibit r-process signatures, due to the inefficiency of s-process in low metallicity environments (Gratton, Sneden & Carretta, 2004; Roederer et al., 2010; Koch, Côté & McWilliam, 2009). At [Fe/H] < -2 dex, the environment was not yet polluted by a sufficient number of low mass AGB stars and the average s-process abundances are low. All the elements show an apparent small dispersion however, the observed range is very comparable to that expected from the errors (see Table 4) so we can not confirm any clear evidence for an intrinsic spread in any of these elements.
Only a handful of metal-poor globular clusters show a potential star-to-star dispersion in neutron-capture elements (Roederer, 2011; Kacharov, Koch & McWilliam, 2013). Marino et al. (2009) found a wide range of abundances values for s-process elements, Y, Zr and Ba, in M22. They also identified a bimodality among these elements. None of the elements show a correlation with Na, O and Al. The bimodality in s-process elements in M22 resembles the case of NGC 1851 (Yong & Grundahl, 2008) although in this case the s-element abundance appears to correlate with the Na, Al, and O abundances. The metal-poor globular cluster M 15, with [Fe/H] = - 2.31 0.06 dex (Carretta et al., 2009b), has also proven to be an interesting case for study. Sneden et al. (1997); Sneden et al. (2000) found a scatter of heavy neutron-capture elements but no significant s-process enrichment in M15. More recently, Worley et al. (2013) found a bimodal distribution of Ba, Eu and possibly La in M15. Both modes of the bimodality seem to be indicative of a pollution scenario dominated by the r-process and only varying due to a different degrees of enrichment. A group of La-rich and La-poor stars can be identified in our sample but such a small sample does not allow us to carryout further investigation.
The weak s-process accounts for the major fraction of the light s-process (ls-) elements, like Y, and occurs in core He-burning massive stars (M 8M⊙) (Pignatari et al., 2010). The main s-process takes place in thermally pulsating AGB stars (1M⊙M8M⊙) producing light s-process (ls-) and heavy s-process (hs-) elements, like Ba and La (Arlandini et al., 1999). Therefore, analysis of ratios between ls- and hs- elements are very interesting in order to constrain these formation processes. Figure 14 shows the [hs/ls]=[Ba/Y] ratio as a function of the heavy s-process element Ba. Although the large errors should be considered, a relation is present between Y and Ba. This relation could imply a real spread of Y and Ba. Although the spread among heavy elements is comparable to the star-to-star scatter found in [Fe/H], heavy element absorption lines are generally difficult to measure. For example, Ba absorption lines are quite strong among luminous RGB stars so saturation could be a problem. They have hyperfine structure and involve the choice of atmospheric parameters. In particular, they are quite sensitive to the choice of microturbulent velocities. These effects could produce an increase in the uncertainties.
The s-process elements can be considered as a signature of the processes that occur in intermediate mass AGB stars (Busso et al., 2001), whose wind could have polluted the primordial material from which the second generation of stars formed. If the spread in s-process contents in NGC 4372 is real, this would argue against the abundances of s-process elements being intrinsic to the cluster and suggest that AGB stars can be a possible polluter. However, none of the analyzed heavy elements show any clear relations with other lighter elements that could suggest an obvious pollution by AGB stars. Since this potential spread seems unrelated with the spreads in light elements, the variations could be attributed to the original inhomogeneities in the gas which formed the cluster. A larger sample survey of stars at various evolutionary phases and extensive abundance analysis of a range of key nucleosynthetic indicators would be essential to confirm whether this potential star-to-star scatter is real.
5 Summary
In this paper we present the first detailed chemical abundances of 14 elements in 7 red giant members of NGC 4372 using high resolution, high S/N spectroscopy. Chemical abundances have been computed by Concepcion Node within the GES collaboration. The classical EW method has been used when possible. For 5 elements whose lines are affected by blending, the spectrum-synthesis method was preferred. One of the stars of our sample shows a radial velocity in agreement with the cluster bulk but a distinct chemical signature so we have excluded it from the statistical analysis.
We found a metallicity of [Fe/H]= - 2.19 0.02 with a = 0.03 dex, in good agreement with previous, low-resolution, studies. We rule out an intrinsic metallicity spread, although the low value for the one (excluded) star should be born in mind. We confirm the Na-O anti correlation although not very extended, probably due to our small sample. The abundances of O are relatively high compared with other globular clusters which could indicate that NGC 4372 was formed in an environment with high O for its metallicity. Intrinsic spreads are also seen in other light elements, in particular an apparent Mg-Al anti correlation has been detected. The Fe-peak elements generally show good agreement with other GCs and halo field stars with no dispersion. The elements show an enhancement of [/Fe]= +0.37 0.07 typical of other GCs indicating similar fast star formation time scales. A relation between light and heavy s-process elements has been identified. A larger sample of stars at various evolutionary phases and extensive chemical analysis is required for a more definitive analysis.
Acknowledgements.
We thank Michele Bellazzini for a very careful reading and useful comments and suggestions that helped to improve the quality of the paper. We also thank an anonymous referee for comments that greatly improved this paper.Based on data products from observations made with ESO Telescopes at the La Silla Paranal Observatory under programme ID 188.B-3002. These data products have been processed by the Cambridge Astronomy Survey Unit (CASU) at the Institute of Astronomy, University of Cambridge, and by the FLAMES/UVES reduction team at INAF/Osservatorio Astrofisico di Arcetri. These data have been obtained from the Gaia-ESO Survey Data Archive, prepared and hosted by the Wide Field Astronomy Unit, Institute for Astronomy, University of Edinburgh, which is funded by the UK Science and Technology Facilities Council. This work was partly supported by the European Union FP7 programme through ERC grant number 320360 and by the Leverhulme Trust through grant RPG-2012-541. We acknowledge the support from INAF and Ministero dell’ Istruzione, dell’ Università’ e della Ricerca (MIUR) in the form of the grant "Premiale VLT 2012". The results presented here benefit from discussions held during the Gaia-ESO workshops and conferences supported by the ESF (European Science Foundation) through the GREAT Research Network Programme.
I.S.R. gratefully acknowledges the support provided by the Gemini-CONICYT project 32110029. C.M. acknowledges the support from CONICYT-PCHA/Doctorado Nacional/2014-21141057. D.G. gratefully acknowledges support form the Chilean BASAL Centro de Excelencia en Astrofísica y Tecnologías Afines (CATA) gran PFB-06/2007. S.V. gratefully acknowledges the support provided by Fondecyt reg. 1130721. AK and NK acknowledge the Deutsche Forschungsgemeinschaft for funding from Emmy-Noether grant Ko 4161/1. U.H. acknowledges support from the Swedish National Space Board (SNSB). S.G.S acknowledges the support from the Fundação para a Ciência e Tecnologia, FCT (Portugal) and POPH/FSE (EC), in the form of the fellowships SFRH/BPD/47611/2008.
References
- Alcaino (1974) Alcaino G., 1974, A&AS, 13, 345
- Alcaino & Liller (1986) Alcaino G., Liller W., 1986, AJ, 91, 87
- Alcaino et al. (1991) Alcaino G., Liller W., Alvarado F., Wenderoth E., 1991, AJ, 102, 159
- Arlandini et al. (1999) Arlandini C., Käppeler F., Wisshak K., Gallino R., Lugaro M., Busso M., Straniero O., 1999, ApJ, 525, 886
- Arnould, Goriely & Jorissen (1999) Arnould M., Goriely S., Jorissen A., 1999, A&A, 347, 572
- Bastian et al. (2013) Bastian N., Lamers H. J. G. L. M., de Mink S. E., Longmore S. N., Goodwin S. P., Gieles M., 2013, MNRAS, 436, 2398
- Bragaglia et al. (2010) Bragaglia A. et al., 2010, ApJ, 720, L41
- Bragaglia et al. (2014) Bragaglia A., Sneden C., Carretta E., Gratton R. G., Lucatello S., Bernath P. F., Brooke J. S. A., Ram R. S., 2014, ApJ, 796, 68
- Bressan et al. (2012) Bressan A., Marigo P., Girardi L., Salasnich B., Dal Cero C., Rubele S., Nanni A., 2012, MNRAS, 427, 127
- Brocato et al. (1996) Brocato E., Buonanno R., Malakhova Y., Piersimoni A. M., 1996, A&A, 311, 778
- Busso et al. (2001) Busso M., Gallino R., Lambert D. L., Travaglio C., Smith V. V., 2001, ApJ, 557, 802
- Caloi & D’Antona (2011) Caloi V., D’Antona F., 2011, MNRAS, 417, 228
- Carretta (2006) Carretta E., 2006, AJ, 131, 1766
- Carretta et al. (2009c) Carretta E., Bragaglia A., Gratton R., D’Orazi V., Lucatello S., 2009c, A&A, 508, 695
- Carretta et al. (2009a) Carretta E., Bragaglia A., Gratton R., Lucatello S., 2009a, A&A, 505, 139
- Carretta et al. (2010a) Carretta E., Bragaglia A., Gratton R., Lucatello S., Bellazzini M., D’Orazi V., 2010a, ApJ, 712, L21
- Carretta et al. (2014) Carretta E., Bragaglia A., Gratton R. G., D’Orazi V., Lucatello S., Sollima A., 2014, A&A, 561, A87
- Carretta et al. (2010b) Carretta E. et al., 2010b, A&A, 520, A95
- Carretta et al. (2009b) Carretta E. et al., 2009b, A&A, 505, 117
- Carretta et al. (2010c) Carretta E., Bragaglia A., Gratton R. G., Recio-Blanco A., Lucatello S., D’Orazi V., Cassisi S., 2010c, A&A, 516, A55
- Carretta & Gratton (1997) Carretta E., Gratton R. G., 1997, A&AS, 121, 95
- Carretta et al. (2011) Carretta E., Lucatello S., Gratton R. G., Bragaglia A., D’Orazi V., 2011, A&A, 533, A69
- Casetti-Dinescu et al. (2007) Casetti-Dinescu D. I., Girard T. M., Herrera D., van Altena W. F., López C. E., Castillo D. J., 2007, AJ, 134, 195
- Cayrel et al. (2004) Cayrel R. et al., 2004, A&A, 416, 1117
- Cohen (2004) Cohen J. G., 2004, AJ, 127, 1545
- Cohen et al. (2010) Cohen J. G., Kirby E. N., Simon J. D., Geha M., 2010, ApJ, 725, 288
- Cunha et al. (2014) Cunha K. et al., 2014, ArXiv e-prints
- D’Antona et al. (2002) D’Antona F., Caloi V., Montalbán J., Ventura P., Gratton R., 2002, A&A, 395, 69
- de Laverny et al. (2012) de Laverny P., Recio-Blanco A., Worley C. C., Plez B., 2012, A&A, 544, A126
- de Mink et al. (2009) de Mink S. E., Pols O. R., Langer N., Izzard R. G., 2009, A&A, 507, L1
- Decressin et al. (2007) Decressin T., Meynet G., Charbonnel C., Prantzos N., Ekström S., 2007, A&A, 464, 1029
- Denissenkov et al. (1998) Denissenkov P. A., Da Costa G. S., Norris J. E., Weiss A., 1998, A&A, 333, 926
- D’Ercole et al. (2008) D’Ercole A., Vesperini E., D’Antona F., McMillan S. L. W., Recchi S., 2008, MNRAS, 391, 825
- Ferraro et al. (2009) Ferraro F. R. et al., 2009, Nature, 462, 483
- Fulbright (2000) Fulbright J. P., 2000, AJ, 120, 1841
- Fulbright (2002) Fulbright J. P., 2002, AJ, 123, 404
- Geisler et al. (1995) Geisler D., Piatti A. E., Claria J. J., Minniti D., 1995, AJ, 109, 605
- Geisler et al. (2012) Geisler D., Villanova S., Carraro G., Pilachowski C., Cummings J., Johnson C. I., Bresolin F., 2012, ApJ, 756, L40
- Geisler et al. (2007) Geisler D., Wallerstein G., Smith V. V., Casetti-Dinescu D. I., 2007, PASP, 119, 939
- Gilmore et al. (2012) Gilmore G. et al., 2012, The Messenger, 147, 25
- Gratton, Sneden & Carretta (2004) Gratton R., Sneden C., Carretta E., 2004, ARA&A, 42, 385
- Gratton et al. (2001) Gratton R. G. et al., 2001, A&A, 369, 87
- Gratton, Carretta & Bragaglia (2012) Gratton R. G., Carretta E., Bragaglia A., 2012, A&A Rev., 20, 50
- Gratton & Sneden (1994) Gratton R. G., Sneden C., 1994, A&A, 287, 927
- Grevesse, Asplund & Sauval (2007) Grevesse N., Asplund M., Sauval A. J., 2007, Space Sci. Rev., 130, 105
- Gustafsson et al. (2008) Gustafsson B., Edvardsson B., Eriksson K., Jørgensen U. G., Nordlund Å., Plez B., 2008, A&A, 486, 951
- Harris (1996) Harris W. E., 1996, AJ, 112, 1487
- Hartwick & Hesser (1973) Hartwick F. D. A., Hesser J. E., 1973, ApJ, 186, 1171
- Heiter et al. (2015, in prep) Heiter et al. A., 2015, in prep
- Ishigaki et al. (2014) Ishigaki M. N., Aoki W., Arimoto N., Okamoto S., 2014, A&A, 562, A146
- Ivans et al. (2001) Ivans I. I., Kraft R. P., Sneden C., Smith G. H., Rich R. M., Shetrone M., 2001, AJ, 122, 1438
- Joo & Lee (2013) Joo S.-J., Lee Y.-W., 2013, ApJ, 762, 36
- Kacharov et al. (2014) Kacharov N. et al., 2014, A&A, 567, A69
- Kacharov, Koch & McWilliam (2013) Kacharov N., Koch A., McWilliam A., 2013, A&A, 554, A81
- Koch, Côté & McWilliam (2009) Koch A., Côté P., McWilliam A., 2009, A&A, 506, 729
- Koch et al. (2008a) Koch A., Grebel E. K., Gilmore G. F., Wyse R. F. G., Kleyna J. T., Harbeck D. R., Wilkinson M. I., Wyn Evans N., 2008a, AJ, 135, 1580
- Koch & McWilliam (2011) Koch A., McWilliam A., 2011, AJ, 142, 63
- Koch et al. (2008b) Koch A., McWilliam A., Grebel E. K., Zucker D. B., Belokurov V., 2008b, ApJ, 688, L13
- Langer & Hoffman (1995) Langer G. E., Hoffman R. D., 1995, PASP, 107, 1177
- Lapenna et al. (2014) Lapenna E., Mucciarelli A., Lanzoni B., Rosario Ferraro F., Dalessandro E., origlia L., Massari D., 2014, ArXiv e-prints
- Lardo et al. (2014) Lardo C. et al., 2014, ArXiv e-prints
- Lardo et al. (2013) Lardo C. et al., 2013, MNRAS, 433, 1941
- Lee & Carney (2002) Lee J.-W., Carney B. W., 2002, AJ, 124, 1511
- Lee, Carney & Habgood (2005) Lee J.-W., Carney B. W., Habgood M. J., 2005, AJ, 129, 251
- Letarte et al. (2006) Letarte B., Hill V., Jablonka P., Tolstoy E., François P., Meylan G., 2006, A&A, 453, 547
- Marino et al. (2009) Marino A. F., Milone A. P., Piotto G., Villanova S., Bedin L. R., Bellini A., Renzini A., 2009, A&A, 505, 1099
- Marino et al. (2011) Marino A. F. et al., 2011, ApJ, 731, 64
- Marino et al. (2008) Marino A. F., Villanova S., Piotto G., Milone A. P., Momany Y., Bedin L. R., Medling A. M., 2008, A&A, 490, 625
- Mashonkina, Shimanskiĭ & Sakhibullin (2000) Mashonkina L. I., Shimanskiĭ V. V., Sakhibullin N. A., 2000, Astronomy Reports, 44, 790
- Masseron (2006) Masseron T., 2006, PhD thesis, Observatoire de Paris
- McLean et al. (2000) McLean B. J., Greene G. R., Lattanzi M. G., Pirenne B., 2000, in Astronomical Society of the Pacific Conference Series, Vol. 216, Astronomical Data Analysis Software and Systems IX, Manset N., Veillet C., Crabtree D., eds., p. 145
- Modigliani & Larsen (2012) Modigliani A., Larsen J. M., 2012
- Modigliani et al. (2004) Modigliani A., Mulas G., Porceddu I., Wolff B., Damiani F., Banse B. K., 2004, The Messenger, 118, 8
- Muñoz, Geisler & Villanova (2013) Muñoz C., Geisler D., Villanova S., 2013, MNRAS, 433, 2006
- Mucciarelli et al. (2014) Mucciarelli A., Dalessandro E., Ferraro F. R., Origlia L., Lanzoni B., 2014, ApJ, 793, L6
- Mucciarelli et al. (2009) Mucciarelli A., Origlia L., Ferraro F. R., Pancino E., 2009, ApJ, 695, L134
- Mucciarelli et al. (2013) Mucciarelli A., Pancino E., Lovisi L., Ferraro F. R., Lapenna E., 2013, ApJ, 766, 78
- Pancino & Gaia-ESO Survey consortium (2012) Pancino E., Gaia-ESO Survey consortium o. b. o. t., 2012, ArXiv e-prints:1206.6291
- Pancino et al. (2015, in prep) Pancino et al. E., 2015, in prep
- Pignatari et al. (2010) Pignatari M., Gallino R., Heil M., Wiescher M., Käppeler F., Herwig F., Bisterzo S., 2010, ApJ, 710, 1557
- Piotto et al. (2007) Piotto G. et al., 2007, ApJ, 661, L53
- Randich & Gilmore (2012) Randich S., Gilmore G., 2012, in Science from the Next Generation Imaging and Spectroscopic Surveys
- Recio-Blanco et al. (2015, in prep) Recio-Blanco et al. A., 2015, in prep
- Reddy, Lambert & Allende Prieto (2006) Reddy B. E., Lambert D. L., Allende Prieto C., 2006, MNRAS, 367, 1329
- Reddy et al. (2003) Reddy B. E., Tomkin J., Lambert D. L., Allende Prieto C., 2003, MNRAS, 340, 304
- Roederer (2011) Roederer I. U., 2011, ApJ, 732, L17
- Roederer et al. (2010) Roederer I. U., Cowan J. J., Karakas A. I., Kratz K.-L., Lugaro M., Simmerer J., Farouqi K., Sneden C., 2010, ApJ, 724, 975
- Rosenberg et al. (2000) Rosenberg A., Piotto G., Saviane I., Aparicio A., 2000, A&AS, 144, 5
- Rutledge, Hesser & Stetson (1997) Rutledge G. A., Hesser J. E., Stetson P. B., 1997, PASP, 109, 907
- Sacco et al. (2014) Sacco G. G. et al., 2014, A&A, 565, A113
- Sbordone et al. (2007) Sbordone L., Bonifacio P., Buonanno R., Marconi G., Monaco L., Zaggia S., 2007, A&A, 465, 815
- Sbordone et al. (2005) Sbordone L., Bonifacio P., Marconi G., Buonanno R., Zaggia S., 2005, A&A, 437, 905
- Schlegel, Finkbeiner & Davis (1998) Schlegel D. J., Finkbeiner D. P., Davis M., 1998, ApJ, 500, 525
- Shetrone, Côté & Sargent (2001) Shetrone M. D., Côté P., Sargent W. L. W., 2001, ApJ, 548, 592
- Simmerer et al. (2004) Simmerer J., Sneden C., Cowan J. J., Collier J., Woolf V. M., Lawler J. E., 2004, ApJ, 617, 1091
- Skrutskie et al. (2006) Skrutskie M. F. et al., 2006, AJ, 131, 1163
- Smiljanic et al. (2014) Smiljanic R. et al., 2014, A&A, 570, A122
- Sneden (2004) Sneden C., 2004, Mem. Soc. Astron. Italiana, 75, 267
- Sneden et al. (2000) Sneden C., Johnson J., Kraft R. P., Smith G. H., Cowan J. J., Bolte M. S., 2000, ApJ, 536, L85
- Sneden et al. (1997) Sneden C., Kraft R. P., Shetrone M. D., Smith G. H., Langer G. E., Prosser C. F., 1997, AJ, 114, 1964
- Sneden (1973) Sneden C. A., 1973, PhD thesis, THE UNIVERSITY OF TEXAS AT AUSTIN.
- Stetson (1987) Stetson P. B., 1987, PASP, 99, 191
- Stetson (1992) Stetson P. B., 1992, in Astronomical Society of the Pacific Conference Series, Vol. 25, Astronomical Data Analysis Software and Systems I, Worrall D. M., Biemesderfer C., Barnes J., eds., p. 297
- Stetson (2000) Stetson P. B., 2000, PASP, 112, 925
- Stetson & Pancino (2008) Stetson P. B., Pancino E., 2008, PASP, 120, 1332
- Tautvaišienė et al. (2004) Tautvaišienė G., Wallerstein G., Geisler D., Gonzalez G., Charbonnel C., 2004, AJ, 127, 373
- Thygesen et al. (2014) Thygesen A. O. et al., 2014, ArXiv e-prints
- Tinsley (1979) Tinsley B. M., 1979, ApJ, 229, 1046
- Valdes (1998) Valdes F. G., 1998, in Astronomical Society of the Pacific Conference Series, Vol. 145, Astronomical Data Analysis Software and Systems VII, Albrecht R., Hook R. N., Bushouse H. A., eds., p. 53
- Ventura et al. (2001) Ventura P., D’Antona F., Mazzitelli I., Gratton R., 2001, ApJ, 550, L65
- Villanova & Geisler (2011) Villanova S., Geisler D., 2011, A&A, 535, A31
- Villanova et al. (2013) Villanova S., Geisler D., Carraro G., Moni Bidin C., Muñoz C., 2013, ApJ, 778, 186
- Worley et al. (2013) Worley C. C., Hill V., Sobeck J., Carretta E., 2013, A&A, 553, A47
- Yong & Grundahl (2008) Yong D., Grundahl F., 2008, ApJ, 672, L29
- Yong et al. (2005) Yong D., Grundahl F., Nissen P. E., Jensen H. R., Lambert D. L., 2005, A&A, 438, 875
- Yong et al. (2014) Yong D. et al., 2014, MNRAS, 441, 3396
- Zacharias et al. (2010) Zacharias N. et al., 2010, AJ, 139, 2184
- Zinn & West (1984) Zinn R., West M. J., 1984, ApJS, 55, 45
*