version 0.28
Measurements of Dielectron Production in AuAu Collisions at = 200 GeV from the STAR Experiment
Abstract
We report on measurements of dielectron () production in AuAu collisions at a center-of-mass energy of 200 GeV per nucleon-nucleon pair using the STAR detector at RHIC. Systematic measurements of the dielectron yield as a function of transverse momentum () and collision centrality show an enhancement compared to a cocktail simulation of hadronic sources in the low invariant-mass region ( 1 GeV/). This enhancement cannot be reproduced by the -meson vacuum spectral function. In minimum-bias collisions, in the invariant-mass range of 0.30 0.76 GeV/, integrated over the full acceptance, the enhancement factor is 1.76 0.06 (stat.) 0.26 (sys.) 0.29 (cocktail). The enhancement factor exhibits weak centrality and dependence in STAR’s accessible kinematic regions, while the excess yield in this invariant-mass region as a function of the number of participating nucleons follows a power-law shape with a power of 1.44 0.10. Models that assume an in-medium broadening of the meson spectral function consistently describe the observed excess in these measurements. Additionally, we report on measurements of and -meson production through their decay channel. These measurements show good agreement with Tsallis Blast-Wave model predictions as well as, in the case of the -meson, results through its decay channel. In the intermediate invariant-mass region (1.1 3 GeV/), we investigate the spectral shapes from different collision centralities. Physics implications for possible in-medium modification of charmed hadron production and other physics sources are discussed.
pacs
25.75.Cj, 25.75.DwI Introduction
A major scientific goal of the ultra-relativistic heavy-ion program is to study Quantum ChromoDynamics (QCD) matter at high temperature and density in the laboratory. Previous measurements at Relativistic Heavy Ion Collider (RHIC) have established the formation of a strongly-coupled Quark Gluon Plasma (sQGP) in high-energy heavy-ion collisions [1]. Throughout the evolution of the hot, dense, and strongly interacting system, electromagnetic probes are produced and escape with little interaction. Thus, they provide direct information about the various stages of the system’s evolution.
Following convention, the dilepton invariant-mass spectrum is typically divided into three ranges: the low mass region - LMR (), the intermediate mass region - IMR () and the high mass region - HMR (). As will be described next, distinctively different physical processes contribute or even dominate within these particular ranges.
The initial hard perturbative QCD process, Drell-Yan production, () can produce high-mass dileptons and is expected to be an important mechanism in the HMR [2]. Moreover, initial hard scattering processes can allow for bremsstrahlung emission of virtual photons which convert into low invariant mass, high transverse momentum () dielectrons (“internal conversion”). These dileptons, in principle, are calculable within the perturbative QCD framework.
The colliding participant system is expected to quickly reach the partonic sQGP phase where dileptons can be produced through electromagnetic radiation via parton-parton scatterings. Theoretical calculations indicate that at top RHIC energy, QGP thermal dilepton production will become a dominant source in the IMR while thermal dileptons with higher masses originate from earlier stages [3]. This suggests that investigating the thermal dilepton production as a function of & allows for probing the medium properties at different stages of the system’s space-time evolution. Measuring thermal dilepton collective flow and polarization can reveal information about the relevant degrees of freedom which may relate to deconfinement and the equilibrium of the strongly interacting matter created in heavy-ion collisions [4, 5, 6, 7, 8]. Thermal radiation can produce real photons as well as virtual photons that decay to dileptons. Comparative analysis of distributions for these dileptons with respect to those produced in initial hard scattering, can shed light on direct real photon production from the QGP medium.
When the system expands, cools down, and enters into the hadronic phase, dileptons are produced via multiple hadron-hadron scattering by coupling to vector mesons (, , , etc.). They are expected to dominate the LMR and their mass spectra may be related to the chiral symmetry restoration in the medium [2, 9]. Theoretical calculations suggest that the vector meson spectral functions will undergo modifications in a hot and dense hadronic medium, which may be connected to the restoration of chiral symmetry. Two scenarios have been proposed for the change of vector meson spectral functions when chiral symmetry is restored: a shift of the pole mass [10] and/or a broadening of the mass spectrum [11]. Measurements of the dielectron continuum in the low mass region will help expose the vector meson production mechanisms, and hence the chiral properties of the medium in heavy-ion collisions.
Finally, when all particles decouple from the system, long-lived hadrons (, , , etc.) can decay into lepton pairs and are measured by the detector system. Their contributions can be calculated based on the measured or predicted invariant yields of the respective parent particles, and incorporated in the so-called hadron cocktail.
Dilepton measurements in heavy-ion collisions have been pursued for decades from relatively low energies to relativistic and ultrarelativistic energies [12, 13, 14, 15, 16, 17]. The CERES measurements of spectra in Pb+Au collisions at the Super Proton Synchrotron (SPS) showed an enhancement in the mass region below 700 MeV/ with respect to the hadron cocktail that included the vacuum line shape for the meson [15]. High-statistics measurements from the NA60 experiment at = 17.2 GeV suggested that this enhancement is consistent with in-medium broadening of the -meson spectral function rather than a drop of its pole mass [16, 18, 19, 20, 21]. Strikingly, after removal of correlated charm contributions, the NA60 collaboration also observed that the slope parameters of the dimuon transverse mass () spectrum showed a roughly linear increase with dimuon invariant mass below the -meson mass, followed by a sudden decline at higher masses. This observation provided a first indication of thermal leptons from a partonic source [16].
Thermal radiation of dileptons is expected to be significantly enhanced due to a well-developed partonic phase in the heavy-ion collision systems created at RHIC. The PHENIX collaboration has measured dielectrons at mid-rapidity in Au+Au collisions within its detector acceptance. For minimum-bias collisions, in the mass region between 150 and 700 MeV/ an enhancement of 4.7 0.4 (stat.) 1.5 (syst.) 0.9 (model) has been reported by the PHENIX collaboration [17]. Several theoretical calculations, which have successfully explained the SPS data [18, 19, 20, 21] and the STAR data [22] previously, were unable to reproduce the magnitude of the low mass dielectron enhancement observed by PHENIX through expected vector meson contributions in the hadronic medium. The PHENIX measured IMR yields are consistent with the charm contribution from scaled with the number of binary collisions. However, within the limits of the data precision and our present understanding of the modification of charmed hadron production in Au + Au collisions, no conclusive evidence for thermal radiation can be inferred from this measurement. A detailed dilepton program to investigate the in-medium chiral and thermal properties is one of the main focuses of future heavy-ion projects from Schwerionen Synchrotron (SIS) energies up to LHC energies.
In this paper, we report on detailed measurements of dielectron production in Au + Au collisions at = 200 GeV with the Solenoidal Tracker At RHIC (STAR) experiment. The data used in this analysis were recorded during the RHIC runs in 2010 and 2011. The barrel Time-Of-Flight (TOF) detector system was completed before these runs thus significantly improving the electron identification over a wide momentum range in STAR’s Time Projection Chamber (TPC).
The paper is organized as follows: Section II describes the experimental setup and the data sets used in this analysis. Section III explains in detail the analysis techniques including electron identification, dielectron invariant mass reconstruction, background subtraction, detector acceptance efficiency correction, and systematic uncertainties. Section IV presents our results on dielectron production yields within the STAR detector acceptance and a comparison to the hadron cocktails. Results are compared with theoretical calculations of in-medium modified vector meson line shapes as well as QGP thermal radiation contributions. Systematic studies on the centrality and dependence of the dielectron yields are presented. Our results and conclusions are summarized in Section V.
II Experimental Setup
The data used in this analysis were collected by the STAR detector [23]. The major detector subsystems used in this analysis are the TPC, the TOF, and two trigger subsystems: the Vertex Position Detectors (VPDs) and the Zero Degree Calorimeters (ZDCs).
II.1 Time Projection Chamber
The TPC [24] is the main tracking detector and consists of a 4.2 m long solenoidal cylinder concentric with the beam pipe. It is operated in a uniform 0.5 Tesla magnetic field parallel to the beam direction (defined as direction in STAR). The inner and outer radii of the active volume are 0.5 and 2.0 m, respectively. It covers the full azimuth and a pseudorapidity range of for the inner radius and for the outer radius. The TPC has 45 readout layers allowing measurements of charged particle momenta with a resolution of 1% at 1 GeV/ for tracks originating from the collision vertices. It is also used for particle identification (PID) via the ionization energy loss () in the TPC gas with a mean resolution of about 7% .
II.2 Time Of Flight System
The TOF system consists of the Barrel TOF (BTOF) detector covering the TPC cylinder and the VPDs located in the forward pseudorapidity regions. The latter provide the common start time. BTOF detector utilizes the multi-gap resistive plate chamber technology [25]. It covers the full azimuth and 0.9. The VPD detector has two parts, sitting along the beam pipe on both sides of the STAR detector at 5.7 m from the center. The detectors cover a pseudorapidity range of 4.45.1 [26]. The time stamps recorded by the VPD and the BTOF detectors are used to calculate the particle time-of-flight (tof). The tof is further combined with the track length and momentum, both measured by the TPC, to identify charged particles. The timing resolution of the TOF system, including the start timing resolution in Au+Au 200 GeV collisions, is less than 100 ps.
II.3 Trigger Definitions
The minimum bias trigger in Au+Au 200 GeV collisions for the 2010 and 2011 runs was defined as a coincidence between the two VPDs and an online collision-vertex cut in order to select collision events that took place near the center of the detector. The central trigger in the 2010 AuAu collisions includes the ZDC detectors, located on both sides of the STAR detector at approximately 18 m. This trigger requires a small signal in the ZDC detectors in combination with a large hit multiplicity in the BTOF and corresponds to the top 10% of the total hadronic cross section.
III Analysis Technique
III.1 Event Selection and Centrality Definition
Events used in this analysis were required to have a reconstructed collision vertex (primary vertex) within 30 cm of the TPC center along the beam direction in order to ensure uniform TPC acceptance. To suppress the chance of selecting the wrong vertex from different bunch-crossing collisions and to ensure that the selected event indeed fired the trigger, the difference between event vertex -coordinate and the calculated from the VPD timing was required to be within 3 cm. These selection criteria yield 240M (year 2010) and 490M (year 2011) 0-80% minimum-bias triggered events and 220M (year 2010) central triggered (0-10%) Au+Au events at = 200 GeV. The results reported in this paper are from the combined year 2010 and year 2011 data.
Centrality in AuAu 200 GeV collisions was defined using the uncorrected charged particle multiplicity within . The distribution was then compared to a Monte Carlo (MC) Glauber calculation in order to delineate the centrality bins. Furthermore, the dependence of on the collision vertex position and the beam luminosity has been included in order to take acceptance and efficiency changes on the measured into account. The measured uncorrected distribution from AuAu 200 GeV minimum-bias events collected in year 2010 is shown in Fig. 1. The distributions are from the region of cm and extrapolated to a zero ZDC-coincidence rate, so as to correct for the detector acceptance and efficiency dependence on the and luminosity. The measured distribution matches the MC Glauber calculation well for . In the lower multiplicity region, the VPD trigger becomes less efficient. The bottom panel shows the ratio between MC and measured data. The centrality bins are defined according to the MC Glauber distribution in order to determine the centrality cut on the measured . To obtain the real minimum-bias sample, events in the low multiplicity region have been weighted with the ratio shown in Fig. 1 (bottom panel) to account for the VPD inefficiency.
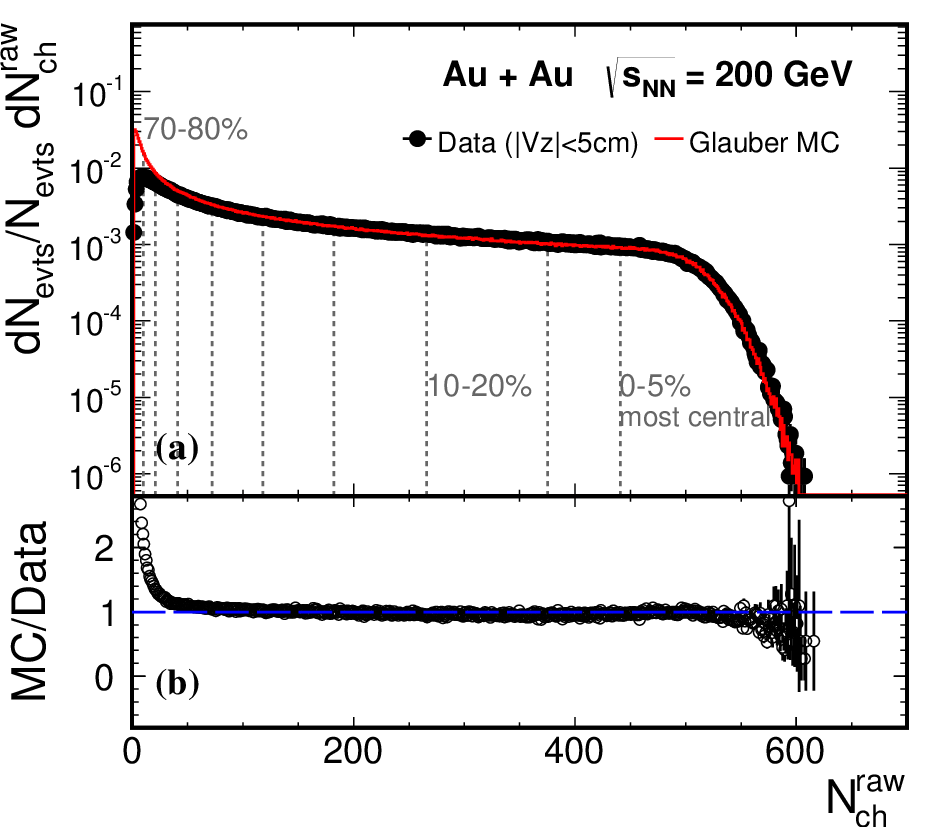
The average number of participants , and number of binary collisions from MC Glauber simulations of AuAu at = 200 GeV are listed in Table 1.
| Centrality | ||
|---|---|---|
| 0-10% | ||
| 10-40% | ||
| 40-80% | ||
| 0-80% |
III.2 Track Selection
Electron candidate tracks used in this analysis were required to satisfy the following selection criteria:
- •
the number of fit points in the TPC (nHitsFits) should be greater than 20 (out of a maximum of 45) to ensure good momentum resolution;
- •
the ratio of the number of fit points over the number of possible points should be greater than 0.52 in order to avoid track splitting in the TPC;
- •
the distance of closest approach (DCA) to the primary vertex should be less than 1 cm in order to reduce contributions from secondary decays;
- •
the number of points used for calculating (nHitsdEdx) should be greater than 15 to ensure good resolution;
- •
the track should match to a valid TOF hit with the projected position within TOF’s sensitive readout volume.
III.3 Electron identification

Electrons (including positrons if not specified) were identified based on a combination of the TPC and TOF detectors. The electron identification procedure has been described in [27]. In low multiplicity collisions, electrons can be cleanly separated from hadrons by requiring a TOF velocity cut and using the TPC truncated mean ionization energy loss dependence on particle momentum. However, the situation becomes more complicated in high multiplicity AuAu collisions. The normalized is defined as follows:
| (1) |
where and represent measured and theoretical values, respectively, and is the experimental resolution. The vs. distributions for the 2010 data are shown in Fig. 2. The upper panel shows the distribution for all charged particles, the bottom panel shows the distribution after applying the TOF velocity selection , which accepts about 95% of the electrons based on the TOF timing resolution. Despite the TOF velocity selection, there are still some slow hadrons that contribute to the electron band in this distribution. The source of these remaining slow hadrons is described in the following paragraphs.
The distribution for TPC tracks with matched TOF hits are shown in Fig. 2. For most cases where TOF hits are correctly associated with the charged particle tracks, one would have a meaningful particle velocity measurement that can then be used for particle identification. There are also many TOF hits from electrons that originate from photon conversions in the material between the TPC and TOF sensitive detector volumes. Since photons do not leave a trace in the TPC, these TOF hits can be randomly associated with TPC tracks especially in high-multiplicity events.
The inverted particle velocity () measured by the TOF (time) and the TPC (path length) versus the particle momentum () measured by the TPC is shown in the upper panel of Fig. 3 for all TPC-TOF associations in AuAu collisions at = 200 GeV. The band below depicts the associations between conversion electron TOF hits and random TPC charged tracks. The bottom panel of Fig. 3 shows the distributions in the momentum range GeV/ for three centrality classes. The three distributions are normalized to the pion peak. One can see that with increasing multiplicity that the fake association fraction increases substantially. These random associations were further confirmed using Monte Carlo (MC) Geant [28] simulations.
As mentioned before, the TOF-based velocity of particles depends on the time-of-flight measurements from the TOF detector and the track length determined by the TPC. For particles from secondary vertex decays (e.g., and from and decays), the track length and time-of-flight measurements have some offset, which leads to uncertainties when calculating the velocity.
Consequently, the applied particle velocity cut cannot remove the random association of charged hadron tracks with TOF signals and the particles from secondary vertex decays. Such hadrons are mostly at momentum of 400 MeV/ or above where the hadron bands cross the electron band. These hadrons remain in the vs. distribution in the lower panel of Fig. 2 and introduce an additional hadron background in the sample of selected electron candidates in the region where the electron band crosses with hadrons (mostly kaons and protons). The dashed black lines in the lower panel of Fig. 2 depict the cuts to select the single electron candidates in this analysis. Finally, distributions of the number of selected electron candidates are shown in upper panel of Fig. 4, their raw spectra are also shown in the lower panel of Fig. 4.


III.4 Electron Purity and hadron contamination
The vs. distribution after the TOF velocity selection has been shown in Fig. 2. We have performed a multi-component fit to the distribution for individual momentum slices in order to decompose the yields of each particle species, and thus derive the electron purity and hadron contamination for a certain cut. The distribution for electrons is assumed to be Gaussian, with its position and shape determined by selecting conversion electrons using an invariant-mass reconstruction. The positions and shapes of the distributions for pions, kaons, and protons were determined by selecting pure samples of these particles with particle masses calculated from the TOF detector. Figure 5 shows the respective thresholds for the pure hadron samples. The positions and shapes of all components are kept fixed during the fits, leaving only the individual yields as free parameters to fit the distribution slices in Fig. 2. An example of the fit result for the momentum bin of GeV/ is shown in Fig. 6. The black dotted curve at high region depicts a small contribution of tracks from merged pions in the TPC. The value of these tracks are twice that of normal pion tracks, thus its position and shape is predictable from the pion distribution. For completeness, we have included this contribution in the fit although it is well separated from the electron peak.

The multi-component fits describe the full distributions well in the regions where the slow hadron peaks can be separated from the electron peaks. In the region where kaons and protons start to overlap with electrons, we use the hadron yields from neighboring momentum bins with clean particle identification to interpolate the expected hadron yield. The systematic uncertainties on the electron purity in these overlapping bins were estimated by comparing the yields to the results from the free paramter fit, which take the hadron yield as free parameter. Figure 7 shows the electron purity for the candidate samples used in the minimum-bias and central collisions. As expected, hadron contamination increases from peripheral to central collisions. The electron purity integrated over the region of 0.22.0 GeV/ is (94.61.9)% and (92.12.0)% for 0-80% minimum bias and 0-10% central Au+Au collisions, respectively. The impact of hadron contamination on the dielectron spectra will be further discussed in Section III.8.


III.5 Electron pairing and background subtraction
For each individual event, all electron and positron candidates within the STAR acceptance of 0.2 GeV/ and 1 are combined to generate the inclusive unlike-sign pair () invariant-mass distribution. Despite slight acceptance differences between the TPC and the TOF, the collision vertex distribution along beam direction () will provide finite acceptance and efficiency for charged tracks up to 1. Therefore we used 1 in this analysis and the dependence of efficiency and acceptance along has been corrected in the final spectra. In Fig. 8, a two-dimensional distribution in invariant-mass and transverse-momentum (, ) of pairs is shown in the STAR acceptance with 1 (electron pair rapidity) and the background subtracted. Vector meson signals (, , and ) are fairly easy to recognize after the background subtraction. All distributions shown in this paper are calculated within the same STAR acceptance including 1 unless specified otherwise.

In this analysis the signal () is defined as the pairs that originate from pair production sources such as , , , , , , J/, decays, as well as correlated charm hadron decay. Background sources that contribute to the inclusive unlike-sign pair distributions include:
- •
Combinatorial background pairs from two uncorrelated electrons.
- •
Correlated background pairs. For instance, in the case of Dalitz decays followed by a conversion of the decay photon(e.g., , then ), the electron from the Dalitz decay and the positron from the conversion are not completely uncorrelated as they originate from the same source. Another significant contribution is the electron pairs from same-jet fragmentation or back-to-back di-jet fragmentation. This source may become more significant at high mass or .
Contributions from uncorrelated and correlated background pairs are thoroughly studied and evaluated using like-sign pairs, and , constructed from the same event. It has been demonstrated that when the and are produced in statistically independent pairs, the geometric mean of the like-sign pairs fully describes the background in the inclusive unlike-sign pair distribution [17]. In this analysis, we consistently used the like-sign distribution to estimate or normalize the background distribution. The mixed-event unlike-sign distribution was constructed to estimate the combinatorial background and was used for a better statistical background estimation wherever the correlated background is negligible or the mixed-event unlike-sign distribution agrees with the same-event like-sign distribution . Mixed-event like-sign pair distributions , were also constructed to verify the applicable kinematic region for the mixed-event technique as well as to define the normalization factor for the mixed-event unlike-sign distribution.
A sizeable component of the correlated electron pairs, that is not considered as part of the final signal distribution, originates from photon conversions in the detector material. Details of the conversion electron removal will be discussed in subsection III-E.1.
Hadron contamination in the selected electron/positron sample due to particle misidentification may result in some residual contributions to the final signal distribution. Most of these are from resonance decays. The high purity of the electron sample in this analysis allows us to demonstrate that the residual contribution due to hadron contamination in the final distribution is negligible. Such details will be discussed in the Section III-H.
III.5.1 Photon conversion removal
Background pairs from photon conversion were removed from the sample using the angle selection method. This method is similar to that used by the PHENIX collaboration [17] and relies on the kinematics of the pair production process. The opening angle between the two conversion electrons should be zero, and the electron tracks are bent only in the plane perpendicular to the magnetic field direction, which for the STAR experiment is parallel to the beam direction (). Unit-vector definitions used for the construction of the angle were taken from [17] as:
| (2) |
where are momentum vectors of tracks, and is the magnetic field direction.
For pairs that originate from photon conversions should be zero. It has no preferred orientation for combinatorial pairs, and only very weak dependence for pairs from hadron decays. The electron pair mass versus for conversion electron pairs from the full Geant simulation of the STAR detector [28] is shown in the upper panel of Fig. 9. The populated bands at different mass positions depict the conversion electron pairs from different detector materials. The reconstructed masses are shifted from zero as the electrons are assumed to originate from the primary vertex during the final track reconstruction. As a result, the three main bands from low to high masses correspond to the conversions from the beam pipe (at a radius 4 cm), inner cone support structure ( 20 cm), and TPC inner field cage (IFC) ( 46 cm). In order to remove these conversion pairs, we define a mass-dependent selection which is shown as the red line in the upper panel of Fig. 9. We estimated that more than 95 conversion pairs are removed by this selection criterion.
The signal pair invariant mass spectra before and after this photon conversion cut are shown in the bottom panel of Fig. 9; their difference is shown as the filled histogram. Like-sign background subtraction was used to obtain these distributions. Almost all conversions appear in the mass region below 0.1 GeV/.


The cut removing the photon conversion pairs was applied only in the very low mass region ( 0.2 GeV/). The effect of the cut on the mixed-event distribution normalization is negligible as that determination is done at a much higher mass region.
III.5.2 Event mixing
The event mixing technique was used to reproduce the combinatorial background with improved statistical precision. In order to make the mixed-event distributions close to that from real events, we have only selected events with similar properties for the mixed-event calculation. The full sample is divided into different pools according to the following event level properties: multiplicity, vertex position, event plane angle, and magnetic field direction. The sorting by event multiplicity and vertex position ensures electrons are mixed between events with similar detector acceptance and efficiency. This technique has been widely used in many other STAR analyses for the reconstruction of the combinatorial backgrounds [29]. The small signal-to-background ratio requires a very good understanding of the mixed-event distribution in the dielectron analysis. Its dependence on the event pool division for event-plane angle and magnetic field direction were studied in detail and are presented here.
Elliptic flow measurements [30] in 200 GeV AuAu collisions have shown that the momentum phase space distribution of particles produced in the event is approximately elliptical. Therefore, we only mix events with similar event-plane direction to ensure the events have similar momentum phase space alignment, and further guaranteed by the multiplicity assortment to ensure the events have similar momentum phase space distributions. The event plane was reconstructed with a conventional method using tracks in the TPC ( GeV/ and ) in order to obtain the second-order event-plane angle [30]. In Fig. 10, results of a study using minimum bias AuAu collisions in which mixed-event unlike-sign and like-sign distributions are compared using different numbers of event pools in event-plane angle are shown. The figure illustrates several scenarios from 1 up to 24 event pools. The dashed lines at 0.5% corresponds to a 100% change in the yield where the signal-to-background ratio is 1/200. This study shows the importance of doing the division in event-plane angle in order to avoid distortion of the mixed-event distributions. The distortion is quite clear in the low mass region ( 1 GeV/) and not negligible in the intermediate mass region (13 GeV/). The differences become negligible when the number of event pools is 12 in 200 GeV AuAu minimum-bias collisions, comparable to the TPC order event plane resolution.
A similar study of the centrality dependence for background distributions was carried out. As a result, to ensure the minimal difference in all centrality bins studied, we choose 24 event pools in the event-plane angle in our analysis.

The data samples used in this analysis were taken under two different magnetic field configurations of similar magnitude but opposite direction. The acceptance for oppositely charged tracks in the two magnetic field configurations is not exactly the same due to a slight offset of the beam line with respect to the center of STAR detector system. Only electrons from events with the same magnetic field configuration were mixed when constructing total mixed-event distributions.
The final number of event pools used in track multiplicity, vertex position, event plane angle, and magnetic field configuration is for this analysis of the 200 GeV minimum-bias AuAu data.
The statistics in the mixed-event distributions depend on the number of events chosen for the calculation. In practice, however, the calculation can be done to sufficient precision for every event pool with a sizable number of event pools under the limitations of the number of events during the calculation. The differences between mixed-event distributions with different number of events in the buffers are shown in Fig. 11. We observe no distortions beyond statistics in our calculation using a buffer of 50 events per event pool. With this choice, the statistical uncertainties in the mixed-event background are negligible compared to the same event distributions.

III.5.3 Mixed-event normalization
The unlike-sign and like-sign pair distributions in the same event (, ), and in the mixed-event (, ) were constructed in two dimensions (, ). The mixed-event unlike-sign distribution () provides the shape of the uncorrelated combinatorial background, with an overall normalization factor determined separately. The normalization factor was evaluated from the like-sign pair distribution using the technique described in Ref. [17]. This technique is susceptible to a systematic bias if correlated pairs exist in the the like-sign sample. Therefore, the kinematic region used to evaluate the normalization is carefully selected where such correlated backgrounds are negligible.
The procedure to obtain the normalized combinatorial background is described in Ref. [17] and also shown in the following Eq. 3:
| (3) |
N.R. denotes the integral calculated in a certain kinematic region, i.e. the normalization region. Table 2 lists the total like-sign pairs in the normalization region for each centrality class and the corresponding statistical uncertainties of the normalization factors.
| Centrality | Like-sign pairs in N.R. | Statistical un. |
|---|---|---|
| 0-80% | ||
| 0-10% | ||
| 10-40% | ||
| 40-80% |
The residual difference between same-event like-sign and the normalized mixed-event as a function of and is shown in the upper panel of Fig. 12. The difference is normalized by the expected statistical error in each kinematic bin. The residual difference distributions for all entries in different mass regions are shown in the bottom panel of Fig. 12. In the black box in the upper panel of Fig. 12, the normalized residuals follow the statistical fluctuation. We then chose this area GeV/ as the normalization region in our analysis. The systematic uncertainty introduced by the selected normalization region was studied by varying the selection as will be discussed in more detail in Section III-H.


In Fig. 13, the raw mass distributions of mixed-event like-sign and unlike-sign pairs in the full region are plotted together with the same event distributions. To further investigate any residual differences between these distributions, the ratios between them are plotted in Fig. 14. Panels (a-c) show that in the normalization region the residuals are negligible. The slight increasing trend in the higher mass region can be attributed to the possible jet-related correlated background [17]. This will be discussed further in Section III-E.5. The and centrality dependence of the inclusive unlike-sign and the normalized mixed-event mass distributions are shown in Fig. 15.


III.5.4 Like-sign and unlike-sign acceptance difference correction
The like-sign distribution is taken as the best estimate for the background in the inclusive unlike-sign distribution. However, the acceptances for like-sign and unlike-sign pairs differ in the STAR detector due to the magnetic field. The observed candidate and tracks versus are shown in Fig. 16. The empty strips along the direction are due to the TPC read-out sector boundaries. These acceptance boundaries and local inefficiencies or acceptance holes in the active detecting area will results in different acceptances for like-sign and unlike-sign pairs. We used the mixed-event technique to calculate these acceptance differences.
The correction factor for the acceptance difference between like-sign and unlike-sign pairs is obtained as a ratio of the like-sign and unlike-sign distribution from mixed-event. The ratio was calculated in each (, ) bin, and the corresponding correction applied in this 2D plane. The geometric mean from the two like-sign charge combinations , describes the background in the unlike-sign combinations in total pairs in spite of any detecting efficiency [17]. When calculating the combined like-sign pair in each kinematic bin, we use both the geometric mean and the direct sum of and pairs in the calculation to estimate the impact of potentially different detecting efficiencies for positive and negative tracks, shown in Eqs. 4 and 5.

| (4) |
and
| (5) |
where , , , and denote the distributions of like-sign and from the same event and mixed-event calculation, respectively. denotes the unlike-sign distribution from mixed-event calculations. denotes the acceptance-corrected like-sign background distribution.
In Fig. 17, the ratio of mixed-event unlike-sign and like-sign distributions is shown as a function of the pair mass integrated over . The structures observed in the ratio at low mass are caused by local inefficiencies and acceptance holes. This ratio has a dependence on the pair and a correction is applied to the like-sign distributions in the 2D (, ) plane.

There are additional inefficiencies from merging effects that are different for like-sign and unlike-sign pairs in a magnetic field. These inefficiencies can originate from TPC-track merging or TOF-hit merging. We use two-particle correlations to study this acceptance loss due to the TPC-track merging. We calculate the and correlations of like-sign and unlike-sign pairs in both same and mixed events. As a conservative estimation, we artificially remove a significant amount of the detection area near (,)= , and correct the background-subtracted spectra with the cut efficiency which was estimated by the mixed events. The difference in the final mass spectrum was 1%. The actual TPC hit resolution is around 1 mm, for which the expected acceptance hole due to the merging is significantly smaller than the estimate that is used. As a result, we conclude that effects due to track merging in the TPC are negligible.
Signal loss can also occur when two TPC tracks point to the same TOF read-out cell (size 63 cm2 at a typical radius of about 215 cm). The TOF matching algorithm removes any TPC-TOF association in this situation since it cannot resolve the timing of two close hits. To evaluate such losses, pairs are artificially removed for which the TPC tracks pointed to neighboring TOF cells, thereby increasing the acceptance hole by a factor of about 9. The impact on the final acceptance correction factor is 0.05% and limited to two particular mass regions (0.35 GeV/ due to unlike-sign pairs, 0.1 GeV/ due to like-sign pairs).
III.5.5 Correlated background
In this analysis, the like-sign distribution is used as the best estimate of the background in the inclusive unlike-sign distribution. The properly normalized mixed-event unlike-sign distributions were taken as the combinatorial background contribution. The difference between the like-sign and the mixed-event unlike-sign was used to understand the correlated background contributions.
The ratio of the acceptance corrected like-sign to the mixed-event unlike-sign distributions is shown in Fig. 18. In the low-mass region (1 GeV/), the difference is due to the cross-pair contributions such as , followed by . In the intermediate and high-mass regions, the like-sign and mixed-event distributions generally agree within our current precision, but also show a trend of an increasing excess with increasing mass. This trend is expected to be mostly due to back-to-back jet correlations.
We use a data-driven method to estimate the correlated background contribution. We fit the ratio in Fig. 18 in the mass region above 1 GeV/ with two different empirical functions: a second order polynomial and an exponential function. The small difference from unity in these fits is assigned as residual correlated background. We use the 68.3% confidence limits from the fit Eq. 6 (indicated by the dashed lines in the figure) as the systematic uncertainty on the correlated background. The lower limit of this uncertainty is consistent with unity, indicating that the like-sign background is consistent with the mixed-event unlike-sign background.
| (6) |


This residual background has been studied in different and different centrality bins. The acceptance correction factors, which are estimated via the ratio between unlike-sign and like-sign mixed-event distributions are shown in Fig. 19. In Fig. 19, the ratios of acceptance corrected like-sign backgrounds to mixed-event unlike-sign distributions are also shown for various and centrality selections. The acceptance correction factor shows a slight centrality dependence as the number of electron candidates is different in each centrality. On the other hand, it shows a strong dependence due to the varying track curvatures in the magnetic field for tracks as a function of . At sufficiently high , tracks are nearly straight, and the acceptance of like-sign and unlike-sign pairs is expected to be similar. A data-driven procedure was used to estimate the correlated background in each and centrality bin.
III.5.6 Signal extraction
In this analysis, the dielectron signal for invariant masses of 1.0 GeV/ is obtained by subtracting the same-event like-sign background from the inclusive unlike-sign distribution. In the higher mass region, we first subtract the combinatorial background using the mixed-event unlike-sign pairs for better statistical precision. The residual correlated background is evaluated by the data-driven method described in the previous subsection and subtracted together with the combinatorial background. The signal extraction evaluated over the entire invariant mass region reported here is described as follows:
| (7) |
where is the correlated background contribution normalized to the mixed-event combinatorial background and is 1.0 GeV/ in our default calculations. We vary this transition mass point between 1.02.0 GeV/ and find the difference in the final mass spectrum to be negligible (0.05%).
The raw signal invariant mass spectrum, , for 200 GeV AuAu minimum-bias collisions obtained by applying Eq. 7 is shown in the top panel of Fig. 20 along with the inclusive unlike-sign and background distributions. The bottom panel shows the signal-to-background ratio () in [31] and AuAu collisions. For the latter, the at = 0.5 GeV/ is about 1/200 in minimum-bias and 1/250 in 0-10% central collisions.

III.6 Efficiency and Acceptance Correction
The raw dielectron signal yields must be corrected for the detector efficiency and acceptance loss. In this section, we discuss separately the single-electron efficiencies and electron pair efficiencies.
III.6.1 Single-electron efficiency
The single-electron efficiency is determined by the product of the TPC tracking efficiency , the TOF matching efficiency , and the electron identification efficiency :
| (8) |
The TPC tracking efficiency, , was evaluated via the standard STAR embedding technique. In the embedding process, simulated electron tracks with a certain phase space definition were generated and then passed through the STAR detector geometry for the 2010 (2011) configuration using the Geant model. Next, the simulated detector signals were mixed with real data to have a realistic detector occupancy environment. The mixed signals were processed with the same offline reconstruction software that was used for the real data production. The tracking efficiency was studied by comparing the reconstructed tracks with the simulated input tracks. The input number of simulated tracks (5% of total event multiplicity) were constrained to prevent a sizable impact on the final single-track efficiency.
The electron track TOF-match efficiency, , was obtained from real data samples. Due to the limited pure electron statistics, we first used a pure pion sample in order to deduce the TOF-match efficiency. Pure pion samples were selected based on a TPC cut. We assume the TOF-match efficiencies for different particle species are similar in the region where cannot distinguish different particle species. Pure electron samples were selected to cross-check the efficiency scale differences between electrons and pions due to the decay loss of pions between the TPC and the TOF detectors as well as other effects. Electrons (or positrons) from photon conversion or Dalitz decays were identified by invariant mass and topological techniques and used as the high purity samples.
The TPC tracking and TOF matching efficiencies were calculated differentially in three dimensions . The pion TOF matching efficiency was also calculated in while a same scaling factor, which accounts for the TOF matching efficiency difference between pions and electrons, was used for all bins due to limited statistics. The choice of the binning in dimensions shows a negligible effect in the -integrated final dielectron pair efficiency.

The electron identification cut efficiency, , includes two components: efficiency due to the TOF cut () and efficiencies due to the PID selection criteria ().
| (9) |
Pure electron samples were used to study the TOF distributions. In order to estimate the efficiency, , we applied two methods to the distributions: a realistic function fit and direct counting. The difference in the results from the two methods was included in the systematic uncertainty.
The PID selection efficiency, , includes the efficiency due to the cut on both the number of points and which is used to select the electron candidates. The cut efficiency on the number of points, , was deduced using the pure pion samples in the real data. The results from the electron sample were consistent with those from pions in the region allowed by the statistics of the samples used. Then the efficiency from the pion samples was used in the final efficiency calculation in three dimensions . The cut efficiency, , was deduced via the same steps as described in Section III-D for calculating the electron purity and hadron contamination. With the extracted gaussian mean position and width values, the PID cut efficiency was calculated under the selection criteria described in Section III-C.
In the upper left panel of Fig. 21, , , and their product are shown for tracks in minimum-bias collisions. These efficiencies are averaged over and in azimuth. The ratios of at different centralities are shown in the bottom left panel of Fig. 21. The , and their product as a function of momentum are shown in the upper right panel of Fig. 21. The centrality dependence of is shown in the bottom right panel.
III.6.2 Electron pair efficiency
The dielectron pair efficiency was evaluated from the single-electron efficiency in the following two ways:
- •
Toy Monte Carlo simulation, which used the virtual photons as the input and let them decay into dielectrons isotropically.
- •
Cocktail simulation, which used the hadronic cocktail (see Secttion G) as input including the correlated heavy-flavor decay electrons from Pythia simulations [32].
In the final dielectron spectra, we have experimental ambiguities in separating heavy-flavor decayed dielectron yields from medium-produced dielectron yields (including contributions from both hadronic and partonic sources). Furthermore, the heavy-flavor decay dielectron production is not known in heavy-ion collisions due to possible medium modifications of the heavy-flavor correlations when compared to those in collisions. We used these two methods to estimate our dielectron pair efficiency. The single-electron efficiencies, described in the previous section, were folded in for each daughter track in a full three dimensional momentum space. The pair efficiency and acceptance was finally calculated in .
Shown in Fig. 22 are the dielectron pair efficiencies in the STAR acceptance ( GeV/, ) with . The difference in pair efficiency in the STAR acceptance between these two methods is small, ranging from about 3% at low , down to about 1% at high . And due to statistical limits of the cocktail simulation for the dielectron from heavy-flavor decay, we use the pair efficiency calculated from the virtual photon decay in this analysis and include the difference between these two methods in the systematic uncertainty.

The pair cut efficiency was evaluated using a embedding sample in which simulated particles with enriched Dalitz decays were embedded into the real data. The efficiency was calculated after re-weighting the input yield with a realistic distribution (details in the next part). We also used a pure virtual photon decay convoluted with the detector resolution for this calculation. The difference was included as the systematic uncertainty of the pair cut efficiency.
In Fig. 23, the pair efficiencies are shown as a function of pair in different mass regions. In the high /mass region the efficiency is almost constant as the single track efficiency turns stable at high (see Fig. 21). The -integrated pair efficiencies as a function of pair mass within STAR acceptance in AuAu collisions at = 200 GeV are shown in Fig. 24. The pair efficiency without the cut is also plotted, which contributes only in the very low mass region.


III.7 Hadronic cocktails
Dielectrons as measured by the detector originate from all stages in the evolution of heavy-ion collisions. These pairs include the decay products of long-lived particles which typically decay after they have frozen out of the medium. The contributions in the final dielectron spectrum can be evaluated as long as their yields at freeze-out are known.
The simulation process for constructing the contributions from such decays in AuAu collisions, often referred to as the hadronic cocktail, is similar to what has been done in collisions and reported in [31]. The cocktail simulations only contain the hadron form-factor decays in the vacuum at freeze-out. Cocktails included in our calculation contain contributions from decays of , , , , , , , , as well as from Drell-Yan (DY) production. A vacuum meson calculation is included separately when discussing the data compared to cocktail with the vacuum . For the hadron decay calculations, the input rapidity distributions are assumed to be flat within . The input yields within this rapidity window as well as the distributions are discussed below.
The charged pion yields at 200 GeV AuAu collisions have been accurately measured in the STAR acceptance [33, 34]. The input spectrum is taken as the averaged yield between STAR’s and measurements. Other light hadron yields include the meson, measured by PHENIX for 2 GeV/ [35], and meson data from STAR [36]. These hadron spectra together with hadron spectra (, , and ) measured by STAR and PHENIX were simultaneously fit to a core-corona based Tsallis Blast-Wave (TBW) model [37] where the core describes the AuAu bulk production and the corona describes the hard scattering contribution from like collisions.
In Fig. 25, the simultaneous fit results for all input hadron spectra are shown except for . The contribution is not considered as a component of the bulk medium. The cocktail input for was taken from the measurement by the PHENIX collaboration [38]. For light hadrons, the TBW functions provide good parameterizations to these measured spectra. For those hadron cocktail components without corresponding direct measurements (e.g. low , , ), we use the same core TBW parameters obtained from the fit and predict the spectral shapes for each of these unknown components, shown as solid curves in Fig. 25. The low spectrum was fixed by requiring the match with the measured data points at 2 GeV/, while the of meson was taken with the same values as used in the PHENIX publication [17]. The same set of TBW parameters from the simultaneous fit were used to generate the spectrum and the was tuned to match our dielectron yield in the peak region.
Additional corrections were applied to account for the differences in centrality and rapidity windows between the input hadron spectra and our dielectron measurements. The measured pion yields were calculated in the rapidity window of in Ref. [33] and in Ref. [34]. We used the pion rapidity distributions from the Hijing calculations and scaled the measured pion yields down by 3% to obtain the spectrum in the rapidity window of . This correction factor was also included in the uncertainty of the input . The different centrality windows matter when taking the minimum-bias data from PHENIX measurements, done in 0-92% centrality, and compare those to our results which are for 0-80% centrality. We corrected for this difference using the measured values in 0-92% and 0-80% centralities by the PHENIX experiment [39].
The correlated charm, bottom and Drell-Yan contributions were obtained from Pythia calculations [32] and scaled by the number of binary collisions in AuAu collisions for the default cocktail calculations. We used Pythia version 6.419 with parameter settings: MSEL=1, PARP(91) () = 1.0 GeV/ and PARP(67) (parton shower level) = 1.0. This setting was tuned to match our measured charmed meson spectrum in collisions [40]. The input charm-pair production cross section per nucleon-nucleon collision was also taken from charm meson measurements [40, 41]. We used the same PYTHIA setting to calculate the dielectron yields from correlated bottom decays and from the Drell-Yan production. The input bottom and Drell-Yan production cross sections are: b, 42 nb.
The meson contribution is expected to be modified due to a strong coupling to the hot QCD medium created in heavy-ion collisions. Therefore, the meson was not included in our default cocktail calculations. In the comparison between our measured dielectron spectra and the cocktail calculations including the vacuum , we used the meson measurements in peripheral collisions by STAR [42] and assumed a similar ratio in order to extrapolate to other centrality selections. The mass spectrum of the vacuum was taken the same line shape as reported in our dielectron measurement in collisions [31].
Table 3 summarizes all sources of the hadron cocktail and their decay branching ratios. The TBW [37] parametrizations were used to describe the input hadron distributions, shown in Fig. 25. The resulting pair mass distributions from the individual sources are normalized by the respective decay branching ratios and measured yields . Additional scaling parameters for various centrality bins are listed in Appendix A.
| source | B.R. | or | Uncertainty | Reference |
| 1.174 | 98.5 | 8% | STAR [33, 34] | |
| 7 | 7.86 | 30% | PHENIX [35, 17] | |
| 4.7 | 2.31 | 100% | PHENIX [17], STAR [31] | |
| 4.72 | 16.7 | 42% | STAR [42] | |
| 7.28 | ||||
| 7.7 | 9.87 | 33% | STAR [43] | |
| 2.95 | ||||
| 1.15 | 2.43 | 10% | STAR [36] | |
| 5.94 | 2.33 | 15% | PHENIX [38] | |
| 7.72 | 3.38 | 27% | PHENIX [44, 45] | |
| 1.03 | 15% | STAR [41] | ||
| 1.08 | = 3.7 b | 30% | Pythia[32] | |
| 3.36 | = 42 nb | 30% | Pythia[32] |

The mass spectra reported in this paper are not corrected for the STAR detector resolution. It is very challenging to precisely reproduce the momentum resolution in the STAR TPC simulation package in the high luminosity RHIC environment due to various distortion effects in the TPC detector. Instead a data-driven method was used to obtain the dielectron mass line shape in the cocktail simulation.
Based on the full detector simulation, the reconstructed electron probability distribution at a given input was parametrized with a double Crystal Ball function [46], defined as:
with
| (14) |
where , , , and . The value of is slightly shifted from 0 due to the electron energy loss in the detector material as STAR tracking accounts for the energy loss assuming all tracks are pions.
The resolution is taken as and assumed to follow the form:
| (15) |
For electrons .
We used the signal which has the most statistics and tuned the parameters and in the Eq. 15 to get the best match to the signal distribution. The two parameters were found to be /GeV and .
III.8 Systematic uncertainties
The major sources of systematic uncertainty that contribute to the final result in this analysis include:
- 1.
Normalization factor for mixed-event distributions
- 2.
Residual correlated background
- 3.
Like-sign/unlike-sign acceptance difference correction
- 4.
Hadron contamination
- 5.
Efficiency and acceptance corrections
The systematic uncertainty of the background of dielectron pairs was further separated in two mass regions, where we chose different background subtraction methods (see Eq. 7).
In the mass region of 1.0 GeV/, we obtained the signal by subtracting the mixed-event unlike-sign background plus the residual correlated background. The normalization of the combinatorial background, applied to the mixed-event unlike-sign distribution, is determined by comparing the like-sign same-event and mixed-event distributions. The statistics of the total like-sign pair in the normalization region is the dominant systematic uncertainty. We also chose different normalization ranges varying between the mass range of 1.2 2.0 GeV/. Other sources that we considered include the normalization method and the slight asymmetry between the total number of mixed-event unlike-sign and like-sign pairs. For the normalization method, we chose a different method compared to what was described in Section III-E, in this way we normalize the mixed-event unlike-sign distribution to the acceptance-corrected same-event like-sign distribution. Table 4 summarizes the contributions for each of the individual components to the systematic uncertainty of the normalization factors in minimum bias as well as for various other centralities from 200 GeV AuAu collisions.
The uncertainty in the residual correlated background was already mentioned in Section III-E.5. In the data-driven approach, the statistical uncertainty in determining the ratio of like-sign and mixed-event unlike-sign was used as the systematic uncertainty. The contribution to the final dielectron mass spectrum in minimum-bias collisions is about 10% from 1 GeV/ to 3 GeV/.
In the low mass region, 1.0 GeV/, we obtained the signal by subtracting the acceptance corrected like-sign background, in which the acceptance difference correction between like-sign and unlike-sign pairs was calculated using mixed-event distributions. Different event mixing methods by varying the different event categories and event pool sizes were chosen, and the largest deviations between these methods are used in the uncertainty calculation. The acceptance correction done in the 2D (, ) plane may suffer from limited statistics. The difference between the results calculated using the 2D acceptance correction and using the 1D ( only) acceptance correction was included in the systematic uncertainty as well.
| Like-sign pairs | Choice of N.R. | Norm. method | LS/US pair difference | Total | |
|---|---|---|---|---|---|
| MinBias | 0.05% | ||||
| 0-10 % | 0.04% | ||||
| 10-40% | 0.07% | ||||
| 40-80% | 0.56% |
The electron candidates contain a small amount of hadron contamination, which may be correlated with other particles (e.g. from resonance decays) and thus contribute to the final signal spectrum. To estimate this contribution, we first selected pure pion, kaon and proton samples with stringent TOF limits. We randomly picked hadrons from these pure samples according to the estimated hadron contamination levels in both the total amount and the differential yields, creating a hadron contamination candidate pool. The analysis procedure used in the dielectron analysis was applied to that pool to estimated the and correlated contributions.
The estimated hadron comtamination evaluated from and correlated contributions compared to the dielectron signal is shown in Fig. 26. Overall, the relative contribution to the final spectrum is 5% between 1 GeV/ and 3 GeV/.

The systematic uncertainties on the raw dielectron invariant-mass spectra for minimum-bias collisions are summarized in Fig. 27. As a conservative estimation, we took the sum of each individual component as the total systematic uncertainty.

For the reported dielectron yields in the STAR acceptance, the systematic uncertainty due to the efficiency correction includes uncertainties on the single-track efficiency, the pair efficiency evaluation method, and the pair cut () efficiency. Table 5 summarizes each individual component and their contributions to the total uncertainty of the single-track efficiency. The individual component contributions were determined by varying track selection cuts and comparing distributions between data and MC for the uncertainty on the TPC tracking efficiency (nHitsFits, DCA, etc.). The uncertainties on the TOF matching efficiency, the TOF PID cut efficiency, and the ndEdxFits cut efficiency were evaluated by comparing the results obtained from the pure electron samples from photon conversion and Dalitz decay. The difference between a realistic function fit and direct counting methods of the TOF distribution was also included in the uncertainty of the TOF PID cut efficiency. The electron pair efficiency evaluated from single tracks was described in Section III-F.2. Due to the unknown relative contributions between the correlated charm decays and the medium contribution, two extreme calculations were used as conservative estimates for the systematic uncertainty. This uncertainty is mostly constrained to the intermediate and high mass regions of the mass spectrum and ranges from about 3% at low down to 1% at high . The systematic uncertainty of the pair cut efficiency was evaluated by taking the difference between the calculations from the embedding sample and the virtual photon decay sample, which is about 3% at GeV/. The systematic uncertainty of the pair efficiency due to different methods is 5%. Finally the total systematic uncertainty of the electron pair efficiency is .
| component | uncertainty | |
| TPC | nHitsFits | |
| DCA | ||
| ndEdxFits | ||
| n | ||
| TOF | matching | |
| Total |
IV Results and Discussion
IV.1 Dielectron mass spectrum in minimum-bias collisions
The dielectron yields measured in the STAR acceptance ( GeV/, , and ) have been corrected for the dielectron reconstruction efficiencies. The efficiency correction was done in and . The -integrated efficiency-corrected dielectron mass spectrum at midrapidity in the STAR acceptance from 0-80% AuAu minimum collisions at = 200 GeV is shown in Fig. 28. The data are compared to the hadronic cocktail simulations without (upper left panel) and with (upper middle and upper right panels) the vacuum contribution. The vertical bars on the data points depict the statistical uncertainty, while the green boxes represent the systematic uncertainty. The ratios of the data over the cocktail simulations are shown in each of the bottom panels. The yellow band around unity indicates the uncertainties on the cocktail calculations. Those are mainly determined by the uncertainties on the and the decay branching ratios for each of the individual sources.


A few more remarks about cocktail calculations are in order:
- •
Since the mesons are strongly coupled to the medium in AuAu collisions, their contribution is considered part of the medium dilepton emission and depends on the properties of the medium. We only included the vacuum contribution as a reference here. In the default hadronic cocktail calculations, the contribution is omitted in order to allow for possible in-medium contributions depicted by model calculations.
- •
Correlated charm contributions included in the cocktail are the number-of-binary collisions () scaled results calculated from Pythia.
- •
Other hadron contributions are described in Section III-G.
Comparing the measured data points to the hadronic cocktail calculations in the LMR, an enhancement can be observed in the mass region between 0.30 and 0.76 GeV/. This enhancement cannot be fully explained by the expected vacuum meson contribution as shown in the right plot of Fig. 28. The data, integrated in the mass region of 0.300.76 GeV/, is a factor of 1.76 0.06 (stat.) 0.26 (sys.) 0.29 (cocktail) larger than the model cocktail without the vacuum contribution. This enhancement factor is significantly lower than what has been reported from the dielectron measurement in the PHENIX detector acceptance [17].
Detailed comparisons of the differences between the STAR and PHENIX experimental acceptances and cocktail simulations are unable to account for the measured enhancement difference. These details are described in Appendices B and C.
In the intermediate mass region (IMR), the cocktail simulations are dominated by correlated charm pair decays which are calculated from Pythia simulations. The simulations generally describe the data but run slightly below the data points, allowing for additional source contributions. The uncertainty on the charm production cross section at mid-rapidity, which is used for the normalization of this contribution, is around 15%. More precise measurements in this mass region of both the total charm cross-section as well as the correlation in AuAu collisions are needed to either verify or rule out significant contributions from other sources, such as QGP thermal radiation.
IV.2 Comparison to models
One major motivation for measuring dileptons is the study of chiral symmetry properties of the QCD medium created in the heavy-ion collisions. Restoration of the spontaneously broken chiral symmetry will lead to modification of the vector meson (short-lived meson in particular) spectral functions, which are accessible via dilepton measurements. There are two chiral symmetry restoration scenarios commonly used in calculations: (a)the drop of the pole mass or degeneracy of vector and axial-vector mesons due to the reduced condensate [10]; and (b) broadening of the spectral function due to many body collisions in the vector-meson dominance [2, 11, 47]. Both scenarios will introduce an enhancement in the mass region below the mass compared to the spectral function in vacuum. Precision measurement from the NA60 experiment demonstrated that the broadened scenario can reproduce the low mass dilepton enhancement data at SPS energy [16], while the dropping mass scenario failed to describe the data. It is anticipated that the hadronic medium at top RHIC energy is similar to that created at SPS energy, thus the dilepton production in the LMR region are comparable between SPS and RHIC.
The QGP contribution to the dilepton spectra has often been calculated perturbatively via Born annihilation at leading order. Various approaches have been studied to take into account high-order contributions at finite [48]. The QGP contribution is expected to become sizable for GeV/ at top RHIC energies due to a well established partonic phase.
There have been many model calculations for dielectron production at RHIC, with particular focus on the low mass region. We group these models into two categories and describe their features and predictions separately below.
Category I: Macroscopic effective many-body theory models.
In these models, the dilepton production in the hadronic medium is calculated via electromagnetic correlators based on the Vector-Meson Dominance Model (VDM) approach. Assuming a thermal equilibrated hadronic medium, dilepton rates are determined by the meson propagator in the medium, which depends on the interactions of the with mesons and baryons in this medium at finite and . It has been shown that the resulting broadened spectral function is mostly due to the interactions with the baryons rather than the mesons [49, 50, 51]. Thus, the medium total-baryon density, and not the net-baryon density or , is the critical factor in determining the dielectron yield in the heavy-ion collisions at these energies.
Dilepton production in the partonic phase is mostly calculated via perturbative annihilation with some improved corrections. It has been demonstrated in these calculations that the dilepton rates from the hadronic medium, extrapolated bottom-up to , should be equivalent to the rates from the partonic medium, extrapolated top-down to . This is referred to as the “parton-hadron” duality [49]. The final resulting dielectron yields for observation are calculated via the integral over the full space-time evolution for this medium. We have chosen one model calculation from Rapp [52] from this category in the following comparisons to our data. Some of the key ingredients in this model calculation are listed below:
- •
Initial spectral functions were fixed using the measurements from collision data [11].
- •
Space evolution was chosen to be a cylindrical expanding fireball [18]
- •
The latest Lattice QCD Equation-of-State (EOS) was used, in particular lower (170 MeV) and (160 MeV) values were chosen in the calculations shown here, which are slightly different compared to previous calculations from this same model.
- •
QGP radiation from the partonic phase was updated as well, and using the choice of the latest Lattice QCD EOS.
There are several other model calculations available in this category: some models chose different initial spectral functions [51], and several of them used the space-time evolution obtained from either ideal or viscous hydrodynamic model calculations [50, 51]. Calculations from these models show similar results compared to Rapp’s model and provide reasonable descriptions of the low-mass excess observed in our dielectron data in 200 GeV AuAu minimum-bias collisions.
Category II: Microscopic transport dynamic models.
We chose the Parton-Hadron String Dynamic (PHSD) transport model from this category when comparing to our data in the following sections. The PHSD transport approach incorporates the relevant off-mass-shell dynamics of the vector mesons and an explicit partonic phase in the early hot and dense reaction region as well as the dynamics of hadronization [53]. It allows for a microscopic study of the various dilepton production channels in non-equilibrium matter. In the hadronic sector, PHSD is equivalent to the HSD transport approach that has been used for the description of A and AA collisions from SIS to RHIC energies. It reproduces fairly well the measured hadron yields, rapidity distributions, and transverse momentum spectra [54]. The dilepton radiation by the constituents of the strongly interacting QGP is produced via: (i) basic Born annihilation, (ii) gluon Compton scattering (), and (iii) quark/anti-quark annihilation with the gluon bremsstrahlung in the final state (). Dilepton production in these partonic channels is calculated with off-mass-shell partons using a phenomenological parametrization for the quark and gluon propagators in the QGP.
The PHSD model has been used to calculate the dielectron yields in the STAR acceptance and it shows a fair agreement with our preliminary data [55].


Detailed comparisons of the model calculations with the data are shown in Fig. 29. In the LMR, the data and model calculations are in a fairly good agreement. In the IMR, the charm contribution is the most important component of spectrum. We discuss the effect of possible modification of this component in Section IV-F.
IV.3 dependence
To gain more insight into dielectron production, we studied the dependence of the dielectron yields in comparison to the hadron cocktail and model calculations. In different regions, comparisons to hadron cocktails require precise knowledge of the light hadron production in a wide region. Details of the cocktail calculations on the shape of input particle are described in Section III-G.
The measured dielectron yields within STAR acceptance in each individual region as well as the total expected hadron cocktail contributions are shown in the left panel of Fig. 30. Note that the correlated charm contributions, which become very important in the mass region from 0.53.0 GeV/, were all taken from the scaled Pythia calculations. The ratios of data over cocktail calculations as a function of for several transverse momentum ranges are shown in the right panels of Fig. 30. For comparison, the theoretical model calculations in each window are included as well. The enhancement factor with respect to the hadronic cocktail does not change significantly in these bins. Both theoretical models are able to reasonably describe the LMR excess in all bins.
We quantify the dependence by comparing the measured dielectron yields with the cocktail in each mass window within the STAR acceptance, the results from Au+Au 0-80% minimum-bias collisions at 200 GeV are shown in Fig. 31. The left panel shows the measured data points (markers) together with cocktail calculations (dashed lines). The ratios of the data over the cocktail are shown in the right panels for different mass windows. The data points and the cocktail calculations are in good agreement throughout the measured range up to 2 GeV/ in the mass regions of the (up to 0.15 GeV/), the / (0.761.05 GeV/), and the mesons (2.83.5 GeV/). In the LMR region, particularly in the mass region of 0.300.76 GeV/, we see that the relative enhancement in the data compared to the cocktail has no significant dependence. Table 6 summarizes the enhancement factors for each bin. In the IMR region, cocktail calculation can describe the data reasonably well. Due to the large uncertainty on the correlated charm contribution there is little constraint on other possible dilepton contributions, e.g., QGP thermal radiation.


| (GeV/) | yield () | yield/cocktail |
|---|---|---|
| 0 -0.5 | ||
| 0.5-1.0 | ||
| 1.0-1.5 | ||
| 1.5-2.0 |
IV.4 Centrality dependence
The dielectron spectra are studied in various centrality bins (0-10%, 10-40% and 40-80% ). The left panel of Fig. 32 shows the dielectron spectra in these centrality bins compared to cocktail calculations. The ratios of the data to the cocktail are presented in the right panels. Model calculations are also included in the right plots. In Fig. 33, we quantify the measured yields as a function of centrality by means of for different mass windows.
In the LMR, particularly in the mass region 0.300.76 GeV/, the observed enhancement factor of the dielectron yield with respect to the cocktail does not show a significant centrality dependence within current uncertainty. Both theoretical models can reasonably reproduce the centrality dependence of this observed enhancement in the LMR. Table 7 summarizes the enhancement factors for each centrality bin.
In Fig. 34, we overlay the dielectron mass spectra from minimum-bias and the most central (0-10%) collisions for which we are able to achieve sufficient statistics for direct comparisons. The -scaled spectra are plotted in the upper panel, and the ratio between them is plotted in the bottom panel. The measured ratio is consistent with unity in the invariant mass region, indicating that the production scales with . The ratio starts to increase in the mass around 0.51.0 GeV/. This observation is consistent with a picture in which the correlated charm contribution starts to be a dominant source in this mass region while charm quark production at RHIC is expected to rather scale with . Additionally, in this invariant mass range the in-medium meson contribution from the hadronic medium is expected to increase faster than when moving towards central collisions based on model calculations [52]. In the IMR, the data indicate there is potentially a systematic change in the mass spectra when comparing the minimum-bias and central collisions. This is suggestive of a possible modification of charmed hadron production or other contributions such as thermal radiation. To quantify the difference, exponential fits were performed to the mass spectra in central and minimum-bias collisions and the resulting exponential slopes differ by 1.5.


| centrality | yield () | yield/cocktail | ||
|---|---|---|---|---|
| 0 | - | 10% | ||
| 10 | - | 40% | ||
| 40 | - | 80% | ||
| 0 | - | 80% | ||
IV.5 Low mass excess yields
We subtracted the cocktail contribution from the measured dielecton mass spectrum to obtain the direct excess yields, shown in Fig. 35 for the mass region of 0.3-1.4 GeV/. The cocktail simulations used in the subtraction include the correlated charm contributions from Pythia assuming the scaling. A possible charm de-correlation leads to a negligible modification of the cocktail spectra in the mass region around 0.5 GeV/ as shown in Fig. 34. The obtained excess spectra in AuAu minimum-bias collisions are compared to model calculations in Fig. 35.
The systematic uncertainty across all the data points are highly correlated. We utilized the modified -test [56] to quantify the comparison between the data and the model calculations; the results are summarized in Table 8. The vacuum plus QGP scenario in Rapp’s implementation cannot describe our data well. The calculations, including the broadened -meson scenario plus QGP contribution from both Rapp and PHSD, have reasonable agreements with our data.

Next, we studied the centrality dependence of the excess yields. In Fig. 36, the integrated excess yields scaled by as a function of centrality () are shown in the -like mass region (0.30-0.76 GeV/). In the same figure, the -like (0.76-0.80 GeV/) and -like (0.98-1.05 GeV/) dielectron yields are plotted. For both sets, the yields were scaled by and the cocktail subtraction was not applied in this range. The -like and the -like dielectron yields show an scaling while the -like dielectron excess yields increase faster than as a function of centrality. The dashed curve depicts a power fit () to the -like dielectron yields with the cocktail subtracted. The fit result shows (stat.+uncorrelated sys.), indicating the dielectron yields in the -like region are sensitive to the QCD medium dynamics, as expected from medium modifications in theoretical calculations [52, 57].
| Model | -value | ||
|---|---|---|---|
| Rapp : | vacuum + QGP | 41.3/8 | 2.4 |
| Rapp : | broadened + QGP | 8.0/8 | 0.32 |
| PHSD : | broadened + QGP | 16.5/8 | 0.040 |

IV.6 Correlated charm contributions
The correlated charm contributions start to play an important role in our measured dielectron yields above 0.5 GeV/ and dominate the cocktail in the intermediate mass region. So far, no measurement of charm correlation in the low transverse moment region at RHIC exists in either or AA collisions. Single-charm hadron spectra or their decay (“non-photonic”) electron spectra have been measured in [40, 58] and AuAu collisions [59, 41]. We relied on the Pythia model to create the correlated charm pairs and then calculate the decay-electron pair distributions.
In collisions, with a tuned Pythia setting: MSEL=1, PARP(91) () = 1.0 GeV/ and PARP(67) (parton shower level) = 1.0, we have shown that this can reproduce the measured single -meson spectrum from 0.6 6 GeV/ [40]. The dielectron mass spectrum calculated with this Pythia tune also showed a good agreement with our measurement in the IMR in collisions at 200 GeV. However, the limited statistics in collisions do not allow us to determine whether Pythia can produce the correct correlation.
In AuAu collisions, we have observed that high- electrons are strongly suppressed compared to collisions. In the low region, various model calculations indicate that the single-charm spectrum can be modified due to interactions between charm quarks and the hot and dense medium [60]. Consequently, the correlation seen in collisions will be modified, or even be completely washed out [61]. To study their impact on the dielectron spectrum, we chose the following different configurations for the charm spectra and correlation functions to construct pairs.
- (a)
Keep the direct Pythia calculation which was used in our default cocktail calculations.
- (b)
Keep the momentum magnitude of charm decay electrons in Pythia, but randomly select the azimuthal angle direction. In this case, the angular correlation between two electrons is completely washed out.
- (c)
Randomly sample two electrons with the single electron , , distributions from Pythia calculation. In this case, the correlation between the two electrons is completely washed out.
- (d)
Based on (c), but sample the of each electron track according to the modified distribution based on the non-photonic electron measurement in AuAu collisions [59]. The electron was parametrized using the following function, with in units of GeV/.
(16)
All these calculations were scaled with in each centrality bin to obtain the correlated charm mass spectra. The correlated charm mass spectra for the above four cases in the most central (0-10%) AuAu collisions, and a comparison with the measured data, are shown in Fig. 37. The total cocktail shown is still calculated based on the default Pythia correlations. The figure shows that both the modification in electron momentum and the smearing in azimuthal angular correlation make the dielectron mass distribution steeper. Calculations for case (d) seem to be closer to the data points in the mass region of 13 GeV/, thus indicating a possibly modification of charmed hadron production in central AuAu collisions that is worthy of further experimental investigations. We also calculated the slope parameter in the transverse mass spectrum for each of the aforementioned cases, as is shown in Fig. 38.


IV.7 Low mass vector meson yields
The low mass vector meson ( and ) yields have been extracted from the dielectron decay channel through this analysis. The results reported here are from combined data taken in RHIC year 2010 and 2011 runs. The measured yields are consistent with the results from a recent STAR publication [62]. Figure 39 shows the invariant mass distributions of the vector mesons and from = 200 GeV AuAu minimum-bias collisions. The signal spectra are reconstructed by subtracting the normalized mixed-event unlike-sign background (Section III-E3) from the inclusive same-event unlike-sign distribution. A Breit-Wigner function plus a second order polynomial function are used to fit the invariant mass distributions. The second order polynomial function is used to describe the residual background. In addition, we use the vector meson () invariant mass distributions (line-shapes) directly from cocktail simulations (Breit-Wigner plus Gaussian functions) to fit the signal. As described in Section III-G, the detector momentum resolution in the cocktail simulation was estimated by tuning the simulation to match the signals in the data. The line shapes from this tuned simulation for the and mesons reproduce the signal well. The difference between these two methods is included in the systematic uncertainty of the raw yield. Figure 40 shows the and invariant mass distributions in different regions.


Although the mass and width of vector mesons could be modified due to interactions with the hot and dense medium, the observed and spectra from the detector will have little sensitivity to such an effect. The lifetimes of and mesons are much longer than the typical lifetime of the medium created in high energy heavy-ion collisions. Therefore, the freeze-out and mesons will dominate the observed yields. We obtained the widths and mass positions of and signals from data and compared them to the values from the PDG as well as from our simulations, shown in Fig. 41.
The mass positions of the and mesons from our data generally agree with the PDG values, with a slight shift towards lower values. This is mainly because the STAR tracking algorithms account for the energy loss assuming pions. The observed mass shift (1-2 MeV/) for and mesons are within the uncertainties of the particle energy loss correction in our GEANT simulations. The widths of the mass distribution are larger than the PDG values as expected, due to detector resolution effects. A tuned simulation, using the mass distribution (described in Section III-G), can reproduce well the observed signal widths for and mesons in the full region reported here. Because of uncertainty in the description of materials, including accessory components in the STAR detector system, we included the difference between the tuned simulation and the GEANT simulation in the width calculation as part of our systematic uncertainty. Since the mass and width are well reproduced by the tuned simulation, we fixed the mass and width with the value from the tuned simulations when using the Breit-Wigner function to extract the differential yield.


In order to present the final -differential invariant cross section, the raw vector meson yields are corrected for the detector’s acceptance and efficiency. Figure 42 shows the total detector acceptance and efficiency as a function of for and . In Fig. 43, the final differential invariant yields are shown for and from = 200 GeV AuAu collisions at mid-rapidity (). The systematic uncertainties include the detector efficiency uncertainty and the raw signal extraction uncertainty. The latter is derived from changing the fit range, the function used for describing the background and the method used to extract the yields. The spectrum measured from decays is consistent with the previous results measured from the hadronic decay channel () [36]. Also included in the figure are the TBW-model [37] fit to the previous data points as well as a prediction of the spectrum with the same set of parameters obtained from the simultaneous fit to all available light hadrons (see Section III-G). The TBW prediction describes the measured spectrum well. The measured for the meson is 8.460.67(stat.)1.59(syst.), and for the meson is 2.200.10(stat.)0.34(syst.).

V Summary
We have reported STAR measurements of dielectron yields at mid-rapidity in AuAu collisions at = 200 GeV. The measured dielectron yields within the STAR acceptance (defined by GeV/, , and ) show an enhancement when compared to hadronic cocktail calculations in the mass region below . The enhancement factor, integrated over the mass region of 0.30 0.76 GeV/ and the full acceptance, is 1.76 0.06 (stat.) 0.26 (sys.) 0.29 (cocktail). Further systematic measurements show that this enhancement factor has a mild centrality and dependence. A vacuum spectral function cannot fully describe the measured dielectron mass spectrum in this mass region. This enhancement factor is significantly lower than what has been reported by PHENIX. We have compared the STAR and PHENIX cocktail simulations and applied PHENIX azimuthal acceptance. We found that neither differences in the acceptance nor the cocktail simulations can explain the difference in the enhancement factor measured by the two experiments.
We compared our results to model calculations including an effective many-body model (Rapp) and a microscopic transport model (PHSD). Both models invoked an in-medium modified spectral function through the interactions with mesons and baryons in the bulk medium. Both can reproduce the low-mass excess in our data reasonably well, including the and centrality dependences. A power-law fit to the excess yield in the -like region as a function of gives a power of 1.440.10. We noted that the many-body model calculations have successfully explained the SPS low-mass dilepton data. These findings could indicate that the property of the hadronic medium that governs the dilepton production in the low-mass region is similar at top SPS and top RHIC energies despite the difference in center-of-mass energies of more than an order of magnitude. Dielectron measurements from the RHIC beam energy scan program will offer a unique opportunity to fill the energy gap between the SPS and RHIC and systematically evaluate the energy dependence of dielectron production.
We also reported the measurement of meson production, and meson production through the dielectron decay channel in AuAu collisions at = 200 GeV. The observed signal widths and mass positions are well reproduced in Monte Carlo simulations. The measured invariant yield spectrum through the decay channel is consistent with the previously published STAR measurement based on the decay channel. The invariant yield spectrum can be well reproduced by Tsallis Blast-Wave model predictions which use the same set of parameters obtained from a simultaneous fit to all other available light hadrons. This indicates that the mesons behave much like the bulk medium, with similar radial flow velocity.
The understanding of the dielectron production in the mass region of 13 GeV/ is currently limited both statistically and systematically. We reported the inclusive dielectron yields which include the contribution from correlated charm decays. However, at this time we do not know the characteristics of the charm contribution in AuAu collisions. The dielectron data from 0-80% minimum-bias collisions can be fairly well described by the number-of-binary-collisions scaled contribution based on Pythia calculations. The ratio between the central and minimum-bias spectra in the mass region of 1-3 GeV/ shows a moderate deviation from the scaling (1.8 deviation for the data point at 1.8-2.8 GeV/). This could be indicative of the modification of the correlated charm contribution or the existence of other contributing sources in AuAu collisions. The difference in the mass region 1-3 GeV/, if confirmed in future measurements with a better precision, would constrain the magnitude of the de-correlating effect on charm pairs while traversing the QCD medium and/or other possible dielectron sources, e.g., QGP thermal radiation, from central Au+Au collisions at RHIC.
We thank the RHIC Operations Group and RCF at BNL, the NERSC Center at LBNL, the KISTI Center in Korea, and the Open Science Grid consortium for providing resources and support. This work was supported in part by the Office of Nuclear Physics within the U.S. DOE Office of Science, the U.S. NSF, CNRS/IN2P3, FAPESP CNPq of Brazil, the Ministry of Education and Science of the Russian Federation, the NNSFC, the MoST of China (973 Program No. 2014CB845400), CAS, the MoE of China, the Korean Research Foundation, GA and MSMT of the Czech Republic, FIAS of Germany, DAE, DST, and CSIR of India, the National Science Centre of Poland, National Research Foundation (NRF-2012004024), the Ministry of Science, Education and Sports of the Republic of Croatia, and RosAtom of Russia.
Appendix A Centrality-dependent Cocktail Simulation Inputs
When comparing to the measured spectra, the hadron cocktails were simulated for each of the corresponding centrality bins (0-10%, 10-40% and 40-80%). The centrality dependence of the input hadron distributions were obtained from the similar Tsallis Blast-Wave function fit to the available data, including , , etc. For other hadrons with no available measurements, we use the Tsallis Blast-Wave predictions for the input distributions. The input for all the components in each centrality bin were then scaled with the relative pion yields, , with respect to minimum-bias collisions. Correlated-charm contributions are scaled by the number of binary collisions for a given centrality. All of these scale factors are summarized in Table 9.
| centrality | dN()/dy | ||
|---|---|---|---|
| 0-80% | 98.49 | 1 | |
| 0-10% | 279.2 | 2.834 | |
| 10-40% | 131.1 | 1.331 | |
| 40-80% | 30.45 | 0.309 |
Appendix B Detector Acceptance Effect
The STAR mid-rapidity detectors cover the full azimuth (0 2) for 1 while the PHENIX central arms (used for the dielectron analysis) cover about at 0.35. To investigate the impact of the detector acceptance effect on the final dielectron mass spectrum, we tried to narrow down the single-track acceptance cut to match the PHENIX acceptance as best as possible. We acknowledge that fully reproducing another experiment’s acceptance is virtually impossible due to subtle differences in detector structures and performances. Instead, the STAR data is selected with the PHENIX azimuthal angle acceptance cut. Due to the limited statistics, we cannot further reduce the pseudorapidity window to match the respective PHENIX range. In addition, we also expect the physics is not significantly different between and rapidity ranges for 200 GeV collisions.
As a result of the magnetic field, the signal track acceptance varies with . We used the kinematic acceptance cut presented in the PHENIX publication [17]:
| (17) |
where = 0.206 radGeV/ and = 0.309 radGeV/ represent the effective azimuthal bend to DC and RICH, respectively. One arm covers the region from - to , while the other arm covers from to .
The electron candidate occupancy distributions for STAR data selected with the PHENIX acceptance cut are shown in Fig. 44. The upper panel shows the regular versus for negative charged particles, while the bottom panel shows 1/ versus for both charges. The plots show that while we can capture the basic acceptance structure, the inner fine structure within this azimuthal angle acceptance may be slightly different due to different detector structure for both experiments.

With the electron candidates selected, we then carried out the same analysis procedure as described in Section III. In Fig. 45 panels (a), (b), (c), the ratio is shown for like-sign distributions between same events and mixed events from which we determine the normalization factor of the mixed-event unlike-sign distribution for the combinatorial background.

We compared the acceptance difference correction factor between the results with and without the PHENIX acceptance, as shown in Fig. 46. One can clearly see that the acceptance cut changes the pair acceptance between like-sign and unlike-sign pairs significantly in the low-mass region, and the maximum of this ratio appears around 0.5 GeV/.


The combinatorial background is subtracted from the inclusive unlike-sign pair distribution to obtain the raw signal, then the raw signal distribution is corrected for the detector efficiency. Finally we obtained the signal dielectron invariant mass spectrum from 200 GeV minimum-bias AuAu collisions and compared it to hadronic cocktail simulations, shown in the left panel in Fig. 47. In the low-mass region of 0.30-0.76 GeV/, we observed an enhancement of a factor of 2.40.37(stat.)0.38(sys.)0.29(cocktail) when comparing the measured yield to the hadronic cocktail. Selecting our data within the PHENIX acceptance does not appear to reproduce the large enhancement factor in the low-mass region observed by the PHENIX collaboration [17].
We added in the medium dielectron contributions from theoretical model calculations. The right plot of Fig. 47 shows the data compared to the cocktail plus the broadened spectrum in the hadronic medium and QGP thermal radiation. The particular calculation that is included here is only valid for 1.5 GeV/. The medium contribution from this model (hadronic and QGP radiation) describes the observed low-mass excess very well.


Appendix C Cocktail comparison between STAR and PHENIX
In this appendix, we compare the cocktail simulation results between PHENIX and STAR. The details of the light hadron decays and Dalitz decays into dielectrons are described in [31]. We used the input yields for cocktail calculations in this comparison and we folded in the PHENIX acceptance filter, described in Eq. 17. Next, we compared the output to the PHENIX cocktail calculations.
The comparison for the total cocktail summed yield is shown in Fig. 48. The comparisons for each cocktail component are shown in Fig. 49. We see that the cocktail calculations from both experiments agree reasonably well. There are some small differences in the , , Dalitz decay distributions which can be attributed to different choices of decay form factors in these Dalitz decays.


References
- [1] J. Adams et al. [STAR Collaboration], Nucl. Phys. A 757, 102 (2005); K. Adcox et al. [PHENIX Collaboration], Nucl. Phys. A 757, 184 (2005); B.B. Back et al. [PHOBOS Collaboration], Nucl. Phys. A 757, 28 (2005); I. Arsene et al. [BRAHMS Collaboration], Nucl. Phys. A 757, 1 (2005).
- [2] R. Rapp and J. Wambach, Adv. Nucl. Phys. 25, 1 (2000).
- [3] R. Rapp, Phys. Rev. C 63, 054907 (2001).
- [4] J. Deng, Q. Wang, N. Xu and P. Zhuang, Phys. Lett. B 701, 581 (2011).
- [5] R. Chatterjee, D.K. Srivastava, U. Heinz and C. Gale, Phys. Rev. C 75, 054909 (2007).
- [6] E. Shuryak, arXiv: 1203.1012.
- [7] L. Adamczyk et al. [STAR Collaboration], Phys. Rev. C 90, 064904 (2014).
- [8] R. Arnaldi et al. [NA60 Collaboration], Phys. Rev. Lett. 102, 222301 (2009).
- [9] P.M. Hohler and R. Rapp, Phys. Lett. B 731, 103 (2014).
- [10] G.E. Brown and M. Rho, Phys. Rep. 269, 333 (1996).
- [11] R. Rapp and J. Wambach, Eur. Phys. J. A 6, 415 (1999).
- [12] R.J. Porter et al. [DLS Collaboration], Phys. Rev. Lett. 79, 1229 (1997); H.Z.Huang et al. [DLS Collaboration], Phys. Lett. B 297, 233 (1992); G. Roche et al. [DLS Collaboration], Phys. Lett. B 226, 228 (1989).
- [13] G. Agakichiev et al. [HADES Collaboration], Phys. Rev. Lett. 98, 052302 (2007); Phys. Rev. C 84, 014902 (2011).
- [14] A.L.S Angelis et al. [HELIOS/3 Collaboration], Eur. Phys. J. C 13, 433 (2000).
- [15] D. Adamova et al. [CERES Collaboration], Phys. Rev. Lett. 91, 042301 (2003); G. Agakichiev et al. [CERES Collaboration], Phys. Rev. Lett. 75, 1272 (1995); Phys. Lett. B 422, 405 (1998); Eur. Phys. J. C 41, 475 (2005).
- [16] R. Arnaldi et al. [NA60 Collaboration], Phys. Rev. Lett. 96, 162302 (2006); Phys. Rev. Lett. 100, 022302 (2008); Eur. Phys. J. C 59, 607 (2009).
- [17] A. Adare et al. [PHENIX Collaboration], Phys. Rev. C 81, 034911 (2010).
- [18] H. van Hees and R. Rapp, Phys. Rev. Lett. 97, 102301 (2006); Nucl. Phys. A 806, 339 (2008).
- [19] J. Ruppert, C. Gale, T. Renk, P. Litchard and J.I. Kapusta, Phys. Rev. Lett. 100, 162301 (2008); T. Renk and J. Ruppert, Phys. Rev. C 77, 024907 (2008).
- [20] K. Dusling, D. Teaney and I. Zahed, Phys. Rev. C 75, 024908 (2007).
- [21] O. Linnyk, E. L. Bratkovskaya, V. Ozvenchuk, W. Cassing, and C. M. Ko, Phys. Rev. C 84, 054917 (2011).
- [22] L. Adamczyk et al. [STAR Collaboration], Phys. Rev. Lett. 113, 022301 (2014).
- [23] Special Issue on RHIC and Its Detectors, edited by M. Harrison, T. Ludlam, and S. Ozaki, Nucl. Instr. Meth. A 499, No. 2-3 (2003).
- [24] M. Anderson, et al., Nucl. Instr. Meth. A 499, 659 (2003).
- [25] STAR TOF proposal, STAR Note SN0621, https://drupal.star.bnl.gov/STAR/starnotes/public/sn0621.
- [26] W.J. Llope, et al., Nucl. Instr. Meth. A 522, 252 (2004).
- [27] M. Shao et al., Nucl. Instr. Meth. A 558, 419 (2006).
- [28] GEANT 3.21, CERN program library. http://wwwasdoc.web.cern.ch/wwwasdoc/geant_html3/geantall.html.
- [29] J. Adams et al. [STAR Collaboration], Phys. Lett. B 612, 181 (2005); Phys. Rev. C 71, 064902 (2005); Phys. Rev. Lett. 94, 062301 (2005).
- [30] A.M. Poskanzer and S.A. Voloshin, Phys. Rev. C 58, 1671 (1998); J. Adams et al. [STAR Collaboration], Phys. Rev. C 72, 014904 (2005).
- [31] L. Adamczyk et al. [STAR Collaboration], Phys. Rev. C 86, 024906 (2012).
- [32] T. Sjostrand, P. Edén, C. Friberg, L. Lönnblad, G. Miu, S. Mrenna, and E. Norrbin, Comput. Phys. Commun. 135, 238 (2001).
- [33] J. Adams et al. [STAR Collaboration], Phys. Rev. Lett. 92, 112301 (2004).
- [34] B.I. Abelev et al. [STAR Collaboration], Phys. Rev. Lett. 97, 152301 (2006).
- [35] S.S. Adler et al. [PHENIX Collaboration], Phys. Rev. C 75, 024909 (2007).
- [36] J. Adams et al. [STAR Collaboration], Phys. Lett. B 612, 181 (2005).
- [37] Z. Tang, Y. Xu, L. Ruan, G. van Buren, F. Wang, and Z. Xu, Phys. Rev. C 79, 051901 (2009); Z.-B. Tang, L. Yi, L.-J. Ruan, M. Shao, C. Li, H.-F. Chen, B. Mohanty, and Z.-B. Xu, Chin. Phys. Lett. 30, 031201 (2013).
- [38] A. Adare et al. [PHENIX Collaboration], Phys. Rev. Lett. 98, 232301 (2007).
- [39] S.S. Alder et al. [PHENIX Collaboration], Phys. Rev. Lett. 91, 072301 (2003); Phys. Rev. C 69, 034909 (2004).
- [40] L. Adamczyk et al. [STAR Collaboration], Phys. Rev. D 86, 072013 (2012).
- [41] L. Adamczyk et al. [STAR Collaboration], Phys. Rev. Lett. 113, 142301 (2014).
- [42] J. Adams et al. [STAR Collaboration], Phys. Rev. Lett. 92, 092301 (2004).
- [43] B. Huang. (for the STAR Collaboration), Acta Phys. Pol. B Proc. 5, 471, (2012).
- [44] R. Gavai et al., Int. J. Mod. Phys. A 10, 3043 (1995).
- [45] C. da Silva, Nucl. Phys. A 830, 227C (2009).
- [46] J.E.Gasier, Ph.D. Thesis, SLAC-R-255 (1982).
- [47] V.L. Elestsky et al., Phys. Rev. C 64, 035202 (2001).
- [48] E. Braaten, R.D. Pisarski and T.C. Yuan, Phys. Rev. Lett. 64, 2242 (1990).
- [49] R. Rapp, J. Wambach and H. van Hees, arXiv: 0901.3289.
- [50] H. J. Xu, H. F. Chen, X. Dong, Q. Wang, and Y. F. Zhang, Phys. Rev. C 85, 024906 (2012).
- [51] G. Vujanovic, C. Young, B. Schenke, S. Jeon, R. Rapp, and C. Gale, Nucl. Phys. A 904, 557c (2013); G. Gujanovic, C. Young, B. Schenke, R. Rapp, S. Jeon, and C. Gale, Phys. Rev. C 89, 034904 (2014).
- [52] R. Rapp, PoS CPOD2013, 008 (2013); R. Rapp, private communications.
- [53] W. Cassing and E.L. Bratkovskaya, Nucl. Phys. A 831, 215 (2009); E.L. Bratkovskaya, W. Cassing, V.P. Konchakovski, and O. Linnyk, Nucl. Phys. A 856, 162 (2011).
- [54] W. Cassing and E.L. Bratkovskaya, Phys. Rep. 308, 65 (1999); E.L. Bratkovskaya and W. Cassing, Nucl. Phys. A 619, 413 (1997); W. Ehehalt and W. Cassing, Nucl. Phys. A 602, 449 (1996).
- [55] O. Linnyk et al., Phys. Rev. C 85, 024910 (2012).
- [56] A. Adare et al. [PHENIX Collaboration], Phys. Rev. C 77, 064907 (2008).
- [57] U. Heinz and K.S. Lee, Phys. Lett. B 259, 162 (1991).
- [58] H. Agakishiev et al. [STAR Collaboration], Phys. Rev. D 83, 052006 (2011).
- [59] A. Adare et al. [PHENIX Collaboration], Phys. Rev. Lett. 98, 172301 (2007).
- [60] M. He, R.J. Fries and R. Rapp, Phys. Rev. Lett. 110, 112301 (2013); P.B. Gossiaux et al., arXiv: 1207.5445.
- [61] X. Zhu, P. Zhuang, and N. Xu, Phys. Rev. Lett. 100, 152301 (2008); X. Zhu et al., Phys. Lett. B 647, 366 (2007).
- [62] L. Adamczyk et al. [STAR Collaboration], arXiv: 1503.04217.