FSQ-12-005
\RCS \RCS \cmsNoteHeaderFSQ-12-005
Measurement of diffractive dissociation cross sections in collisions at \TeV
Abstract
Measurements of diffractive dissociation cross sections in collisions at \TeVare presented in kinematic regions defined by the masses and of the two final-state hadronic systems separated by the largest rapidity gap in the event. Differential cross sections are measured as a function of in the region , for , dominated by single dissociation (SD), and , dominated by double dissociation (DD), where and are given in \GeVns. The inclusive cross section is also measured as a function of the width of the central pseudorapidity gap for , , and , a region dominated by DD. The cross sections integrated over these regions are found to be, respectively, \unitmb, \unitmb, and \unitmb, and are used to extract extrapolated total SD and DD cross sections. In addition, the inclusive differential cross section, , for events with a pseudorapidity gap adjacent to the edge of the detector, is measured over = 8.4 units of pseudorapidity. The results are compared to those of other experiments and to theoretical predictions, and found compatible with slowly-rising diffractive cross sections as a function of center-of-mass energy.
0.1 Introduction
A significant fraction (25%) of the total inelastic proton–proton cross section at high energies can be attributed to diffractive interactions, characterized by the presence of at least one non-exponentially suppressed large rapidity gap (LRG), i.e. a region of pseudorapidity devoid of particles, where for a particle moving at a polar angle with respect to the beam . If this region is adjacent to the diffractively scattered proton it is called a forward pseudorapidity gap. In hadronic interactions an LRG is presumed to be mediated by a color-singlet exchange carrying the vacuum quantum numbers, commonly referred to as Pomeron exchange. Figure 1 defines the main types of diffractive processes: single dissociation (SD), double dissociation (DD), and central diffraction (CD).
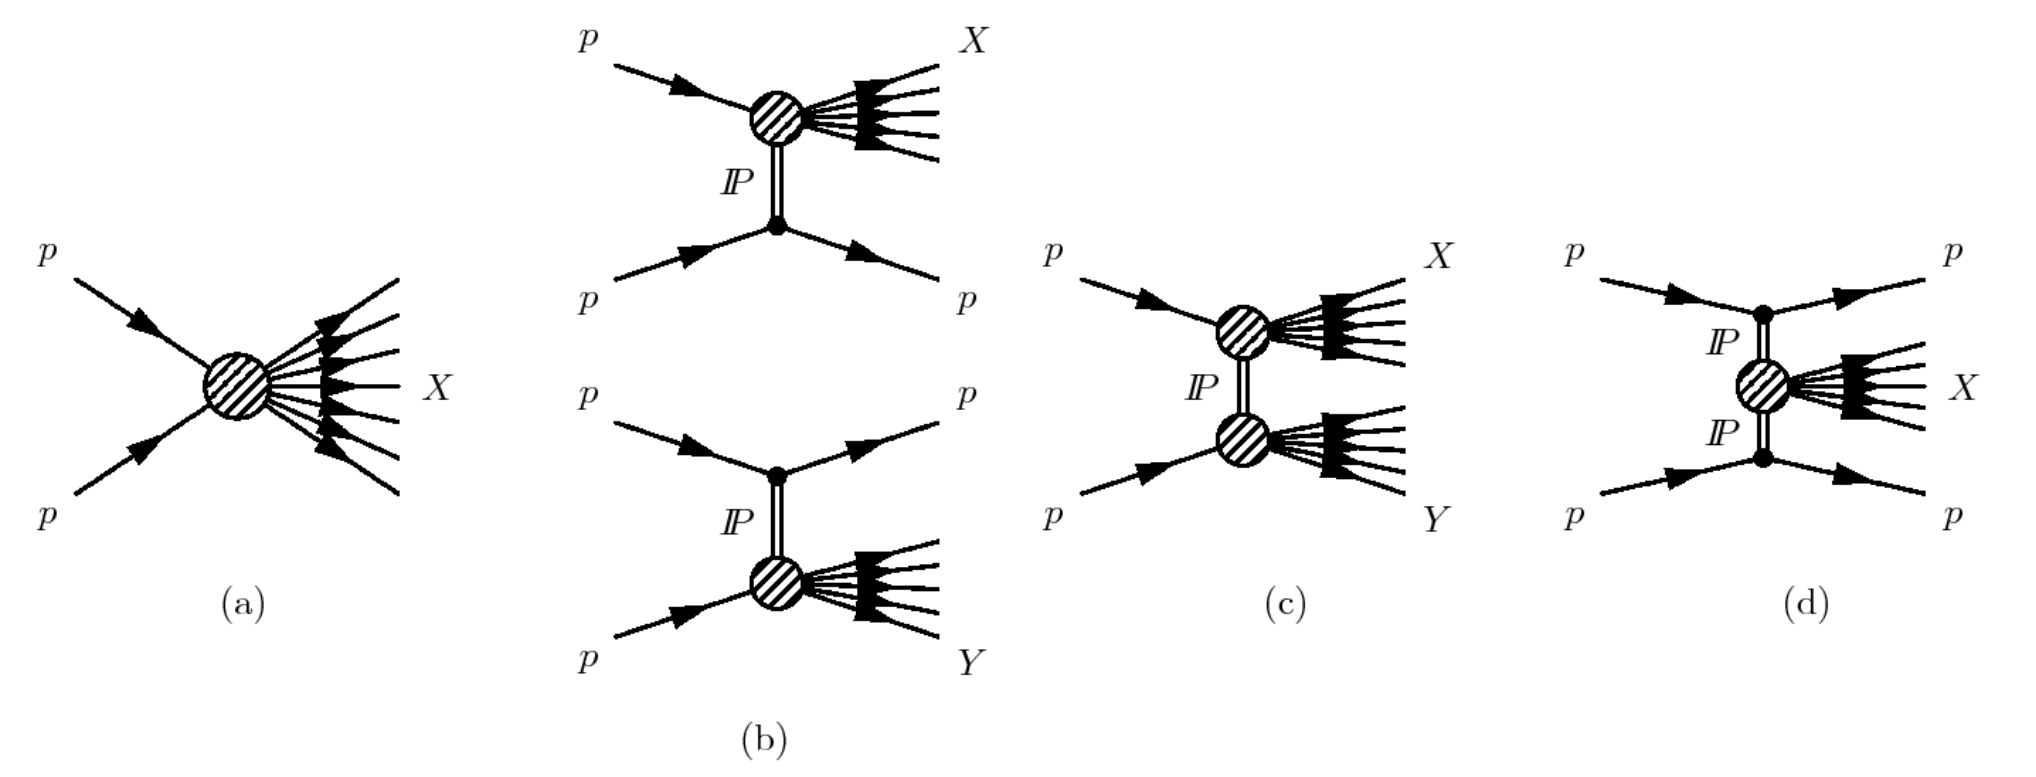
Inclusive diffractive cross sections cannot be calculated within perturbative quantum chromodynamics, and are commonly described by models based on Regge theory (see \eg [1] and references therein). The predictions of these models generally differ when extrapolated from the Tevatron center-of-mass energies of \TeVto LHC energies. Therefore, measurements of diffractive cross sections at 7\TeVprovide a valuable input for understanding diffraction and improving its theoretical description. They are also crucial for the proper modeling of the full final state of hadronic interactions in event generators, and can help to improve the simulation of the underlying event, as well as of the total inelastic cross section.
The DD cross section has been recently measured at \TeVby the TOTEM collaboration [2], for events in which both dissociated-proton masses are below 12\GeV. Other measurements of diffractive cross sections at the LHC, with higher dissociation masses, have either a limited precision [3] or no separation between SD and DD events [4]. In this paper, we present the first CMS measurement of inclusive diffractive cross sections at \TeV. This measurement is based on the presence of a forward LRG, with SD- and DD-dominated event samples separated by using the CASTOR calorimeter [5], covering the very forward region, . A data sample with a central LRG, in which DD dominates, is also used. In addition, the inclusive differential cross section, , for events with a pseudorapidity gap adjacent to the edge of the detector, is measured over = 8.4 units of pseudorapidity, and compared to a similar ATLAS measurement [4]. The results presented here are based on the first CMS data collected at \TeVduring the 2010 LHC commissioning period, when the probability of overlapping interactions in the same bunch crossing (pileup), which may spoil the detection of the gap, was low.
The paper is organized in eleven sections and two appendices. The CMS detector is described in Section 0.2. Section 0.3 presents the Monte Carlo (MC) simulations used in the analysis. The event selection and the diffractive event topologies used to measure the cross sections are discussed in Sections 0.4 and 0.5, respectively. Sections 0.6, 0.7, and 0.8 present the measurement of the forward-gap and central-gap differential cross sections, and the integrated cross sections, respectively. All cross sections are extracted within the detector acceptance and with minimal model-dependent systematic uncertainties. The extrapolation of the measured cross sections to the low mass regions is discussed in Section 0.9. Section 0.10 presents the measurement of the pseudorapidity gap cross section and its comparison to the ATLAS result [4]. The systematic uncertainties for all the measurements are discussed in Section 0.11. A summary is given in Section 0.12. Appendices A and B present additional comparisons between the diffractive MC models used.
0.2 The CMS detector
A detailed description of the CMS detector, together with a definition of the coordinate system used and the relevant kinematic variables, can be found in Ref. [6]. The central feature of the apparatus is a superconducting solenoid of 6 m internal diameter, providing a 3.8\unitT axial field. Within the field volume are located a silicon pixel and strip tracker, a crystal electromagnetic calorimeter (ECAL), and a brass/scintillator hadron calorimeter. Muons are measured in gas-ionization detectors embedded in the steel flux-return yoke of the magnet. The calorimeter cells are grouped in projective towers, of granularity at central rapidities and at forward rapidities. In addition to the barrel and endcap detectors, CMS has extensive forward calorimetry. The forward component of the hadron calorimeter, HF (), consists of steel absorbers with embedded radiation-hard quartz fibers, providing fast collection of Cherenkov light. The very forward angles are covered at one end of CMS () by the CASTOR calorimeter [5], made of quartz plates embedded in tungsten absorbers, segmented in 16 -sectors and 14 -modules.
Two elements of the CMS monitoring system, the Beam Scintillator Counters (BSC) and the Beam Pick-up Timing eXperiment (BPTX) devices, are used to trigger the CMS readout. The two BSC are located at a distance of 10.86\unitm from the nominal interaction point (IP) and are sensitive in the range 3.23 to 4.65. Each BSC consists of 16 scintillator tiles. The BSC elements have a time resolution of 3\unitns and an average minimum ionizing particle detection efficiency of 96.3%. The two BPTX devices, located around the beam pipe at a distance of 175\unitm from the IP on either side, are designed to provide precise information on the bunch structure and timing of the incoming beams, with better than 0.2 ns time resolution.
0.3 Monte Carlo simulation
Monte Carlo simulations are used to correct the measured distributions for the geometrical acceptance and reconstruction efficiency of the CMS detector, as well as for migrations from true to reconstructed values in the distributions of kinematic variables. We use \PYTHIA8.165 [7, 8] to generate samples of inelastic events. We compare the detector-level data distributions to the \PYTHIA8 4C [8] and \PYTHIA8 MBR (Minimum Bias Rockefeller) [9] simulations and extract integrated cross sections using \PYTHIA8 MBR.
Diffractive events in the \PYTHIA8 4C simulation are generated according to the Schuler–Sjöstrand model implemented in \PYTHIA6 [7]. The 4C tune [8] includes a downward scaling of the Schuler–Sjöstrand SD and DD cross sections at \TeVby 10 and 12%, respectively.
The \PYTHIA8 MBR generator predicts the energy dependence of the total, elastic, and inelastic cross sections, and fully simulates the main diffractive components of the inelastic cross section: SD, DD and CD. The diffractive-event generation in \PYTHIA8 MBR is based on a phenomenological renormalized–Regge–theory model [10, 11], which is unitarized by interpreting the Pomeron flux as the probability for forming a diffractive rapidity gap. The model was originally developed for the CDF experiment at the Tevatron and has been successfully tested with the CDF results on diffraction. The \PYTHIA8 MBR simulation assumes a linear parametrization of the Pomeron trajectory, , where is the square of the four-momentum transfer between the two incident protons. We use , and [12, 13] or [14, 15], to account for the possible energy dependence of in the range of diffractive masses accessible in this analysis. We find that the simulation with gives a good description of the data. Scaling the DD cross section downwards by 15%, which preserves the agreement with the CDF data, further improves the description of the DD-dominated data at \TeV. These modifications are incorporated into the simulation used here. The measured cross sections are also compared to the predictions of \PYTHIA6 Z2* [16] and to MC generators based on Regge–Gribov phenomenology: phojet (version 1.12-35) [17, 18], qgsjet-ii (versions 03 and 04) [19, 20], and epos LHC [21]; the latter two are commonly used in cosmic-ray physics [22].
At the stable-particle level (where stable particles are those with lifetime such that \unitmm), the kinematic regions covered by the present measurements are defined by the masses and of the two final-state hadronic systems separated by the largest rapidity gap in the event. For a final-state particle of energy and longitudinal momentum , rapidity is defined as . At stable-particle level the gap is defined as the largest rapidity separation between stable particles, without any acceptance restriction. The final state is then separated into systems and , which populate the regions on the positive and negative side of the rapidity gap, respectively. The corresponding masses and are calculated from the full set of four-vectors in the respective group of stable particles. In the following Sections, and are given in units of \GeVns.
We use the pseudorapidity variable to select diffractive events at the detector level. At the stable-particle level, the true rapidity is used. For the pseudorapidity gap cross section, pseudorapidity (not true rapidity) is used at the hadron level to avoid unnecessary large bin migrations between the distributions measured at the detector and stable-particle levels. As the central CMS detector is insensitive to low-mass diffraction, we use the \PYTHIA8 MBR simulation, which describes the data well, to extrapolate the measured cross section into the low mass region.
The detailed MC simulation of the CMS detector response is based on \GEANTfour [23]. Simulated \PYTHIA8 4C and \PYTHIA8 MBR events are processed and reconstructed in the same manner as collision data.
0.4 Event selection
The present analysis is based on event samples collected during the 2010 commissioning period, when the LHC was operating at low pileup. For the results presented in Sections 0.5–0.9, only data with information from the CASTOR calorimeter are used, which correspond to an integrated luminosity of 16.2\mubinv, and have an average number of inelastic collisions per bunch crossing of . The results based on pseudorapidity-gap events presented in Section 0.10 are extracted from a different set of data taking runs with negligible pileup () that correspond to an integrated luminosity of 20.3\mubinv. Events were selected online by requiring a signal in both BPTX detectors, in conjunction with a signal in any of the BSC scintillators. These conditions correspond to requiring the presence of two crossing bunches along with activity in the main CMS detector (minimum bias trigger).
Offline selections [24] are applied to remove beam-scraping, beam-halo, and noise events. In addition, a minimal activity in the main CMS detectors is imposed offline by requiring at least two particle-flow (PF) objects reconstructed within the geometrical acceptance of the BSC detectors (, with an energy of at least 4\GeVfor each PF object). Particle-flow objects [25, 26] are particle candidates obtained by optimally combining the information from the tracking system and the calorimeters. In the forward regions (), where there is no tracking, PF objects reduce to calorimeter towers. Figure 2 shows the distributions of the energy of the PF objects reconstructed in different detector regions for different particle candidates, compared to the prediction of the \PYTHIA8 MBR simulation, which describes the data well. The requirement on the minimum energy of PF objects was found by studying data collected in dedicated runs with no beam; it depends on the detector region and the particle candidates, and varies from zero for tracks to 4\GeVfor the HF towers. To assure a reliable Monte Carlo description of the data, the two innermost (most forward) rings of HF are not used in the analysis, thus limiting the central CMS detector coverage to . The two outermost (most central) HF rings are also not used for the same reason. No vertex requirement is imposed. This procedure gives high acceptance for diffractive events with the hadronic system outside the tracking acceptance (i.e. with low to moderate diffractive masses, \GeV). According to the \PYTHIA8 MBR simulation, the selection described above accepts about 90% of the events corresponding to the total inelastic cross section in the region of or .
0.5 Diffractive event topologies

The events satisfying the selection described in Section 0.4 constitute a minimum bias sample dominated by inclusive inelastic events in the region covered by the central CMS detector (). They are mostly composed of nondiffractive (ND) events for which final-state particle production occurs in the entire space available, as shown schematically in Fig. 3a. In contrast, diffractive events are expected to have an LRG in the final state. Experimentally, the following diffractive topologies are defined, depending on the position of the reconstructed LRG in the central detector:
The experimental topology with a forward pseudorapidity gap on each edge of the detector (CD topology, Fig. 1d) is neglected in this analysis because of the limited number of such events. For the FG1 and FG2 topologies the pseudorapidity gap is related to the variables and (Fig. 3), defined as the highest (lowest) of the PF object reconstructed in the central detector. Experimentally, the pseudorapidity gap in CG events may be expressed as , where () is the closest-to-zero value of the PF objects reconstructed on the positive (negative) -side of the central detector (Fig. 3).
Figure 4 shows the distributions of , , and for the minimum bias sample defined in Section 0.4, compared to MC predictions. For the selection, the additional requirement that activity be present on both -sides of the central detector is imposed. The data are dominated by the contribution from ND events, for which rapidity gaps are exponentially suppressed [27]. Diffractive events appear as a flattening of the exponential distributions, and dominate the regions of low , high , and high . The absence of events around in Fig. 4a (4b) reflects the fact that the two outermost (most central) rings of HF are not used in the analysis; the depletion of events around corresponds to the transition region between the tracker and the forward calorimeters, where higher thresholds are applied for the latter. The regions of and in Fig. 4c correspond to the DD topology for which one or both of the and edges are in the HF calorimeters. In order to select samples of FG1, FG2, and CG events with a central LRG signature, the requirements , , and are imposed, respectively.
According to the expectations of the \PYTHIA8 MBR simulation, the event samples defined experimentally as FG1 or FG2 (Figs. 4a,b) originate from approximately equal numbers of SD events with and DD events for which one dissociated-proton mass is in this range, while the other is small and escapes detection in the central detector, cf. Figs. 3c,e. For the FG2 topology, CASTOR () is used to separate diffractive events into two samples: (SD enhanced) and (DD enhanced, Figs. 3d,e). The detection of the low-mass dissociated system, , is performed by using a CASTOR tag, defined as the presence of a signal above the energy threshold (1.48\GeV) in at least one of the 16 -sectors of the first five CASTOR modules. Since no detector is available for tagging the low-mass dissociated system on the positive -side, the FG1 sample is treated as a control sample in this analysis.
The range of the dissociation mass for the true SD process in the FG2-type sample after all detector selections is shown as a hatched histogram in Fig. 5 for \PYTHIA8 MBR (left) and \PYTHIA8 4C (right), and corresponds to . Similar distributions are obtained for events in the FG1-type sample, in which the dissociated system originates from the proton on the other side of the detector. The ranges of dissociation masses, and , for the true DD events in the minimum bias sample after the trigger selection, in the FG2-type sample with a CASTOR tag, and in the CG-type sample after all detector selections, are shown in the efficiency plots of Figs. 6a, 6b, and 6c, respectively. The FG2-type events, with the pseudorapidity gap reconstructed at the edge of the central detector, populate the region of and (solid box in Fig. 6b). The selection based on the CG topology requires both diffractive masses to be in the central detector; this leads to different coverage in the (, ) plane. Events populate the region of and (Fig. 6c), in addition to , thus providing a complementary measurement of the DD cross section.
0.6 Forward pseudorapidity gap cross sections from the FG2 event sample
The forward pseudorapidity gap cross sections are measured as a function of the variable , which is related to the mass of the dissociated system by:
| (1) |
For the FG2 sample, corresponds to the dissociated system that can be detected in the central detector (right-hand side of Figs. 3d,e). The CASTOR calorimeter allows the detection of the hadronic system when it escapes the central detector, and the separation of the FG2 sample into subsamples corresponding to and , which are dominated by SD and DD events, respectively. For the purely SD events, represents the fractional longitudinal momentum loss of the incoming proton.
At detector level, the variable is reconstructed as
| (2) |
where runs over all PF objects measured in the central detector, and and are the energy and the longitudinal momentum of the th PF object, respectively. The energy is related to the particle three-momentum assuming a mass that depends on the PF object type; \egfor charged hadrons a pion mass is assumed. The signs () in Eq. (2) indicate whether the dissociated system is on the side of the detector. For the FG2-type events under study, corresponds to .
Since part of the hadronic system X escapes the detector through the forward beam hole, and since low-energy particles remain undetected because of the PF object thresholds, the reconstructed values are underestimated. This can be seen in Fig. 7, which shows a scatter plot of reconstructed vs. generated values of for \PYTHIA8 MBR events in the FG2 sample. As decreases, its unmeasured fraction increases (the beam hole size is fixed), resulting in a larger deviation from the line. The calibration factor , which brings the reconstructed values of (Eq. (2)) to their true values (Eq. (1)) according to the formula , is evaluated from the \PYTHIA8 MBR simulation, by studying the difference in bins of . The factor decreases from the value of 1.1 at to 0.2 at , with an uncertainty of 9%, estimated by comparing the \PYTHIA8 MBR and \PYTHIA8 4C simulations.
Figure 8 presents the distribution of the calibrated for the FG2 sample, compared to the predictions of the \PYTHIA8 MBR (top) and \PYTHIA8 4C (bottom) simulations. Figure 8a shows the comparison for the entire FG2 sample. The separation of the SD and DD processes (hatched green and solid yellow histograms, respectively) by means of the CASTOR tag is clearly seen in Figs. 8b,c. Overall, the \PYTHIA8 MBR MC describes the data better than \PYTHIA8 4C and is therefore used to extract the diffractive cross sections. Both MC predictions are presented for a Pomeron trajectory with and describe the region of low well. At higher values, would be more appropriate [14], providing a better agreement with the data in that region. Since the dependence of is currently not available in the MC models used for this analysis, we extract cross sections using and evaluate a systematic uncertainty related to the possible variation of , as explained in Section 0.9.
The differential cross sections measured in bins of , separately for (no CASTOR tag) and (CASTOR tag), are calculated with the formula
| (3) |
where is the number of events in the bin, corrected for acceptance and migration effects, is the integrated luminosity, and is the bin width. The acceptance and migration corrections are evaluated with the iterative Bayesian unfolding technique [28], as implemented in the RooUnfold package [29], with four iterations. The number of iterations is optimized following the procedure suggested in Ref. [28], by studying the difference in (goodness-of-fit) values after consecutive iterations; the final unfolded distribution, folded back to the detector level, is consistent with the observed data. The response matrix is obtained with \PYTHIA8 MBR (). The results are presented in Table 0.6; they include a small correction for overlapping collisions (7%), evaluated by comparing MC simulations with and without pileup.
The differential forward pseudorapidity gap cross sections for (SD dominated, without CASTOR tag) and (DD dominated, with CASTOR tag). The first and the second errors correspond to statistical and systematic uncertainties, respectively.
{scotch}ccc
bin (mb) (mb)
Figures 9a,c present the measured cross sections compared to the \PYTHIA8 MBR, \PYTHIA8 4C, and \PYTHIA6 Z2* predictions. The error bars of the data points are dominated by systematic uncertainties, which are discussed in Section 0.11. The predictions of \PYTHIA8 MBR are shown for two values of the parameter of the Pomeron trajectory. Both values, and , describe the measured cross section for . The data for favor the smaller value of , specifically in the region of lower , corresponding to the topology in which both dissociation masses are low. The prediction of the Schuler-Sjöstrand model, used in the \PYTHIA8 4C simulation, describes well the measured cross section for , while the \PYTHIA6 Z2* simulation overestimates it. Both predictions are higher than the data for at high , and the predicted rising behavior of the cross section is not confirmed by the data in the region of the measurement, .
Figures 9b,d present a comparison of the measured cross sections with the phojet, qgsjet-ii 03, qgsjet-ii 04, and epos predictions. None of the models is able to describe the magnitude of the cross section in the region . For , the phojet and epos generators fail to describe the falling behavior of the data, qgsjet-ii 03 describes the measured cross section reasonably well, while qgsjet-ii 04 underestimates the magnitude of the cross section.
0.7 Central pseudorapidity gap cross section from the CG event sample
The cross section for events with a central pseudorapidity gap is measured as a function of the variable , defined as , where , with the proton mass. For purely DD events, the position of the gap center is related to the dissociation masses by the expression .
As discussed in Section 0.5, the central-gap width (Fig. 4c) is reconstructed as . The calibration factor , which corrects for detector effects according to the formula , is extracted from the \PYTHIA8 MBR MC as the difference . It amounts to , with the uncertainty estimated from a comparison with \PYTHIA8 4C. Figure 10 presents the distribution of the calibrated for the CG sample along with simulated distributions from \PYTHIA8 MBR and \PYTHIA8 4C.
The differential cross section, measured in bins of for , , and , is calculated according to the formula
| (4) |
where is the number of events in a given bin, corrected for acceptance and migration effects, and also for the extrapolation from (for gaps overlapping ) to for all gaps, is the integrated luminosity, and is the bin width. The acceptance and migration corrections are evaluated with the iterative Bayesian unfolding technique [28] with two iterations, optimized as described in Section 0.6. The response matrix is obtained using \PYTHIA8 MBR with .
The differential central pseudorapidity gap (DD dominated) cross section for , , and . The first and second errors correspond to statistical and systematic uncertainties, respectively.
{scotch}cc
bin (mb)
The measured differential cross section is presented in Table 0.7, and compared to predictions of theoretical models in Fig. 11. The results take into account the pileup correction, and the uncertainties are dominantly systematic (see Section 0.11). The prediction of the \PYTHIA8 MBR MC simulation with both and 0.104 describes well the central-gap data. \PYTHIA8 4C underestimates the data in all bins, while \PYTHIA6 Z2* overestimates the data in the lowest bin. The phojet, qgsjet-ii 03, qgsjet-ii 04, and epos generators underestimate the magnitude of the measured cross section.
0.8 Integrated cross sections
The forward and central pseudorapidity gap samples are also used to measure the integrated cross sections in the kinematic regions given in Sections 0.6 and 0.7. The forward pseudorapidity-gap cross sections, and , are measured in the region , for events without and with a CASTOR tag, corresponding to , and , respectively, while the central pseudorapidity-gap cross section, , is measured for , , and .
Each cross section is evaluated by means of the formula
| (5) |
where is the number of events in the kinematic regions given above, is the acceptance, defined as the ratio of the number of events reconstructed to the number of events generated in that bin, taking into account the pileup correction, and is the integrated luminosity. The acceptance is evaluated with the \PYTHIA8 MBR MC generator.
Values of , \unitmb, and \unitmb are obtained. Systematic uncertainties are evaluated as discussed in Section 0.11. As a consistency check of the analysis procedure, we measure the part of the total inelastic cross sections that is visible in the central CMS detector, corresponding to the region or . A value of \unitmb is found, in good agreement with the published CMS result \unitmb, measured in a slightly different kinematic region ( or \GeV) [30]. According to \PYTHIA8 MBR, the phase space difference between the two measurements corresponds to \unitmb.
Measured , , and cross sections, compared to predictions of MC models. The first and the second errors in the data correspond to statistical and systematic uncertainties, respectively.
{scotch}cccc
Cross section (mb) (mb) (mb)
SD dominated DD dominated DD dominated
Data
\PYTHIA8 MBR 3.05 1.24 0.54
\PYTHIA8 4C 3.31 1.10 0.40
\PYTHIA6 Z2* 3.86 1.52 0.78
phojet 3.06 0.63 0.32
qgsjet-ii 03 2.63 0.48 0.22
qgsjet-ii 04 1.70 0.78 0.37
epos 2.99 0.85 0.31
Table 0.8 lists the measured cross sections together with the absolute predictions of the MC simulations. Based on the results presented thus far, the following conclusions can be drawn about the models: phojet, qgsjet-ii 03, qgsjet-ii 04, and epos predict too few DD events, which dominate the measured and cross sections (Figs. 9d and 11b); among these four models only qgsjet-ii 03 satisfactorily predicts the cross section (Fig. 9b); \PYTHIA8 4C, \PYTHIA6 Z2*, phojet, and epos do not predict correctly the dependence for the SD process, which dominates the measured forward pseudorapidity gap cross section for (Fig. 9 a,b); and \PYTHIA8 MBR describes the data within uncertainties in all the measured regions.
0.9 The SD and DD cross sections
The cross section discussed above is dominated by SD events (Fig. 8b), whereas the and cross sections are mainly due to DD events (Figs. 8c and 10). As the contribution from ND and other diffractive processes to these cross sections is small, we use the event decomposition as defined in the \PYTHIA8 MBR simulation with to correct for them and extract the SD and DD cross sections.
The dominant background in the cross section originates from DD events; the CD contribution is minimal, while the ND contribution is negligible (Fig. 8b). The DD contribution is well understood via the CASTOR-tag events (Fig. 8c), and has an uncertainty of 10–20% due to the ND contamination. Since the DD events contribute about 20% to the no-CASTOR-tag sample, the uncertainty in the SD cross section due to the subtraction of the DD component amounts to only a few percent. The visible part of the total SD cross section, corresponding to , is found to be \unitmb. The result accounts for both and .
The dominant background to the and cross sections originates from ND events. The CD and SD contributions are negligible in the CASTOR-tag sample, while SD events contribute minimally to the central-gap sample (Figs. 8c and 10a). The total DD cross sections integrated over the regions
- •
and , and
- •
, and ,
are \unitmb, and \unitmb, respectively.
To provide the DD cross section in the widest kinematic region spanned by the data, we also evaluate the visible DD cross section, , defined as , where the factor of 2 assumes the same dependence of the DD cross section on and (boxed regions in Fig. 6b). This leads to , in the kinematic region delimited by the solid and dashed (red) lines in Figs. 6b,c. This result is used below to extrapolate the DD cross section to the region (to the left of the dashed (blue) line in Fig. 6c).
0.9.1 Extrapolation of the visible SD and DD cross sections
The measurements based on the central CMS detector are insensitive to the low-mass part of diffractive dissociation. Therefore, in order to compare the measured cross section with results of other experiments and theoretical models that present integrated cross sections for , an extrapolation from () to is required. Similarly, the cross section must be extrapolated to (Fig. 6). The extrapolation factors, calculated by using each of the MC simulations introduced in Section 0.3, are presented in Appendix A. Not all of the simulations are able to describe the measured cross sections (see Section 0.8), nor do they include realistic hadronization models (see Appendix B). Following the discussion in Section 0.8 and Appendix B, the extrapolation factors are determined with \PYTHIA8 MBR (with ), which describes well all aspects of our data. The multiplicative factor needed to extrapolate the measured SD cross section to is , and that for the extrapolation of the DD cross section to is (Tables .13 and .13 in Appendix A). The extrapolation uncertainties are estimated by changing the parameters and of the Pomeron trajectory from their nominal values () to those presented in Tables .13 and .13 (one parameter changed at a time), and adding in quadrature the corresponding deviations with respect to the central result, separately for the positive and negative deviations. The extrapolated SD and DD cross sections thus obtained are \unitmb and \unitmb, respectively.
Figure 12a presents the extrapolated SD cross section compared to the ALICE result [3] and a compilation of lower center-of-mass energy measurements [31, 32, 33, 34, 35]. The data are also compared to the \PYTHIA8 MBR simulation, as well as to the GLM [37] and KP [38, 39] models. The CMS result is consistent with a SD cross section weakly rising with energy.
Figure 12b shows the extrapolated DD cross section compared to the ALICE results [3], those by CDF at \GeVand \TeV [36], as well as the \PYTHIA8 MBR, GLM [37], and KP [38, 39] models. The CMS measurement at \TeVis in agreement with the ALICE measurement at the same energy. Note, however, that the ALICE result is obtained from the NSD (non-single-diffractive = DD+ND) data, while for the CMS measurement the ND background has been subtracted. Here as well, the data are consistent with a weakly rising cross section with energy, as predicted by the models.
0.9.2 Summary of results
Measured diffractive cross sections in regions of (or ), (or ), and (, where for DD). The method used for the cross section extraction is indicated as LRG for calculations involving all events selected in the LRG samples, and as MBR for calculations that involve background subtraction or extrapolation based on the prediction of the \PYTHIA8 MBR simulation. The first and the second errors in the data correspond to the statistical and systematic uncertainties, respectively. For and , the third errors correspond to the extrapolation uncertainties.
{scotch}lcccr
Cross section or range or range range Result (mb)
LRG
—
—
MBR
—
—
—
—
—
MBR
—
—
— —
Table 0.9.2 presents the summary of the cross section measurements illustrated in the previous sections, together with the kinematic region covered by each measurement. The method used for the cross section extraction (LRG or MBR) is given as well. The , , and cross sections are measured from all the events passing the LRG selection (Section 0.8). The , , and cross sections are extracted from the latter ones by subtracting the background contribution from other processes as predicted by the \PYTHIA8 MBR simulation (Section 0.9). In addition, is calculated from the combination of and . Finally, the and cross sections (Section 0.9.1) are calculated by extrapolating and to the region of lower diffractive masses using the mass dependence of the cross section predicted by \PYTHIA8 MBR.
0.10 Pseudorapidity gap cross section
This section presents the results of an alternative approach to the study of diffractive events, in which the data are analyzed in terms of the widest pseudorapidity gap adjacent to the edge of the detector [40]. In each event, particles are first ordered in , and the largest pseudorapidity gap, , is determined as , where are the detector edges in , and () is the highest (lowest) of the PF objects in the event (see Fig. 3).
The analysis is based on a minimum bias data sample, selected as described in Section 0.4, with negligible pileup (0.006), and corresponding to an integrated luminosity of 20.3\mubinv. The uncorrected distribution of the pseudorapidity gap size is shown in Fig. 13, along with the predictions of various MC models. A wider bin width is used at low to account for the lower spatial resolution in the forward region.
0.10.1 Corrections for experimental effects
Interactions of the beam protons with the residual gas particles in the beam pipe or inside the detector region affect the pseudorapidity gap distribution in data. The overall beam-induced background, integrated over the full measurement region, is about 0.7%. After the subtraction of this background, the differential cross section is determined according to the formula
| (6) |
where is the number of events in the bin, corrected for migration effects, the trigger efficiency, \lumi the integrated luminosity, and the bin width.
The trigger efficiency is obtained from a comparison with zero-bias data where no trigger requirements were applied. In order to have a satisfactory correlation between the generated and reconstructed values of , and hence a reliable correction for bin-migration effects, the cross section is evaluated for events with at least one stable final-state particle of transverse momentum \MeVin the region of . The migration corrections are evaluated with the iterative Bayesian unfolding technique [28], as implemented in the RooUnfold package [29], with a single iteration. The response matrix is obtained with \PYTHIA8 MBR (). The cross section is measured only for , so as to avoid regions where the trigger inefficiency and the unfolding uncertainty are large.
0.10.2 Corrected results
Figure 14 shows the unfolded and fully corrected differential cross section for events with at least one particle with \MeVin the region of . As the statistical uncertainty is negligible, only the systematic uncertainty, discussed in Section 0.11, is shown. The predictions from \PYTHIA8 MBR ( and ), \PYTHIA8 tune 4C, and \PYTHIA6 tune Z2∗ are also given. The MC predictions show that in the pseudorapidity range covered by the measurement, , a large fraction of nondiffractive events can be suppressed by means of the requirement.
The present results are consistent with those from the ATLAS collaboration [4], as shown in Fig. 15. The ATLAS measurement uses all stable final-state particles with \MeVover the region . According to the \PYTHIA8 MBR simulation, the difference in the coverage between the two experiments causes changes in the distribution of up to 5%.
0.11 Systematic uncertainties
Systematic uncertainties are obtained by varying the selection criteria and modifying the analysis. The following sources of systematic uncertainties are taken into account for the results presented in Sections 0.6–0.10:
- •
HF energy scale: varied in the MC simulations by 10%, to reflect the energy scale uncertainty estimated for data.
- •
PF energy thresholds: raised by 10%, based on dedicated studies of the detector noise.
- •
Modeling of the diffractive interaction and the hadronization process: the hadronization parameters in the nominal \PYTHIA8 MBR MC sample are tuned to describe the multiplicity and spectra of diffractive systems in and collisions at \GeV [41]. The corresponding uncertainty is estimated by taking the difference (see Appendix B) between the results obtained with \PYTHIA8 MBR and those obtained with \PYTHIA8 4C (Sections 0.6–0.9), or \PYTHIA8 4C and \PYTHIA6-Z2* (Section 0.10).
- •
- •
CASTOR energy scale [44]: changed in the simulation by , to reflect the estimated energy scale uncertainty for the data.
- •
CASTOR energy threshold in each sector [16]: changed from the nominal 4 to 3.5 and 5, where is the pedestal width.
- •
CASTOR alignment uncertainty [45]: the simulated CASTOR position in the plane transverse to the beamline is varied within the limits allowed by the condition that the MC description of the energy flow in CASTOR remains satisfactory. This corresponds to about 10 mm and 4 mm, for the left and right CASTOR sides, respectively.
- •
Trigger efficiency uncertainty: estimated from a comparison of efficiency curves between data (measured by using a control sample for which no trigger requirements were applied) and MC.
- •
Background subtraction: backgrounds from DD and ND events in the SD sample, and from ND and SD in the DD sample are estimated with \PYTHIA8 MBR (Figs. 8 and 10). The corresponding uncertainty is estimated by varying their relative contributions by (average normalization uncertainty of the model). The contribution from CD events in the SD and DD samples is negligible.
The total systematic uncertainty is obtained by summing all individual uncertainties in quadrature, separately for the positive and negative deviations from the nominal cross section values, leading to a total systematic uncertainty of up to 25%. Table 0.11 presents the summary of the systematic uncertainties for the measurement of the , , and cross sections. The systematic uncertainties are significantly larger than the statistical ones, and the dominant sources are the HF energy scale and the modeling of diffraction and hadronization. For the cross section, also the uncertainty related to the CASTOR alignment is significant.
Systematic uncertainties for the measurement of the , , and cross sections; individual contributions, as well as total systematic and statistical uncertainties are shown.
{scotch}lccc
Source Uncertainty (%)
HF energy scale 10 1.6 23
PF thresholds 0.8 0.4 6.9
Diff. and had. modeling 10 4.3 0.4
Luminosity 4 4 4
CASTOR energy scale 0.5 0.9 0
CASTOR threshold 0.9 2.8 0
CASTOR alignment 2.6 8.3 0
Trigger 0.6 0.6 0.7
Background sub. 4.3 0.4 1.3
Total systematic 16 11 25
Statistical 0.9 1.8 1.3
0.12 Summary
Measurements of diffractive dissociation cross sections in collisions at \TeVhave been presented in kinematic regions defined by the masses and of the two final-state hadronic systems separated by the largest rapidity gap in the event. Differential cross sections are measured as a function of in the region , for , dominated by single dissociation (SD), and , dominated by double dissociation (DD). The discrimination between the above two regions is performed by means of the CASTOR forward calorimeter. The cross sections integrated over these regions are \unitmb and \unitmb, respectively.
The inclusive cross section is also measured as a function of the width of the central pseudorapidity gap, , for , , and (dominated by DD contributions). The corresponding integrated cross section is \unitmb.
The SD and DD cross sections in the above three regions, extracted by means of the \PYTHIA8 MBR simulation, which provides a good description of the data, are \unitmb (accounting for both and ), \unitmb, and \unitmb, respectively.
Extrapolations of the SD and DD cross sections to the regions and , performed with \PYTHIA8 MBR, yield \unitmb and \unitmb, respectively.
In addition, the inclusive differential cross section for events with a pseudorapidity gap adjacent to the edge of the detector is measured over 8.4 units of pseudorapidity.
These measurements are compared to results from other experiments as well as to phenomenological predictions. The data are consistent with the SD and DD cross sections weakly rising with energy, and provide new experimental constraints on the modeling of diffraction in hadronic interactions.
Acknowledgements.
We congratulate our colleagues in the CERN accelerator departments for the excellent performance of the LHC and thank the technical and administrative staffs at CERN and at other CMS institutes for their contributions to the success of the CMS effort. In addition, we gratefully acknowledge the computing centers and personnel of the Worldwide LHC Computing Grid for delivering so effectively the computing infrastructure essential to our analyses. Finally, we acknowledge the enduring support for the construction and operation of the LHC and the CMS detector provided by the following funding agencies: the Austrian Federal Ministry of Science, Research and Economy and the Austrian Science Fund; the Belgian Fonds de la Recherche Scientifique, and Fonds voor Wetenschappelijk Onderzoek; the Brazilian Funding Agencies (CNPq, CAPES, FAPERJ, and FAPESP); the Bulgarian Ministry of Education and Science; CERN; the Chinese Academy of Sciences, Ministry of Science and Technology, and National Natural Science Foundation of China; the Colombian Funding Agency (COLCIENCIAS); the Croatian Ministry of Science, Education and Sport, and the Croatian Science Foundation; the Research Promotion Foundation, Cyprus; the Ministry of Education and Research, Estonian Research Council via IUT23-4 and IUT23-6 and European Regional Development Fund, Estonia; the Academy of Finland, Finnish Ministry of Education and Culture, and Helsinki Institute of Physics; the Institut National de Physique Nucléaire et de Physique des Particules / CNRS, and Commissariat à l’Énergie Atomique et aux Énergies Alternatives / CEA, France; the Bundesministerium für Bildung und Forschung, Deutsche Forschungsgemeinschaft, and Helmholtz-Gemeinschaft Deutscher Forschungszentren, Germany; the General Secretariat for Research and Technology, Greece; the National Scientific Research Foundation, and National Innovation Office, Hungary; the Department of Atomic Energy and the Department of Science and Technology, India; the Institute for Studies in Theoretical Physics and Mathematics, Iran; the Science Foundation, Ireland; the Istituto Nazionale di Fisica Nucleare, Italy; the Ministry of Science, ICT and Future Planning, and National Research Foundation (NRF), Republic of Korea; the Lithuanian Academy of Sciences; the Ministry of Education, and University of Malaya (Malaysia); the Mexican Funding Agencies (CINVESTAV, CONACYT, SEP, and UASLP-FAI); the Ministry of Business, Innovation and Employment, New Zealand; the Pakistan Atomic Energy Commission; the Ministry of Science and Higher Education and the National Science Centre, Poland; the Fundação para a Ciência e a Tecnologia, Portugal; JINR, Dubna; the Ministry of Education and Science of the Russian Federation, the Federal Agency of Atomic Energy of the Russian Federation, Russian Academy of Sciences, and the Russian Foundation for Basic Research; the Ministry of Education, Science and Technological Development of Serbia; the Secretaría de Estado de Investigación, Desarrollo e Innovación and Programa Consolider-Ingenio 2010, Spain; the Swiss Funding Agencies (ETH Board, ETH Zurich, PSI, SNF, UniZH, Canton Zurich, and SER); the Ministry of Science and Technology, Taipei; the Thailand Center of Excellence in Physics, the Institute for the Promotion of Teaching Science and Technology of Thailand, Special Task Force for Activating Research and the National Science and Technology Development Agency of Thailand; the Scientific and Technical Research Council of Turkey, and Turkish Atomic Energy Authority; the National Academy of Sciences of Ukraine, and State Fund for Fundamental Researches, Ukraine; the Science and Technology Facilities Council, UK; the US Department of Energy, and the US National Science Foundation. Individuals have received support from the Marie-Curie program and the European Research Council and EPLANET (European Union); the Leventis Foundation; the A. P. Sloan Foundation; the Alexander von Humboldt Foundation; the Belgian Federal Science Policy Office; the Fonds pour la Formation à la Recherche dans l’Industrie et dans l’Agriculture (FRIA-Belgium); the Agentschap voor Innovatie door Wetenschap en Technologie (IWT-Belgium); the Ministry of Education, Youth and Sports (MEYS) of the Czech Republic; the Council of Science and Industrial Research, India; the HOMING PLUS program of the Foundation for Polish Science, cofinanced from European Union, Regional Development Fund; the Compagnia di San Paolo (Torino); the Consorzio per la Fisica (Trieste); MIUR project 20108T4XTM (Italy); the Thalis and Aristeia programs cofinanced by EU-ESF and the Greek NSRF; and the National Priorities Research Program by Qatar National Research Fund.References
- [1] S. Donnachie, H. G. Dosch, O. Nachtmann, and P. Landshoff, “Pomeron physics and QCD”. Cambridge University Press, 2002. Camb. Monogr. Part. Phys. Nucl. Phys. Cosmol. (No. 19).
- [2] TOTEM Collaboration, “Double diffractive cross-section measurement in the forward region at LHC”, Phys. Rev. Lett. 111 (2013) 262001, 10.1103/PhysRevLett.111.262001, arXiv:1308.6722.
- [3] ALICE Collaboration, “Measurement of inelastic, single- and double-diffraction cross sections in proton–proton collisions at the LHC with ALICE”, Eur. Phys. J. C 73 (2013) 2456, 10.1140/epjc/s10052-013-2456-0, arXiv:1208.4968.
- [4] ATLAS Collaboration, “Rapidity gap cross sections measured with the ATLAS detector in pp collisions at TeV”, Eur. Phys. J. C 72 (2012) 1926, 10.1140/epjc/s10052-012-1926-0, arXiv:1201.2808.
- [5] V. Andreev et al., “Performance studies of a full-length prototype for the CASTOR forward calorimeter at the CMS experiment”, Eur. Phys. J. C 67 (2010) 601, 10.1140/epjc/s10052-010-1316-4.
- [6] CMS Collaboration, “The CMS experiment at the CERN LHC”, JINST 3 (2008) S08004, 10.1088/1748-0221/3/08/S08004.
- [7] T. Sjöstrand, S. Mrenna, and P. Skands, “PYTHIA 6.4 physics and manual”, JHEP 05 (2006) 026, 10.1088/1126-6708/2006/05/026, arXiv:hep-ph/0603175.
- [8] T. Sjöstrand, S. Mrenna, and P. Skands, “A brief introduction to PYTHIA 8.1”, Comput. Phys. Commun. 178 (2008) 852, 10.1016/j.cpc.2008.01.036, arXiv:0710.3820.
- [9] R. Ciesielski and K. Goulianos, “MBR Monte Carlo Simulation in PYTHIA8”, in 36th Int. Conf. on High Energy Physics (ICHEP2012), A. Limosani, ed., p. 301. 2013. arXiv:1205.1446. [PoS(ICHEP2012)301].
- [10] K. Goulianos, “Hadronic diffraction: Where do we stand?”, in Results and perspectives in particle physics: 18th Rencontres de Physique de la Vallée d’Aoste, M. Greco, ed., p. 251. 2004. arXiv:hep-ph/0407035.
- [11] K. Goulianos, “Diffraction in QCD”, (2002). arXiv:hep-ph/0203141.
- [12] A. Donnachie and P. Landshoff, “Elastic scattering and diffraction dissociation”, Nucl. Phys. B 244 (1984) 322, 10.1016/0550-3213(84)90315-8.
- [13] A. Donnachie and P. Landshoff, “Total cross-sections”, Phys. Lett. B 296 (1992) 227, 10.1016/0370-2693(92)90832-O.
- [14] R. J. M. Covolan, J. Montanha, and K. Goulianos, “A new determination of the soft pomeron intercept”, Phys. Lett. B 389 (1996) 176, 10.1016/S0370-2693(96)01362-7.
- [15] K. Goulianos, “Pomeron intercept and slope: A QCD connection”, Phys. Rev. D 80 (2009) 111901, 10.1103/PhysRevD.80.111901.
- [16] CMS Collaboration, “Study of the underlying event at forward rapidity in pp collisions at = 0.9, 2.76, and 7 TeV”, JHEP 04 (2013) 072, 10.1007/JHEP04(2013)072, arXiv:1302.2394.
- [17] F. W. Bopp, R. Engel, and J. Ranft, “Rapidity gaps and the PHOJET Monte Carlo”, (1998). arXiv:hep-ph/9803437.
- [18] R. Engel, “Photoproduction within the two-component Dual Parton Model: Amplitudes and cross-sections”, Z. Phys. C 66 (1995) 203, 10.1007/BF01496594.
- [19] S. Ostapchenko, “QGSJET-II: Towards reliable description of very high energy hadronic interactions”, Nucl. Phys. B Proc. Suppl. 151 (2006) 143, 10.1016/j.nuclphysbps.2005.07.026, arXiv:hep-ph/0412332.
- [20] S. Ostapchenko, “Monte Carlo treatment of hadronic interactions in enhanced Pomeron scheme: I. QGSJET-II model”, Phys. Rev. D 83 (2011) 014018, 10.1103/PhysRevD.83.014018, arXiv:1010.1869.
- [21] K. Werner, F.-M. Liu, and T. Pierog, “Parton ladder splitting and the rapidity dependence of transverse momentum spectra in deuteron-gold collisions at RHIC”, Phys. Rev. C 74 (2006) 044902, 10.1103/PhysRevC.74.044902, arXiv:hep-ph/0506232.
- [22] D. d’Enterria et al., “Constraints from the first LHC data on hadronic event generators for ultra-high energy cosmic-ray physics”, Astropart. Phys. 35 (2011) 98, 10.1016/j.astropartphys.2011.05.002, arXiv:1101.5596.
- [23] GEANT4 Collaboration, “GEANT4—a simulation toolkit”, Nucl. Instrum. Meth. A 506 (2003) 250, 10.1016/S0168-9002(03)01368-8.
- [24] CMS Collaboration, “Transverse momentum and pseudorapidity distributions of charged hadrons in pp collisions at = 0.9 and 2.36 TeV”, JHEP 02 (2010) 041, 10.1007/JHEP02(2010)041, arXiv:1002.0621.
- [25] CMS Collaboration, “Particle-Flow Event Reconstruction in CMS and Performance for Jets, Taus, and Missing ”, CMS Physics Analysis Summary CMS-PAS-PFT-09-001, 2009.
- [26] CMS Collaboration, “Commissioning of the Particle-flow Event Reconstruction with the first LHC collisions recorded in the CMS detector”, CMS Physics Analysis Summary CMS-PAS-PFT-10-001, 2010.
- [27] J. D. Bjorken, “Rapidity gaps and jets as a new-physics signature in very-high-energy hadron-hadron collisions”, Phys. Rev. D 47 (1993) 101, 10.1103/PhysRevD.47.101.
- [28] G. D’Agostini, “A multidimensional unfolding method based on Bayes’ theorem”, Nucl. Instrum. Meth. A 362 (1995) 487, 10.1016/0168-9002(95)00274-X.
- [29] T. Adye, “Unfolding algorithms and tests using RooUnfold”, in PHYSTAT 2011 Workshop on Statistical Issues Related to Discovery Claims in Search Experiments and Unfolding, H. Prosper and L. Lyons, eds., p. 313. Geneva, Switzerland, 2011. arXiv:1105.1160. 10.5170/CERN-2011-006.313.
- [30] CMS Collaboration, “Measurement of the inelastic proton-proton cross section at TeV”, Phys. Lett. B 722 (2013) 5, 10.1016/j.physletb.2013.03.024, arXiv:1210.6718.
- [31] CDF Collaboration, “Measurement of single diffraction dissociation at GeV and 1800 GeV”, Phys. Rev. D 50 (1994) 5535, 10.1103/PhysRevD.50.5535.
- [32] E710 Collaboration, “Diffraction dissociation in collisions at = 1.8-TeV”, Phys. Lett. B 301 (1993) 313, 10.1016/0370-2693(93)90707-O.
- [33] UA4 Collaboration, “The cross section of diffraction dissociation at the CERN SPS collider”, Phys. Lett. B 186 (1987) 227, 10.1016/0370-2693(87)90285-1.
- [34] CHLM Collaboration, “Inelastic diffractive scattering at the CERN ISR”, Nucl. Phys. B 108 (1976) 1, 10.1016/0550-3213(76)90121-8.
- [35] J. C. M. Armitage et al., “Diffraction dissociation in proton-proton collisions at ISR energies”, Nucl. Phys. B 194 (1982) 365, 10.1016/0550-3213(82)90014-1.
- [36] CDF Collaboration, “Double diffraction dissociation at the Fermilab Tevatron collider”, Phys. Rev. Lett. 87 (2001) 141802, 10.1103/PhysRevLett.87.141802, arXiv:hep-ex/0107070.
- [37] E. Gotsman, E. Levin, and U. Maor, “Description of LHC data in a soft interaction model”, Phys. Lett. B 716 (2012) 425, 10.1016/j.physletb.2012.08.042, arXiv:1208.0898.
- [38] A. B. Kaidalov and M. G. Poghosyan, “Predictions of the Quark-Gluon String Model for pp at LHC”, Eur. Phys. J. C 67 (2010) 397, 10.1140/epjc/s10052-010-1301-y, arXiv:0910.2050.
- [39] A. B. Kaidalov and M. G. Poghosyan, “Predictions for proton-proton interaction cross-sections at LHC”, (2011). arXiv:1109.3697.
- [40] E. Nurse and S. Sen, “Methods to Select Soft Diffraction Dissociation at the LHC”, (2011). arXiv:1107.2688.
- [41] K. Goulianos, “A new statistical description of hadronic and e+e- multiplicity distributions”, Phys. Lett. B 193 (1987) 151, 10.1016/0370-2693(87)90474-6.
- [42] CMS Collaboration, “Measurement of CMS Luminosity”, CMS Physics Analysis Summary CMS-PAS-EWK-10-004, 2010.
- [43] CMS Collaboration, “Absolute luminosity normalization”, CMS Detector Performance Note CMS-DP-2011-002, 2011.
- [44] CMS Collaboration, “CASTOR very forward calorimeter performance in 2013 data in pPb and pp collisions”, CMS Detector Performance Note CMS-DP-2013-035, 2013.
- [45] CMS and TOTEM Collaboration, “Alignment of CASTOR with 2013 pA TOTEM-Data”, CMS Detector Performance Note CMS-DP-2014-014, 2014.
- [46] UA1 Collaboration, “Transverse momentum spectra for charged particles at the CERN proton-antiproton collider”, Phys. Lett. B 118 (1982) 167, 10.1016/0370-2693(82)90623-2.
.13 SD/DD extrapolation factors
Figure 16 shows the dependence of the SD cross section for the \PYTHIA8 4C, \PYTHIA6 Z2*, phojet, qgsjet-ii 03, qgsjet-ii 04, and epos simulations, compared to the nominal \PYTHIA8 MBR simulation used in this analysis for two regions of , (dashed yellow) and (solid khaki). In addition, the \PYTHIA8 MBR simulations with values of and changed to , , and (one parameter changed at a time) are also included to provide a scale for their effect on the cross sections. Extrapolation factors, defined as the ratios of to , are presented for each of the above ten MC models in Table .13. For each model, two ratios are evaluated, one in which both cross sections (numerator and denominator of the extrapolation factor) are calculated by using the same generator (), and another where the prediction of the is calculated by using the nominal \PYTHIA8 MBR with (). The numbers in brackets in Table .13 show the relative change of the extrapolation factors with respect to the nominal \PYTHIA8 MBR simulation; the one related to is sensitive to the difference in the shape of the (mass) distribution, while the one related to is also sensitive to the the normalization of the SD cross section.
Table .13 shows the extrapolation factors for the DD case, defined as the ratios of to , again for two cases: one when both cross sections are calculated with the same MC generator (), and the other when the predicted cross section is from \PYTHIA8 MBR with (). The relative change of the extrapolation factors with respect to the nominal \PYTHIA8 MBR simulation is shown in brackets; the one related to accounts for the difference in the shape of the and dependence, while the one related to is sensitive to the difference in the mass dependence and the normalization of the DD cross section.
Extrapolation factors and from the visible to total SD () cross section for each MC model considered (). The relative change with respect to the value obtained by \PYTHIA8 MBR with is shown in parenthesis.
{scotch}cccccc
MC model
1 \PYTHIA8 MBR () 2.18 (1.00) 2.18 (1.00)
2 \PYTHIA8 4C 2.32 (1.06) 2.51 (1.15)
3 \PYTHIA6 Z2* 2.29 (1.06) 2.89 (1.34)
4 phojet 2.06 (0.95) 2.18 (1.00)
5 qgsjet-ii 03 2.72 (1.25) 3.19 (1.46)
6 qgsjet-ii 04 3.62 (1.66) 2.30 (1.06)
7 epos 3.44 (1.58) 2.15 (0.99)
8 \PYTHIA8 MBR () 2.27 (1.04) 2.34 (1.07)
9 \PYTHIA8 MBR () 2.23 (1.03) 2.42 (1.11)
10 \PYTHIA8 MBR () 2.16 (0.99) 2.09 (0.96)
Extrapolation factors and from the visible to total DD () cross section for each MC model considered (). The relative change with respect to the value obtained by \PYTHIA8 MBR with is shown in parenthesis.
{scotch}cccccc
MC model
1 \PYTHIA8 MBR () 1.92 (1.00) 1.92 (1.00)
2 \PYTHIA8 4C 2.52 (1.32) 1.86 (0.97)
3 \PYTHIA6 Z2* 2.39 (1.25) 2.15 (1.13)
4 phojet 1.80 (0.94) 0.60 (0.31)
5 qgsjet-ii 03 — —
6 qgsjet-ii 04 2.04 (1.07) 0.94 (0.49)
7 epos 4.73 (2.47) 1.93 (1.01)
8 \PYTHIA8 MBR () 1.97 (1.03) 2.32 (1.21)
9 \PYTHIA8 MBR () 2.00 (1.04) 2.37 (1.24)
10 \PYTHIA8 MBR () 1.88 (0.98) 1.73 (0.90)
.14 MC hadronization models
In this section, the hadronization models used to generate particle spectra in the simulations introduced in Section 0.3 are compared to a reference model [41, 46] based on data. The model correctly describes the charged-particle multiplicity and spectra of diffractive and inclusive proton-(anti)proton data for \GeVby assuming that the Pomeron-proton collision produces a system of mass that hadronizes as if it had been produced in a nondiffractive proton-proton collision at . Figures 17 and 18 show the charged-particle multiplicity distributions and spectra for the SD process for three ranges of : \GeV, \GeV, and \GeV, for the \PYTHIA8 MBR, \PYTHIA8 4C, \PYTHIA6 Z2*, phojet, qgsjet-ii 03, qgsjet-ii 04, and epos simulations, compared to the reference model quoted above. The following conclusions can be drawn: \PYTHIA6 Z2*, qgsjet-ii 03, qgsjet-ii 04, and epos predict smaller multiplicities and harder spectra than the model of Ref. [41, 46]; \PYTHIA8 4C agrees with the mean values of the multiplicity distributions, but predicts narrower widths, and harder spectra; phojet predicts multiplicity distributions consistent with the reference model with harder spectra; and \PYTHIA8 MBR agrees with the reference model in both multiplicity and spectra. The latter is an expected result, as the hadronization parameters of the \PYTHIA8 MBR simulation have been tuned to follow the reference model.
.15 The CMS Collaboration
Yerevan Physics Institute, Yerevan, Armenia
V. Khachatryan, A.M. Sirunyan, A. Tumasyan
Institut für Hochenergiephysik der OeAW, Wien, Austria
W. Adam, T. Bergauer, M. Dragicevic, J. Erö, C. Fabjan\cmsAuthorMark1, M. Friedl, R. Frühwirth\cmsAuthorMark1, V.M. Ghete, C. Hartl, N. Hörmann, J. Hrubec, M. Jeitler\cmsAuthorMark1, W. Kiesenhofer, V. Knünz, M. Krammer\cmsAuthorMark1, I. Krätschmer, D. Liko, I. Mikulec, D. Rabady\cmsAuthorMark2, B. Rahbaran, H. Rohringer, R. Schöfbeck, J. Strauss, A. Taurok, W. Treberer-Treberspurg, W. Waltenberger, C.-E. Wulz\cmsAuthorMark1
National Centre for Particle and High Energy Physics, Minsk, Belarus
V. Mossolov, N. Shumeiko, J. Suarez Gonzalez
Universiteit Antwerpen, Antwerpen, Belgium
S. Alderweireldt, M. Bansal, S. Bansal, T. Cornelis, E.A. De Wolf, X. Janssen, A. Knutsson, S. Luyckx, S. Ochesanu, R. Rougny, M. Van De Klundert, H. Van Haevermaet, P. Van Mechelen, N. Van Remortel, A. Van Spilbeeck
Vrije Universiteit Brussel, Brussel, Belgium
F. Blekman, S. Blyweert, J. D’Hondt, N. Daci, N. Heracleous, J. Keaveney, S. Lowette, M. Maes, A. Olbrechts, Q. Python, D. Strom, S. Tavernier, W. Van Doninck, P. Van Mulders, G.P. Van Onsem, I. Villella
Université Libre de Bruxelles, Bruxelles, Belgium
C. Caillol, B. Clerbaux, G. De Lentdecker, D. Dobur, L. Favart, A.P.R. Gay, A. Grebenyuk, A. Léonard, A. Mohammadi, L. Perniè\cmsAuthorMark2, T. Reis, T. Seva, L. Thomas, C. Vander Velde, P. Vanlaer, J. Wang, F. Zenoni
Ghent University, Ghent, Belgium
V. Adler, K. Beernaert, L. Benucci, A. Cimmino, S. Costantini, S. Crucy, S. Dildick, A. Fagot, G. Garcia, J. Mccartin, A.A. Ocampo Rios, D. Ryckbosch, S. Salva Diblen, M. Sigamani, N. Strobbe, F. Thyssen, M. Tytgat, E. Yazgan, N. Zaganidis
Université Catholique de Louvain, Louvain-la-Neuve, Belgium
S. Basegmez, C. Beluffi\cmsAuthorMark3, G. Bruno, R. Castello, A. Caudron, L. Ceard, G.G. Da Silveira, C. Delaere, T. du Pree, D. Favart, L. Forthomme, A. Giammanco\cmsAuthorMark4, J. Hollar, A. Jafari, P. Jez, M. Komm, V. Lemaitre, C. Nuttens, D. Pagano, L. Perrini, A. Pin, K. Piotrzkowski, A. Popov\cmsAuthorMark5, L. Quertenmont, M. Selvaggi, M. Vidal Marono, J.M. Vizan Garcia
Université de Mons, Mons, Belgium
N. Beliy, T. Caebergs, E. Daubie, G.H. Hammad
Centro Brasileiro de Pesquisas Fisicas, Rio de Janeiro, Brazil
W.L. Aldá Júnior, G.A. Alves, L. Brito, M. Correa Martins Junior, T. Dos Reis Martins, C. Mora Herrera, M.E. Pol
Universidade do Estado do Rio de Janeiro, Rio de Janeiro, Brazil
W. Carvalho, J. Chinellato\cmsAuthorMark6, A. Custódio, E.M. Da Costa, D. De Jesus Damiao, C. De Oliveira Martins, S. Fonseca De Souza, H. Malbouisson, D. Matos Figueiredo, L. Mundim, H. Nogima, W.L. Prado Da Silva, J. Santaolalla, A. Santoro, A. Sznajder, E.J. Tonelli Manganote\cmsAuthorMark6, A. Vilela Pereira
Universidade Estadual Paulista a, Universidade Federal do ABC b, São Paulo, Brazil
C.A. Bernardesb, S. Dograa, T.R. Fernandez Perez Tomeia, E.M. Gregoresb, P.G. Mercadanteb, S.F. Novaesa, Sandra S. Padulaa
Institute for Nuclear Research and Nuclear Energy, Sofia, Bulgaria
A. Aleksandrov, V. Genchev\cmsAuthorMark2, P. Iaydjiev, A. Marinov, S. Piperov, M. Rodozov, S. Stoykova, G. Sultanov, V. Tcholakov, M. Vutova
University of Sofia, Sofia, Bulgaria
A. Dimitrov, I. Glushkov, R. Hadjiiska, V. Kozhuharov, L. Litov, B. Pavlov, P. Petkov
Institute of High Energy Physics, Beijing, China
J.G. Bian, G.M. Chen, H.S. Chen, M. Chen, R. Du, C.H. Jiang, R. Plestina\cmsAuthorMark7, J. Tao, Z. Wang
State Key Laboratory of Nuclear Physics and Technology, Peking University, Beijing, China
C. Asawatangtrakuldee, Y. Ban, Q. Li, S. Liu, Y. Mao, S.J. Qian, D. Wang, W. Zou
Universidad de Los Andes, Bogota, Colombia
C. Avila, L.F. Chaparro Sierra, C. Florez, J.P. Gomez, B. Gomez Moreno, J.C. Sanabria
University of Split, Faculty of Electrical Engineering, Mechanical Engineering and Naval Architecture, Split, Croatia
N. Godinovic, D. Lelas, D. Polic, I. Puljak
University of Split, Faculty of Science, Split, Croatia
Z. Antunovic, M. Kovac
Institute Rudjer Boskovic, Zagreb, Croatia
V. Brigljevic, K. Kadija, J. Luetic, D. Mekterovic, L. Sudic
University of Cyprus, Nicosia, Cyprus
A. Attikis, G. Mavromanolakis, J. Mousa, C. Nicolaou, F. Ptochos, P.A. Razis
Charles University, Prague, Czech Republic
M. Bodlak, M. Finger, M. Finger Jr.\cmsAuthorMark8
Academy of Scientific Research and Technology of the Arab Republic of Egypt, Egyptian Network of High Energy Physics, Cairo, Egypt
Y. Assran\cmsAuthorMark9, A. Ellithi Kamel\cmsAuthorMark10, M.A. Mahmoud\cmsAuthorMark11, A. Radi\cmsAuthorMark12,\cmsAuthorMark13
National Institute of Chemical Physics and Biophysics, Tallinn, Estonia
M. Kadastik, M. Murumaa, M. Raidal, A. Tiko
Department of Physics, University of Helsinki, Helsinki, Finland
P. Eerola, G. Fedi, M. Voutilainen
Helsinki Institute of Physics, Helsinki, Finland
J. Härkönen, V. Karimäki, R. Kinnunen, M.J. Kortelainen, T. Lampén, K. Lassila-Perini, S. Lehti, T. Lindén, P. Luukka, T. Mäenpää, T. Peltola, E. Tuominen, J. Tuominiemi, E. Tuovinen, L. Wendland
Lappeenranta University of Technology, Lappeenranta, Finland
J. Talvitie, T. Tuuva
DSM/IRFU, CEA/Saclay, Gif-sur-Yvette, France
M. Besancon, F. Couderc, M. Dejardin, D. Denegri, B. Fabbro, J.L. Faure, C. Favaro, F. Ferri, S. Ganjour, A. Givernaud, P. Gras, G. Hamel de Monchenault, P. Jarry, E. Locci, J. Malcles, J. Rander, A. Rosowsky, M. Titov
Laboratoire Leprince-Ringuet, Ecole Polytechnique, IN2P3-CNRS, Palaiseau, France
S. Baffioni, F. Beaudette, P. Busson, C. Charlot, T. Dahms, M. Dalchenko, L. Dobrzynski, N. Filipovic, A. Florent, R. Granier de Cassagnac, L. Mastrolorenzo, P. Miné, C. Mironov, I.N. Naranjo, M. Nguyen, C. Ochando, P. Paganini, S. Regnard, R. Salerno, J.B. Sauvan, Y. Sirois, C. Veelken, Y. Yilmaz, A. Zabi
Institut Pluridisciplinaire Hubert Curien, Université de Strasbourg, Université de Haute Alsace Mulhouse, CNRS/IN2P3, Strasbourg, France
J.-L. Agram\cmsAuthorMark14, J. Andrea, A. Aubin, D. Bloch, J.-M. Brom, E.C. Chabert, C. Collard, E. Conte\cmsAuthorMark14, J.-C. Fontaine\cmsAuthorMark14, D. Gelé, U. Goerlach, C. Goetzmann, A.-C. Le Bihan, P. Van Hove
Centre de Calcul de l’Institut National de Physique Nucleaire et de Physique des Particules, CNRS/IN2P3, Villeurbanne, France
S. Gadrat
Université de Lyon, Université Claude Bernard Lyon 1, CNRS-IN2P3, Institut de Physique Nucléaire de Lyon, Villeurbanne, France
S. Beauceron, N. Beaupere, G. Boudoul\cmsAuthorMark2, E. Bouvier, S. Brochet, C.A. Carrillo Montoya, J. Chasserat, R. Chierici, D. Contardo\cmsAuthorMark2, P. Depasse, H. El Mamouni, J. Fan, J. Fay, S. Gascon, M. Gouzevitch, B. Ille, T. Kurca, M. Lethuillier, L. Mirabito, S. Perries, J.D. Ruiz Alvarez, D. Sabes, L. Sgandurra, V. Sordini, M. Vander Donckt, P. Verdier, S. Viret, H. Xiao
Institute of High Energy Physics and Informatization, Tbilisi State University, Tbilisi, Georgia
Z. Tsamalaidze\cmsAuthorMark8
RWTH Aachen University, I. Physikalisches Institut, Aachen, Germany
C. Autermann, S. Beranek, M. Bontenackels, M. Edelhoff, L. Feld, O. Hindrichs, K. Klein, A. Ostapchuk, A. Perieanu, F. Raupach, J. Sammet, S. Schael, H. Weber, B. Wittmer, V. Zhukov\cmsAuthorMark5
RWTH Aachen University, III. Physikalisches Institut A, Aachen, Germany
M. Ata, M. Brodski, E. Dietz-Laursonn, D. Duchardt, M. Erdmann, R. Fischer, A. Güth, T. Hebbeker, C. Heidemann, K. Hoepfner, D. Klingebiel, S. Knutzen, P. Kreuzer, M. Merschmeyer, A. Meyer, P. Millet, M. Olschewski, K. Padeken, P. Papacz, H. Reithler, S.A. Schmitz, L. Sonnenschein, D. Teyssier, S. Thüer, M. Weber
RWTH Aachen University, III. Physikalisches Institut B, Aachen, Germany
V. Cherepanov, Y. Erdogan, G. Flügge, H. Geenen, M. Geisler, W. Haj Ahmad, A. Heister, F. Hoehle, B. Kargoll, T. Kress, Y. Kuessel, A. Künsken, J. Lingemann\cmsAuthorMark2, A. Nowack, I.M. Nugent, L. Perchalla, O. Pooth, A. Stahl
Deutsches Elektronen-Synchrotron, Hamburg, Germany
I. Asin, N. Bartosik, J. Behr, W. Behrenhoff, U. Behrens, A.J. Bell, M. Bergholz\cmsAuthorMark15, A. Bethani, K. Borras, A. Burgmeier, A. Cakir, L. Calligaris, A. Campbell, S. Choudhury, F. Costanza, C. Diez Pardos, S. Dooling, T. Dorland, G. Eckerlin, D. Eckstein, T. Eichhorn, G. Flucke, J. Garay Garcia, A. Geiser, P. Gunnellini, J. Hauk, M. Hempel\cmsAuthorMark15, D. Horton, H. Jung, A. Kalogeropoulos, M. Kasemann, P. Katsas, J. Kieseler, C. Kleinwort, D. Krücker, W. Lange, J. Leonard, K. Lipka, A. Lobanov, W. Lohmann\cmsAuthorMark15, B. Lutz, R. Mankel, I. Marfin\cmsAuthorMark15, I.-A. Melzer-Pellmann, A.B. Meyer, G. Mittag, J. Mnich, A. Mussgiller, S. Naumann-Emme, A. Nayak, O. Novgorodova, E. Ntomari, H. Perrey, D. Pitzl, R. Placakyte, A. Raspereza, P.M. Ribeiro Cipriano, B. Roland, E. Ron, M.Ö. Sahin, J. Salfeld-Nebgen, P. Saxena, R. Schmidt\cmsAuthorMark15, T. Schoerner-Sadenius, M. Schröder, C. Seitz, S. Spannagel, A.D.R. Vargas Trevino, R. Walsh, C. Wissing
University of Hamburg, Hamburg, Germany
M. Aldaya Martin, V. Blobel, M. Centis Vignali, A.R. Draeger, J. Erfle, E. Garutti, K. Goebel, M. Görner, J. Haller, M. Hoffmann, R.S. Höing, H. Kirschenmann, R. Klanner, R. Kogler, J. Lange, T. Lapsien, T. Lenz, I. Marchesini, J. Ott, T. Peiffer, N. Pietsch, J. Poehlsen, T. Poehlsen, D. Rathjens, C. Sander, H. Schettler, P. Schleper, E. Schlieckau, A. Schmidt, M. Seidel, V. Sola, H. Stadie, G. Steinbrück, D. Troendle, E. Usai, L. Vanelderen, A. Vanhoefer
Institut für Experimentelle Kernphysik, Karlsruhe, Germany
C. Barth, C. Baus, J. Berger, C. Böser, E. Butz, T. Chwalek, W. De Boer, A. Descroix, A. Dierlamm, M. Feindt, F. Frensch, M. Giffels, F. Hartmann\cmsAuthorMark2, T. Hauth\cmsAuthorMark2, U. Husemann, I. Katkov\cmsAuthorMark5, A. Kornmayer\cmsAuthorMark2, E. Kuznetsova, P. Lobelle Pardo, M.U. Mozer, Th. Müller, A. Nürnberg, G. Quast, K. Rabbertz, F. Ratnikov, S. Röcker, H.J. Simonis, F.M. Stober, R. Ulrich, J. Wagner-Kuhr, S. Wayand, T. Weiler, R. Wolf
Institute of Nuclear and Particle Physics (INPP), NCSR Demokritos, Aghia Paraskevi, Greece
G. Anagnostou, G. Daskalakis, T. Geralis, V.A. Giakoumopoulou, A. Kyriakis, D. Loukas, A. Markou, C. Markou, A. Psallidas, I. Topsis-Giotis
University of Athens, Athens, Greece
A. Agapitos, S. Kesisoglou, A. Panagiotou, N. Saoulidou, E. Stiliaris
University of Ioánnina, Ioánnina, Greece
X. Aslanoglou, I. Evangelou, G. Flouris, C. Foudas, P. Kokkas, N. Manthos, I. Papadopoulos, E. Paradas
Wigner Research Centre for Physics, Budapest, Hungary
G. Bencze, C. Hajdu, P. Hidas, D. Horvath\cmsAuthorMark16, F. Sikler, V. Veszpremi, G. Vesztergombi\cmsAuthorMark17, A.J. Zsigmond
Institute of Nuclear Research ATOMKI, Debrecen, Hungary
N. Beni, S. Czellar, J. Karancsi\cmsAuthorMark18, J. Molnar, J. Palinkas, Z. Szillasi
University of Debrecen, Debrecen, Hungary
P. Raics, Z.L. Trocsanyi, B. Ujvari
National Institute of Science Education and Research, Bhubaneswar, India
S.K. Swain
Panjab University, Chandigarh, India
S.B. Beri, V. Bhatnagar, R. Gupta, U.Bhawandeep, A.K. Kalsi, M. Kaur, R. Kumar, M. Mittal, N. Nishu, J.B. Singh
University of Delhi, Delhi, India
Ashok Kumar, Arun Kumar, S. Ahuja, A. Bhardwaj, B.C. Choudhary, A. Kumar, S. Malhotra, M. Naimuddin, K. Ranjan, V. Sharma
Saha Institute of Nuclear Physics, Kolkata, India
S. Banerjee, S. Bhattacharya, K. Chatterjee, S. Dutta, B. Gomber, Sa. Jain, Sh. Jain, R. Khurana, A. Modak, S. Mukherjee, D. Roy, S. Sarkar, M. Sharan
Bhabha Atomic Research Centre, Mumbai, India
A. Abdulsalam, D. Dutta, S. Kailas, V. Kumar, A.K. Mohanty\cmsAuthorMark2, L.M. Pant, P. Shukla, A. Topkar
Tata Institute of Fundamental Research, Mumbai, India
T. Aziz, S. Banerjee, S. Bhowmik\cmsAuthorMark19, R.M. Chatterjee, R.K. Dewanjee, S. Dugad, S. Ganguly, S. Ghosh, M. Guchait, A. Gurtu\cmsAuthorMark20, G. Kole, S. Kumar, M. Maity\cmsAuthorMark19, G. Majumder, K. Mazumdar, G.B. Mohanty, B. Parida, K. Sudhakar, N. Wickramage\cmsAuthorMark21
Institute for Research in Fundamental Sciences (IPM), Tehran, Iran
H. Bakhshiansohi, H. Behnamian, S.M. Etesami\cmsAuthorMark22, A. Fahim\cmsAuthorMark23, R. Goldouzian, M. Khakzad, M. Mohammadi Najafabadi, M. Naseri, S. Paktinat Mehdiabadi, F. Rezaei Hosseinabadi, B. Safarzadeh\cmsAuthorMark24, M. Zeinali
University College Dublin, Dublin, Ireland
M. Felcini, M. Grunewald
INFN Sezione di Bari a, Università di Bari b, Politecnico di Bari c, Bari, Italy
M. Abbresciaa,b, L. Barbonea,b, C. Calabriaa,b, S.S. Chhibraa,b, A. Colaleoa, D. Creanzaa,c, N. De Filippisa,c, M. De Palmaa,b, L. Fiorea, G. Iasellia,c, G. Maggia,c, M. Maggia, S. Mya,c, S. Nuzzoa,b, A. Pompilia,b, G. Pugliesea,c, R. Radognaa,b,\cmsAuthorMark2, G. Selvaggia,b, L. Silvestrisa,\cmsAuthorMark2, G. Singha,b, R. Vendittia,b, G. Zitoa
INFN Sezione di Bologna a, Università di Bologna b, Bologna, Italy
G. Abbiendia, A.C. Benvenutia, D. Bonacorsia,b, S. Braibant-Giacomellia,b, L. Brigliadoria,b, R. Campaninia,b, P. Capiluppia,b, A. Castroa,b, F.R. Cavalloa, G. Codispotia,b, M. Cuffiania,b, G.M. Dallavallea, F. Fabbria, A. Fanfania,b, D. Fasanellaa,b, P. Giacomellia, C. Grandia, L. Guiduccia,b, S. Marcellinia, G. Masettia, A. Montanaria, F.L. Navarriaa,b, A. Perrottaa, F. Primaveraa,b, A.M. Rossia,b, T. Rovellia,b, G.P. Sirolia,b, N. Tosia,b, R. Travaglinia,b
INFN Sezione di Catania a, Università di Catania b, CSFNSM c, Catania, Italy
S. Albergoa,b, G. Cappelloa, M. Chiorbolia,b, S. Costaa,b, F. Giordanoa,\cmsAuthorMark2, R. Potenzaa,b, A. Tricomia,b, C. Tuvea,b
INFN Sezione di Firenze a, Università di Firenze b, Firenze, Italy
G. Barbaglia, V. Ciullia,b, C. Civininia, R. D’Alessandroa,b, E. Focardia,b, E. Galloa, S. Gonzia,b, V. Goria,b,\cmsAuthorMark2, P. Lenzia,b, M. Meschinia, S. Paolettia, G. Sguazzonia, A. Tropianoa,b
INFN Laboratori Nazionali di Frascati, Frascati, Italy
L. Benussi, S. Bianco, F. Fabbri, D. Piccolo
INFN Sezione di Genova a, Università di Genova b, Genova, Italy
R. Ferrettia,b, F. Ferroa, M. Lo Veterea,b, E. Robuttia, S. Tosia,b
INFN Sezione di Milano-Bicocca a, Università di Milano-Bicocca b, Milano, Italy
M.E. Dinardoa,b, S. Fiorendia,b,\cmsAuthorMark2, S. Gennaia,\cmsAuthorMark2, R. Gerosaa,b,\cmsAuthorMark2, A. Ghezzia,b, P. Govonia,b, M.T. Lucchinia,b,\cmsAuthorMark2, S. Malvezzia, R.A. Manzonia,b, A. Martellia,b, B. Marzocchia,b, D. Menascea, L. Moronia, M. Paganonia,b, D. Pedrinia, S. Ragazzia,b, N. Redaellia, T. Tabarelli de Fatisa,b
INFN Sezione di Napoli a, Università di Napoli ’Federico II’ b, Napoli, Italy, Università della Basilicata c, Potenza, Italy, Università G. Marconi d, Roma, Italy
S. Buontempoa, N. Cavalloa,c, S. Di Guidaa,d,\cmsAuthorMark2, F. Fabozzia,c, A.O.M. Iorioa,b, L. Listaa, S. Meolaa,d,\cmsAuthorMark2, M. Merolaa, P. Paoluccia,\cmsAuthorMark2
INFN Sezione di Padova a, Università di Padova b, Padova, Italy, Università di Trento c, Trento, Italy
P. Azzia, N. Bacchettaa, D. Biselloa,b, A. Brancaa,b, M. Dall’Ossoa,b, T. Dorigoa, M. Galantia,b, F. Gasparinia,b, P. Giubilatoa,b, A. Gozzelinoa, K. Kanishcheva,c, S. Lacapraraa, M. Margonia,b, A.T. Meneguzzoa,b, F. Montecassianoa, M. Passaseoa, J. Pazzinia,b, M. Pegoraroa, N. Pozzobona,b, P. Ronchesea,b, F. Simonettoa,b, E. Torassaa, M. Tosia,b, A. Triossia, P. Zottoa,b, A. Zucchettaa,b, G. Zumerlea,b
INFN Sezione di Pavia a, Università di Pavia b, Pavia, Italy
M. Gabusia,b, S.P. Rattia,b, V. Rea, C. Riccardia,b, P. Salvinia, P. Vituloa,b
INFN Sezione di Perugia a, Università di Perugia b, Perugia, Italy
M. Biasinia,b, G.M. Bileia, D. Ciangottinia,b, L. Fanòa,b, P. Laricciaa,b, G. Mantovania,b, M. Menichellia, F. Romeoa,b, A. Sahaa, A. Santocchiaa,b, A. Spieziaa,b,\cmsAuthorMark2
INFN Sezione di Pisa a, Università di Pisa b, Scuola Normale Superiore di Pisa c, Pisa, Italy
K. Androsova,\cmsAuthorMark25, P. Azzurria, G. Bagliesia, J. Bernardinia, T. Boccalia, G. Broccoloa,c, R. Castaldia, M.A. Cioccia,\cmsAuthorMark25, R. Dell’Orsoa, S. Donatoa,c, F. Fioria,c, L. Foàa,c, A. Giassia, M.T. Grippoa,\cmsAuthorMark25, F. Ligabuea,c, T. Lomtadzea, L. Martinia,b, A. Messineoa,b, C.S. Moona,\cmsAuthorMark26, F. Pallaa,\cmsAuthorMark2, A. Rizzia,b, A. Savoy-Navarroa,\cmsAuthorMark27, A.T. Serbana, P. Spagnoloa, P. Squillaciotia,\cmsAuthorMark25, R. Tenchinia, G. Tonellia,b, A. Venturia, P.G. Verdinia, C. Vernieria,c,\cmsAuthorMark2
INFN Sezione di Roma a, Università di Roma b, Roma, Italy
L. Baronea,b, F. Cavallaria, G. D’imperioa,b, D. Del Rea,b, M. Diemoza, M. Grassia,b, C. Jordaa, E. Longoa,b, F. Margarolia,b, P. Meridiania, F. Michelia,b,\cmsAuthorMark2, S. Nourbakhsha,b, G. Organtinia,b, R. Paramattia, S. Rahatloua,b, C. Rovellia, F. Santanastasioa,b, L. Soffia,b,\cmsAuthorMark2, P. Traczyka,b
INFN Sezione di Torino a, Università di Torino b, Torino, Italy, Università del Piemonte Orientale c, Novara, Italy
N. Amapanea,b, R. Arcidiaconoa,c, S. Argiroa,b,\cmsAuthorMark2, M. Arneodoa,c, R. Bellana,b, C. Biinoa, N. Cartigliaa, S. Casassoa,b,\cmsAuthorMark2, M. Costaa,b, A. Deganoa,b, N. Demariaa, L. Fincoa,b, C. Mariottia, S. Masellia, E. Migliorea,b, V. Monacoa,b, M. Musicha, M.M. Obertinoa,c,\cmsAuthorMark2, G. Ortonaa,b, L. Pachera,b, N. Pastronea, M. Pelliccionia, G.L. Pinna Angionia,b, A. Potenzaa,b, A. Romeroa,b, M. Ruspaa,c, R. Sacchia,b, A. Solanoa,b, A. Staianoa, U. Tamponia
INFN Sezione di Trieste a, Università di Trieste b, Trieste, Italy
S. Belfortea, V. Candelisea,b, M. Casarsaa, F. Cossuttia, G. Della Riccaa,b, B. Gobboa, C. La Licataa,b, M. Maronea,b, A. Schizzia,b,\cmsAuthorMark2, T. Umera,b, A. Zanettia
Kangwon National University, Chunchon, Korea
S. Chang, A. Kropivnitskaya, S.K. Nam
Kyungpook National University, Daegu, Korea
D.H. Kim, G.N. Kim, M.S. Kim, D.J. Kong, S. Lee, Y.D. Oh, H. Park, A. Sakharov, D.C. Son
Chonbuk National University, Jeonju, Korea
T.J. Kim
Chonnam National University, Institute for Universe and Elementary Particles, Kwangju, Korea
J.Y. Kim, S. Song
Korea University, Seoul, Korea
S. Choi, D. Gyun, B. Hong, M. Jo, H. Kim, Y. Kim, B. Lee, K.S. Lee, S.K. Park, Y. Roh
University of Seoul, Seoul, Korea
M. Choi, J.H. Kim, I.C. Park, G. Ryu, M.S. Ryu
Sungkyunkwan University, Suwon, Korea
Y. Choi, Y.K. Choi, J. Goh, D. Kim, E. Kwon, J. Lee, H. Seo, I. Yu
Vilnius University, Vilnius, Lithuania
A. Juodagalvis
National Centre for Particle Physics, Universiti Malaya, Kuala Lumpur, Malaysia
J.R. Komaragiri, M.A.B. Md Ali
Centro de Investigacion y de Estudios Avanzados del IPN, Mexico City, Mexico
H. Castilla-Valdez, E. De La Cruz-Burelo, I. Heredia-de La Cruz\cmsAuthorMark28, A. Hernandez-Almada, R. Lopez-Fernandez, A. Sanchez-Hernandez
Universidad Iberoamericana, Mexico City, Mexico
S. Carrillo Moreno, F. Vazquez Valencia
Benemerita Universidad Autonoma de Puebla, Puebla, Mexico
I. Pedraza, H.A. Salazar Ibarguen
Universidad Autónoma de San Luis Potosí, San Luis Potosí, Mexico
E. Casimiro Linares, A. Morelos Pineda
University of Auckland, Auckland, New Zealand
D. Krofcheck
University of Canterbury, Christchurch, New Zealand
P.H. Butler, S. Reucroft
National Centre for Physics, Quaid-I-Azam University, Islamabad, Pakistan
A. Ahmad, M. Ahmad, Q. Hassan, H.R. Hoorani, S. Khalid, W.A. Khan, T. Khurshid, M.A. Shah, M. Shoaib
National Centre for Nuclear Research, Swierk, Poland
H. Bialkowska, M. Bluj, B. Boimska, T. Frueboes, M. Górski, M. Kazana, K. Nawrocki, K. Romanowska-Rybinska, M. Szleper, P. Zalewski
Institute of Experimental Physics, Faculty of Physics, University of Warsaw, Warsaw, Poland
G. Brona, K. Bunkowski, M. Cwiok, W. Dominik, K. Doroba, A. Kalinowski, M. Konecki, J. Krolikowski, M. Misiura, M. Olszewski, W. Wolszczak
Laboratório de Instrumentação e Física Experimental de Partículas, Lisboa, Portugal
P. Bargassa, C. Beirão Da Cruz E Silva, P. Faccioli, P.G. Ferreira Parracho, M. Gallinaro, L. Lloret Iglesias, F. Nguyen, J. Rodrigues Antunes, J. Seixas, J. Varela, P. Vischia
Joint Institute for Nuclear Research, Dubna, Russia
M. Gavrilenko, I. Golutvin, I. Gorbunov, V. Karjavin, V. Konoplyanikov, V. Korenkov, G. Kozlov, A. Lanev, A. Malakhov, V. Matveev\cmsAuthorMark29, V.V. Mitsyn, P. Moisenz, V. Palichik, V. Perelygin, S. Shmatov, V. Smirnov, E. Tikhonenko, A. Zarubin
Petersburg Nuclear Physics Institute, Gatchina (St. Petersburg), Russia
V. Golovtsov, Y. Ivanov, V. Kim\cmsAuthorMark30, P. Levchenko, V. Murzin, V. Oreshkin, I. Smirnov, V. Sulimov, L. Uvarov, S. Vavilov, A. Vorobyev, An. Vorobyev
Institute for Nuclear Research, Moscow, Russia
Yu. Andreev, A. Dermenev, S. Gninenko, N. Golubev, M. Kirsanov, N. Krasnikov, A. Pashenkov, D. Tlisov, A. Toropin
Institute for Theoretical and Experimental Physics, Moscow, Russia
V. Epshteyn, V. Gavrilov, N. Lychkovskaya, V. Popov, G. Safronov, S. Semenov, A. Spiridonov, V. Stolin, E. Vlasov, A. Zhokin
P.N. Lebedev Physical Institute, Moscow, Russia
V. Andreev, M. Azarkin, I. Dremin, M. Kirakosyan, A. Leonidov, G. Mesyats, S.V. Rusakov, A. Vinogradov
Skobeltsyn Institute of Nuclear Physics, Lomonosov Moscow State University, Moscow, Russia
A. Belyaev, E. Boos, A. Ershov, A. Gribushin, L. Khein, V. Klyukhin, O. Kodolova, I. Lokhtin, O. Lukina, S. Obraztsov, S. Petrushanko, V. Savrin, A. Snigirev
State Research Center of Russian Federation, Institute for High Energy Physics, Protvino, Russia
I. Azhgirey, I. Bayshev, S. Bitioukov, V. Kachanov, A. Kalinin, D. Konstantinov, V. Krychkine, V. Petrov, R. Ryutin, A. Sobol, L. Tourtchanovitch, S. Troshin, N. Tyurin, A. Uzunian, A. Volkov
University of Belgrade, Faculty of Physics and Vinca Institute of Nuclear Sciences, Belgrade, Serbia
P. Adzic\cmsAuthorMark31, M. Ekmedzic, J. Milosevic, V. Rekovic
Centro de Investigaciones Energéticas Medioambientales y Tecnológicas (CIEMAT), Madrid, Spain
J. Alcaraz Maestre, C. Battilana, E. Calvo, M. Cerrada, M. Chamizo Llatas, N. Colino, B. De La Cruz, A. Delgado Peris, D. Domínguez Vázquez, A. Escalante Del Valle, C. Fernandez Bedoya, J.P. Fernández Ramos, J. Flix, M.C. Fouz, P. Garcia-Abia, O. Gonzalez Lopez, S. Goy Lopez, J.M. Hernandez, M.I. Josa, E. Navarro De Martino, A. Pérez-Calero Yzquierdo, J. Puerta Pelayo, A. Quintario Olmeda, I. Redondo, L. Romero, M.S. Soares
Universidad Autónoma de Madrid, Madrid, Spain
C. Albajar, J.F. de Trocóniz, M. Missiroli, D. Moran
Universidad de Oviedo, Oviedo, Spain
H. Brun, J. Cuevas, J. Fernandez Menendez, S. Folgueras, I. Gonzalez Caballero
Instituto de Física de Cantabria (IFCA), CSIC-Universidad de Cantabria, Santander, Spain
J.A. Brochero Cifuentes, I.J. Cabrillo, A. Calderon, J. Duarte Campderros, M. Fernandez, G. Gomez, A. Graziano, A. Lopez Virto, J. Marco, R. Marco, C. Martinez Rivero, F. Matorras, F.J. Munoz Sanchez, J. Piedra Gomez, T. Rodrigo, A.Y. Rodríguez-Marrero, A. Ruiz-Jimeno, L. Scodellaro, I. Vila, R. Vilar Cortabitarte
CERN, European Organization for Nuclear Research, Geneva, Switzerland
D. Abbaneo, E. Auffray, G. Auzinger, M. Bachtis, P. Baillon, A.H. Ball, D. Barney, A. Benaglia, J. Bendavid, L. Benhabib, J.F. Benitez, C. Bernet\cmsAuthorMark7, G. Bianchi, P. Bloch, A. Bocci, A. Bonato, O. Bondu, C. Botta, H. Breuker, T. Camporesi, G. Cerminara, S. Colafranceschi\cmsAuthorMark32, M. D’Alfonso, D. d’Enterria, A. Dabrowski, A. David, F. De Guio, A. De Roeck, S. De Visscher, E. Di Marco, M. Dobson, M. Dordevic, B. Dorney, N. Dupont-Sagorin, A. Elliott-Peisert, J. Eugster, G. Franzoni, W. Funk, D. Gigi, K. Gill, D. Giordano, M. Girone, F. Glege, R. Guida, S. Gundacker, M. Guthoff, J. Hammer, M. Hansen, P. Harris, J. Hegeman, V. Innocente, P. Janot, K. Kousouris, K. Krajczar, P. Lecoq, C. Lourenço, N. Magini, L. Malgeri, M. Mannelli, J. Marrouche, L. Masetti, F. Meijers, S. Mersi, E. Meschi, F. Moortgat, S. Morovic, M. Mulders, P. Musella, L. Orsini, L. Pape, E. Perez, L. Perrozzi, A. Petrilli, G. Petrucciani, A. Pfeiffer, M. Pierini, M. Pimiä, D. Piparo, M. Plagge, A. Racz, G. Rolandi\cmsAuthorMark33, M. Rovere, H. Sakulin, C. Schäfer, C. Schwick, A. Sharma, P. Siegrist, P. Silva, M. Simon, P. Sphicas\cmsAuthorMark34, D. Spiga, J. Steggemann, B. Stieger, M. Stoye, Y. Takahashi, D. Treille, A. Tsirou, G.I. Veres\cmsAuthorMark17, J.R. Vlimant, N. Wardle, H.K. Wöhri, H. Wollny, W.D. Zeuner
Paul Scherrer Institut, Villigen, Switzerland
W. Bertl, K. Deiters, W. Erdmann, R. Horisberger, Q. Ingram, H.C. Kaestli, D. Kotlinski, U. Langenegger, D. Renker, T. Rohe
Institute for Particle Physics, ETH Zurich, Zurich, Switzerland
F. Bachmair, L. Bäni, L. Bianchini, M.A. Buchmann, B. Casal, N. Chanon, G. Dissertori, M. Dittmar, M. Donegà, M. Dünser, P. Eller, C. Grab, D. Hits, J. Hoss, W. Lustermann, B. Mangano, A.C. Marini, P. Martinez Ruiz del Arbol, M. Masciovecchio, D. Meister, N. Mohr, C. Nägeli\cmsAuthorMark35, F. Nessi-Tedaldi, F. Pandolfi, F. Pauss, M. Peruzzi, M. Quittnat, L. Rebane, M. Rossini, A. Starodumov\cmsAuthorMark36, M. Takahashi, K. Theofilatos, R. Wallny, H.A. Weber
Universität Zürich, Zurich, Switzerland
C. Amsler\cmsAuthorMark37, M.F. Canelli, V. Chiochia, A. De Cosa, A. Hinzmann, T. Hreus, B. Kilminster, C. Lange, B. Millan Mejias, J. Ngadiuba, P. Robmann, F.J. Ronga, S. Taroni, M. Verzetti, Y. Yang
National Central University, Chung-Li, Taiwan
M. Cardaci, K.H. Chen, C. Ferro, C.M. Kuo, W. Lin, Y.J. Lu, R. Volpe, S.S. Yu
National Taiwan University (NTU), Taipei, Taiwan
P. Chang, Y.H. Chang, Y.W. Chang, Y. Chao, K.F. Chen, P.H. Chen, C. Dietz, U. Grundler, W.-S. Hou, K.Y. Kao, Y.J. Lei, Y.F. Liu, R.-S. Lu, D. Majumder, E. Petrakou, Y.M. Tzeng, R. Wilken
Chulalongkorn University, Faculty of Science, Department of Physics, Bangkok, Thailand
B. Asavapibhop, N. Srimanobhas, N. Suwonjandee
Cukurova University, Adana, Turkey
A. Adiguzel, M.N. Bakirci\cmsAuthorMark38, S. Cerci\cmsAuthorMark39, C. Dozen, I. Dumanoglu, E. Eskut, S. Girgis, G. Gokbulut, E. Gurpinar, I. Hos, E.E. Kangal, A. Kayis Topaksu, G. Onengut\cmsAuthorMark40, K. Ozdemir, S. Ozturk\cmsAuthorMark38, A. Polatoz, D. Sunar Cerci\cmsAuthorMark39, B. Tali\cmsAuthorMark39, H. Topakli\cmsAuthorMark38, M. Vergili
Middle East Technical University, Physics Department, Ankara, Turkey
I.V. Akin, B. Bilin, S. Bilmis, H. Gamsizkan\cmsAuthorMark41, G. Karapinar\cmsAuthorMark42, K. Ocalan\cmsAuthorMark43, S. Sekmen, U.E. Surat, M. Yalvac, M. Zeyrek
Bogazici University, Istanbul, Turkey
E. Gülmez, B. Isildak\cmsAuthorMark44, M. Kaya\cmsAuthorMark45, O. Kaya\cmsAuthorMark46
Istanbul Technical University, Istanbul, Turkey
K. Cankocak, F.I. Vardarlı
National Scientific Center, Kharkov Institute of Physics and Technology, Kharkov, Ukraine
L. Levchuk, P. Sorokin
University of Bristol, Bristol, United Kingdom
J.J. Brooke, E. Clement, D. Cussans, H. Flacher, J. Goldstein, M. Grimes, G.P. Heath, H.F. Heath, J. Jacob, L. Kreczko, C. Lucas, Z. Meng, D.M. Newbold\cmsAuthorMark47, S. Paramesvaran, A. Poll, S. Senkin, V.J. Smith, T. Williams
Rutherford Appleton Laboratory, Didcot, United Kingdom
K.W. Bell, A. Belyaev\cmsAuthorMark48, C. Brew, R.M. Brown, D.J.A. Cockerill, J.A. Coughlan, K. Harder, S. Harper, E. Olaiya, D. Petyt, C.H. Shepherd-Themistocleous, A. Thea, I.R. Tomalin, W.J. Womersley, S.D. Worm
Imperial College, London, United Kingdom
M. Baber, R. Bainbridge, O. Buchmuller, D. Burton, D. Colling, N. Cripps, M. Cutajar, P. Dauncey, G. Davies, M. Della Negra, P. Dunne, W. Ferguson, J. Fulcher, D. Futyan, A. Gilbert, G. Hall, G. Iles, M. Jarvis, G. Karapostoli, M. Kenzie, R. Lane, R. Lucas\cmsAuthorMark47, L. Lyons, A.-M. Magnan, S. Malik, B. Mathias, J. Nash, A. Nikitenko\cmsAuthorMark36, J. Pela, M. Pesaresi, K. Petridis, D.M. Raymond, S. Rogerson, A. Rose, C. Seez, P. Sharp, A. Tapper, M. Vazquez Acosta, T. Virdee, S.C. Zenz
Brunel University, Uxbridge, United Kingdom
J.E. Cole, P.R. Hobson, A. Khan, P. Kyberd, D. Leggat, D. Leslie, W. Martin, I.D. Reid, P. Symonds, L. Teodorescu, M. Turner
Baylor University, Waco, USA
J. Dittmann, K. Hatakeyama, A. Kasmi, H. Liu, T. Scarborough
The University of Alabama, Tuscaloosa, USA
O. Charaf, S.I. Cooper, C. Henderson, P. Rumerio
Boston University, Boston, USA
A. Avetisyan, T. Bose, C. Fantasia, P. Lawson, C. Richardson, J. Rohlf, J. St. John, L. Sulak
Brown University, Providence, USA
J. Alimena, E. Berry, S. Bhattacharya, G. Christopher, D. Cutts, Z. Demiragli, N. Dhingra, A. Ferapontov, A. Garabedian, U. Heintz, G. Kukartsev, E. Laird, G. Landsberg, M. Luk, M. Narain, M. Segala, T. Sinthuprasith, T. Speer, J. Swanson
University of California, Davis, Davis, USA
R. Breedon, G. Breto, M. Calderon De La Barca Sanchez, S. Chauhan, M. Chertok, J. Conway, R. Conway, P.T. Cox, R. Erbacher, M. Gardner, W. Ko, R. Lander, T. Miceli, M. Mulhearn, D. Pellett, J. Pilot, F. Ricci-Tam, M. Searle, S. Shalhout, J. Smith, M. Squires, D. Stolp, M. Tripathi, S. Wilbur, R. Yohay
University of California, Los Angeles, USA
R. Cousins, P. Everaerts, C. Farrell, J. Hauser, M. Ignatenko, G. Rakness, E. Takasugi, V. Valuev, M. Weber
University of California, Riverside, Riverside, USA
K. Burt, R. Clare, J. Ellison, J.W. Gary, G. Hanson, J. Heilman, M. Ivova Rikova, P. Jandir, E. Kennedy, F. Lacroix, O.R. Long, A. Luthra, M. Malberti, H. Nguyen, M. Olmedo Negrete, A. Shrinivas, S. Sumowidagdo, S. Wimpenny
University of California, San Diego, La Jolla, USA
W. Andrews, J.G. Branson, G.B. Cerati, S. Cittolin, R.T. D’Agnolo, D. Evans, A. Holzner, R. Kelley, D. Klein, M. Lebourgeois, J. Letts, I. Macneill, D. Olivito, S. Padhi, C. Palmer, M. Pieri, M. Sani, V. Sharma, S. Simon, E. Sudano, M. Tadel, Y. Tu, A. Vartak, C. Welke, F. Würthwein, A. Yagil
University of California, Santa Barbara, Santa Barbara, USA
D. Barge, J. Bradmiller-Feld, C. Campagnari, T. Danielson, A. Dishaw, K. Flowers, M. Franco Sevilla, P. Geffert, C. George, F. Golf, L. Gouskos, J. Incandela, C. Justus, N. Mccoll, J. Richman, D. Stuart, W. To, C. West, J. Yoo
California Institute of Technology, Pasadena, USA
A. Apresyan, A. Bornheim, J. Bunn, Y. Chen, J. Duarte, A. Mott, H.B. Newman, C. Pena, C. Rogan, M. Spiropulu, V. Timciuc, R. Wilkinson, S. Xie, R.Y. Zhu
Carnegie Mellon University, Pittsburgh, USA
V. Azzolini, A. Calamba, B. Carlson, T. Ferguson, Y. Iiyama, M. Paulini, J. Russ, H. Vogel, I. Vorobiev
University of Colorado at Boulder, Boulder, USA
J.P. Cumalat, W.T. Ford, A. Gaz, E. Luiggi Lopez, U. Nauenberg, J.G. Smith, K. Stenson, K.A. Ulmer, S.R. Wagner
Cornell University, Ithaca, USA
J. Alexander, A. Chatterjee, J. Chu, S. Dittmer, N. Eggert, N. Mirman, G. Nicolas Kaufman, J.R. Patterson, A. Ryd, E. Salvati, L. Skinnari, W. Sun, W.D. Teo, J. Thom, J. Thompson, J. Tucker, Y. Weng, L. Winstrom, P. Wittich
Fairfield University, Fairfield, USA
D. Winn
Fermi National Accelerator Laboratory, Batavia, USA
S. Abdullin, M. Albrow, J. Anderson, G. Apollinari, L.A.T. Bauerdick, A. Beretvas, J. Berryhill, P.C. Bhat, G. Bolla, K. Burkett, J.N. Butler, H.W.K. Cheung, F. Chlebana, S. Cihangir, V.D. Elvira, I. Fisk, J. Freeman, Y. Gao, E. Gottschalk, L. Gray, D. Green, S. Grünendahl, O. Gutsche, J. Hanlon, D. Hare, R.M. Harris, J. Hirschauer, B. Hooberman, S. Jindariani, M. Johnson, U. Joshi, K. Kaadze, B. Klima, B. Kreis, S. Kwan, J. Linacre, D. Lincoln, R. Lipton, T. Liu, J. Lykken, K. Maeshima, J.M. Marraffino, V.I. Martinez Outschoorn, S. Maruyama, D. Mason, P. McBride, P. Merkel, K. Mishra, S. Mrenna, Y. Musienko\cmsAuthorMark29, S. Nahn, C. Newman-Holmes, V. O’Dell, O. Prokofyev, E. Sexton-Kennedy, S. Sharma, A. Soha, W.J. Spalding, L. Spiegel, L. Taylor, S. Tkaczyk, N.V. Tran, L. Uplegger, E.W. Vaandering, R. Vidal, A. Whitbeck, J. Whitmore, F. Yang
University of Florida, Gainesville, USA
D. Acosta, P. Avery, P. Bortignon, D. Bourilkov, M. Carver, T. Cheng, D. Curry, S. Das, M. De Gruttola, G.P. Di Giovanni, R.D. Field, M. Fisher, I.K. Furic, J. Hugon, J. Konigsberg, A. Korytov, T. Kypreos, J.F. Low, K. Matchev, P. Milenovic\cmsAuthorMark49, G. Mitselmakher, L. Muniz, A. Rinkevicius, L. Shchutska, M. Snowball, D. Sperka, J. Yelton, M. Zakaria
Florida International University, Miami, USA
S. Hewamanage, S. Linn, P. Markowitz, G. Martinez, J.L. Rodriguez
Florida State University, Tallahassee, USA
T. Adams, A. Askew, J. Bochenek, B. Diamond, J. Haas, S. Hagopian, V. Hagopian, K.F. Johnson, H. Prosper, V. Veeraraghavan, M. Weinberg
Florida Institute of Technology, Melbourne, USA
M.M. Baarmand, M. Hohlmann, H. Kalakhety, F. Yumiceva
University of Illinois at Chicago (UIC), Chicago, USA
M.R. Adams, L. Apanasevich, V.E. Bazterra, D. Berry, R.R. Betts, I. Bucinskaite, R. Cavanaugh, O. Evdokimov, L. Gauthier, C.E. Gerber, D.J. Hofman, S. Khalatyan, P. Kurt, D.H. Moon, C. O’Brien, C. Silkworth, P. Turner, N. Varelas
The University of Iowa, Iowa City, USA
E.A. Albayrak\cmsAuthorMark50, B. Bilki\cmsAuthorMark51, W. Clarida, K. Dilsiz, F. Duru, M. Haytmyradov, J.-P. Merlo, H. Mermerkaya\cmsAuthorMark52, A. Mestvirishvili, A. Moeller, J. Nachtman, H. Ogul, Y. Onel, F. Ozok\cmsAuthorMark50, A. Penzo, R. Rahmat, S. Sen, P. Tan, E. Tiras, J. Wetzel, T. Yetkin\cmsAuthorMark53, K. Yi
Johns Hopkins University, Baltimore, USA
B.A. Barnett, B. Blumenfeld, S. Bolognesi, D. Fehling, A.V. Gritsan, P. Maksimovic, C. Martin, M. Swartz
The University of Kansas, Lawrence, USA
P. Baringer, A. Bean, G. Benelli, C. Bruner, R.P. Kenny III, M. Malek, M. Murray, D. Noonan, S. Sanders, J. Sekaric, R. Stringer, Q. Wang, J.S. Wood
Kansas State University, Manhattan, USA
A.F. Barfuss, I. Chakaberia, A. Ivanov, S. Khalil, M. Makouski, Y. Maravin, L.K. Saini, S. Shrestha, N. Skhirtladze, I. Svintradze
Lawrence Livermore National Laboratory, Livermore, USA
J. Gronberg, D. Lange, F. Rebassoo, D. Wright
University of Maryland, College Park, USA
A. Baden, A. Belloni, B. Calvert, S.C. Eno, J.A. Gomez, N.J. Hadley, R.G. Kellogg, T. Kolberg, Y. Lu, M. Marionneau, A.C. Mignerey, K. Pedro, A. Skuja, M.B. Tonjes, S.C. Tonwar
Massachusetts Institute of Technology, Cambridge, USA
A. Apyan, R. Barbieri, G. Bauer, W. Busza, I.A. Cali, M. Chan, L. Di Matteo, V. Dutta, G. Gomez Ceballos, M. Goncharov, D. Gulhan, M. Klute, Y.S. Lai, Y.-J. Lee, A. Levin, P.D. Luckey, T. Ma, C. Paus, D. Ralph, C. Roland, G. Roland, G.S.F. Stephans, F. Stöckli, K. Sumorok, D. Velicanu, J. Veverka, B. Wyslouch, M. Yang, M. Zanetti, V. Zhukova
University of Minnesota, Minneapolis, USA
B. Dahmes, A. Gude, S.C. Kao, K. Klapoetke, Y. Kubota, J. Mans, N. Pastika, R. Rusack, A. Singovsky, N. Tambe, J. Turkewitz
University of Mississippi, Oxford, USA
J.G. Acosta, S. Oliveros
University of Nebraska-Lincoln, Lincoln, USA
E. Avdeeva, K. Bloom, S. Bose, D.R. Claes, A. Dominguez, R. Gonzalez Suarez, J. Keller, D. Knowlton, I. Kravchenko, J. Lazo-Flores, S. Malik, F. Meier, G.R. Snow, M. Zvada
State University of New York at Buffalo, Buffalo, USA
J. Dolen, A. Godshalk, I. Iashvili, A. Kharchilava, A. Kumar, S. Rappoccio
Northeastern University, Boston, USA
G. Alverson, E. Barberis, D. Baumgartel, M. Chasco, J. Haley, A. Massironi, D.M. Morse, D. Nash, T. Orimoto, D. Trocino, R.-J. Wang, D. Wood, J. Zhang
Northwestern University, Evanston, USA
K.A. Hahn, A. Kubik, N. Mucia, N. Odell, B. Pollack, A. Pozdnyakov, M. Schmitt, S. Stoynev, K. Sung, M. Velasco, S. Won
University of Notre Dame, Notre Dame, USA
A. Brinkerhoff, K.M. Chan, A. Drozdetskiy, M. Hildreth, C. Jessop, D.J. Karmgard, N. Kellams, K. Lannon, W. Luo, S. Lynch, N. Marinelli, T. Pearson, M. Planer, R. Ruchti, N. Valls, M. Wayne, M. Wolf, A. Woodard
The Ohio State University, Columbus, USA
L. Antonelli, J. Brinson, B. Bylsma, L.S. Durkin, S. Flowers, C. Hill, R. Hughes, K. Kotov, T.Y. Ling, D. Puigh, M. Rodenburg, G. Smith, B.L. Winer, H. Wolfe, H.W. Wulsin
Princeton University, Princeton, USA
O. Driga, P. Elmer, P. Hebda, A. Hunt, S.A. Koay, P. Lujan, D. Marlow, T. Medvedeva, M. Mooney, J. Olsen, P. Piroué, X. Quan, H. Saka, D. Stickland\cmsAuthorMark2, C. Tully, J.S. Werner, A. Zuranski
University of Puerto Rico, Mayaguez, USA
E. Brownson, H. Mendez, J.E. Ramirez Vargas
Purdue University, West Lafayette, USA
V.E. Barnes, D. Benedetti, D. Bortoletto, M. De Mattia, L. Gutay, Z. Hu, M.K. Jha, M. Jones, K. Jung, M. Kress, N. Leonardo, D. Lopes Pegna, V. Maroussov, D.H. Miller, N. Neumeister, B.C. Radburn-Smith, X. Shi, I. Shipsey, D. Silvers, A. Svyatkovskiy, F. Wang, W. Xie, L. Xu, H.D. Yoo, J. Zablocki, Y. Zheng
Purdue University Calumet, Hammond, USA
N. Parashar, J. Stupak
Rice University, Houston, USA
A. Adair, B. Akgun, K.M. Ecklund, F.J.M. Geurts, W. Li, B. Michlin, B.P. Padley, R. Redjimi, J. Roberts, J. Zabel
University of Rochester, Rochester, USA
B. Betchart, A. Bodek, R. Covarelli, P. de Barbaro, R. Demina, Y. Eshaq, T. Ferbel, A. Garcia-Bellido, P. Goldenzweig, J. Han, A. Harel, A. Khukhunaishvili, G. Petrillo, D. Vishnevskiy
The Rockefeller University, New York, USA
R. Ciesielski, L. Demortier, K. Goulianos, G. Lungu, C. Mesropian
Rutgers, The State University of New Jersey, Piscataway, USA
S. Arora, A. Barker, J.P. Chou, C. Contreras-Campana, E. Contreras-Campana, D. Duggan, D. Ferencek, Y. Gershtein, R. Gray, E. Halkiadakis, D. Hidas, S. Kaplan, A. Lath, S. Panwalkar, M. Park, R. Patel, S. Salur, S. Schnetzer, S. Somalwar, R. Stone, S. Thomas, P. Thomassen, M. Walker
University of Tennessee, Knoxville, USA
K. Rose, S. Spanier, A. York
Texas A&M University, College Station, USA
O. Bouhali\cmsAuthorMark54, A. Castaneda Hernandez, R. Eusebi, W. Flanagan, J. Gilmore, T. Kamon\cmsAuthorMark55, V. Khotilovich, V. Krutelyov, R. Montalvo, I. Osipenkov, Y. Pakhotin, A. Perloff, J. Roe, A. Rose, A. Safonov, T. Sakuma, I. Suarez, A. Tatarinov
Texas Tech University, Lubbock, USA
N. Akchurin, C. Cowden, J. Damgov, C. Dragoiu, P.R. Dudero, J. Faulkner, K. Kovitanggoon, S. Kunori, S.W. Lee, T. Libeiro, I. Volobouev
Vanderbilt University, Nashville, USA
E. Appelt, A.G. Delannoy, S. Greene, A. Gurrola, W. Johns, C. Maguire, Y. Mao, A. Melo, M. Sharma, P. Sheldon, B. Snook, S. Tuo, J. Velkovska
University of Virginia, Charlottesville, USA
M.W. Arenton, S. Boutle, B. Cox, B. Francis, J. Goodell, R. Hirosky, A. Ledovskoy, H. Li, C. Lin, C. Neu, J. Wood
Wayne State University, Detroit, USA
C. Clarke, R. Harr, P.E. Karchin, C. Kottachchi Kankanamge Don, P. Lamichhane, J. Sturdy
University of Wisconsin, Madison, USA
D.A. Belknap, D. Carlsmith, M. Cepeda, S. Dasu, L. Dodd, S. Duric, E. Friis, R. Hall-Wilton, M. Herndon, A. Hervé, P. Klabbers, A. Lanaro, C. Lazaridis, A. Levine, R. Loveless, A. Mohapatra, I. Ojalvo, T. Perry, G.A. Pierro, G. Polese, I. Ross, T. Sarangi, A. Savin, W.H. Smith, D. Taylor, P. Verwilligen, C. Vuosalo, N. Woods
†: Deceased
1: Also at Vienna University of Technology, Vienna, Austria
2: Also at CERN, European Organization for Nuclear Research, Geneva, Switzerland
3: Also at Institut Pluridisciplinaire Hubert Curien, Université de Strasbourg, Université de Haute Alsace Mulhouse, CNRS/IN2P3, Strasbourg, France
4: Also at National Institute of Chemical Physics and Biophysics, Tallinn, Estonia
5: Also at Skobeltsyn Institute of Nuclear Physics, Lomonosov Moscow State University, Moscow, Russia
6: Also at Universidade Estadual de Campinas, Campinas, Brazil
7: Also at Laboratoire Leprince-Ringuet, Ecole Polytechnique, IN2P3-CNRS, Palaiseau, France
8: Also at Joint Institute for Nuclear Research, Dubna, Russia
9: Also at Suez University, Suez, Egypt
10: Also at Cairo University, Cairo, Egypt
11: Also at Fayoum University, El-Fayoum, Egypt
12: Also at British University in Egypt, Cairo, Egypt
13: Now at Ain Shams University, Cairo, Egypt
14: Also at Université de Haute Alsace, Mulhouse, France
15: Also at Brandenburg University of Technology, Cottbus, Germany
16: Also at Institute of Nuclear Research ATOMKI, Debrecen, Hungary
17: Also at Eötvös Loránd University, Budapest, Hungary
18: Also at University of Debrecen, Debrecen, Hungary
19: Also at University of Visva-Bharati, Santiniketan, India
20: Now at King Abdulaziz University, Jeddah, Saudi Arabia
21: Also at University of Ruhuna, Matara, Sri Lanka
22: Also at Isfahan University of Technology, Isfahan, Iran
23: Also at Sharif University of Technology, Tehran, Iran
24: Also at Plasma Physics Research Center, Science and Research Branch, Islamic Azad University, Tehran, Iran
25: Also at Università degli Studi di Siena, Siena, Italy
26: Also at Centre National de la Recherche Scientifique (CNRS) - IN2P3, Paris, France
27: Also at Purdue University, West Lafayette, USA
28: Also at Universidad Michoacana de San Nicolas de Hidalgo, Morelia, Mexico
29: Also at Institute for Nuclear Research, Moscow, Russia
30: Also at St. Petersburg State Polytechnical University, St. Petersburg, Russia
31: Also at Faculty of Physics, University of Belgrade, Belgrade, Serbia
32: Also at Facoltà Ingegneria, Università di Roma, Roma, Italy
33: Also at Scuola Normale e Sezione dell’INFN, Pisa, Italy
34: Also at University of Athens, Athens, Greece
35: Also at Paul Scherrer Institut, Villigen, Switzerland
36: Also at Institute for Theoretical and Experimental Physics, Moscow, Russia
37: Also at Albert Einstein Center for Fundamental Physics, Bern, Switzerland
38: Also at Gaziosmanpasa University, Tokat, Turkey
39: Also at Adiyaman University, Adiyaman, Turkey
40: Also at Cag University, Mersin, Turkey
41: Also at Anadolu University, Eskisehir, Turkey
42: Also at Izmir Institute of Technology, Izmir, Turkey
43: Also at Necmettin Erbakan University, Konya, Turkey
44: Also at Ozyegin University, Istanbul, Turkey
45: Also at Marmara University, Istanbul, Turkey
46: Also at Kafkas University, Kars, Turkey
47: Also at Rutherford Appleton Laboratory, Didcot, United Kingdom
48: Also at School of Physics and Astronomy, University of Southampton, Southampton, United Kingdom
49: Also at University of Belgrade, Faculty of Physics and Vinca Institute of Nuclear Sciences, Belgrade, Serbia
50: Also at Mimar Sinan University, Istanbul, Istanbul, Turkey
51: Also at Argonne National Laboratory, Argonne, USA
52: Also at Erzincan University, Erzincan, Turkey
53: Also at Yildiz Technical University, Istanbul, Turkey
54: Also at Texas A&M University at Qatar, Doha, Qatar
55: Also at Kyungpook National University, Daegu, Korea