Growth and Evolution of Thermal Instabilities in Idealized Galaxy-Cluster Cores
Abstract
Heat input roughly balances radiative cooling in the gaseous cores of galaxy clusters even when the central cooling time is short, implying that cooling triggers a feedback loop that maintains thermal balance. Furthermore, cores with short cooling times tend to have multiphase structure, suggesting that the intracluster medium (ICM) becomes locally thermally unstable for cooling times Gyr. Both observations and theoretical models have linked the condensation of cold gas with heating by an active galactic nucleus (AGN) through a cycle in which cooling gas fuels the AGN and drives energetic outbursts that reheat the ICM and maintain a state of approximate thermal balance. In this work, we use 2D and 3D hydrodynamic simulations to study the onset of condensation in idealized galaxy-cluster cores. In particular, we look at how the condensation process depends on the ratio of cooling time to freefall time and on the geometry of the gravitational potential. We conclude that the ICM can always evolve to a state in which condensation occurs if given enough time, but that an initial timescale ratio is needed for thermal instability to grow quickly enough to affect realistic cluster cores within a timescale that is relevant for cosmological structure formation. We find that instability leads to convection and that perturbations continue to grow while the gas convects. Condensation occurs when the timescale ratio in the low-entropy tail of the perturbation distribution drops below , even if the volume-averaged timescale ratio is substantially greater. In our simulations, the geometry of the gravitational potential does not have a strong effect on thermal stability. Finally, we find that if condensation is powering feedback, a conversion efficiency of around for converting the condensed mass into thermal energy is sufficient to maintain thermal balance in the ICM.
I. Introduction
X-ray observations of galaxy clusters have revealed that the radiative cooling time of gas in many cluster cores is much shorter than the Hubble time. If radiative cooling were uncompensated by heating, the gas would radiate away its thermal energy, causing cooling gas to flow toward the center of the cluster. This would be a classical cooling flow, in which the accumulating cold gas would be observable and would lead to star formation rates of (see Fabian [14] for a review). Instead, X-ray observations reveal little gas cooling below X-ray emitting temperatures [37, 36, e.g.] and observed star-formation rates that are one or two orders of magnitude lower than predicted by the classic cooling-flow model [35, 29]. Thus, an additional process or processes must be heating the ICM to maintain approximate thermal equilibrium. Several mechanisms have been proposed and tested through simulations, including energy injection from supernovae [33, 7, 49], conduction of heat from outside of the core [53, 58, 50], heating through mergers [52, 26, 59], dynamical friction from galaxy cluster motion [42, 21], and feedback from AGN outbursts [30, reviewed by], which is the mechanism we explore in this work.
AGN feedback is attractive because a simple order-of-magnitude estimate shows that an accreting supermassive black hole (SMBH) can easily provide enough energy to offset cooling. For example, a SMBH accreting over the lifetime of the universe and radiating with a mass-energy conversion efficiency of around 10% would release a total of ergs, corresponding to an average power output of around ergs per second—easily enough to offset radiative cooling if a large fraction of that power is injected into the ICM (see Churazov et al. [10] for further discussion). Theoretical and observational studies support the conclusion that many cool-core clusters host AGN with enough power to balance cooling [30, 13, 4, e.g.,] if a significant fraction of the AGN energy is transfered to the ICM. Nevertheless, the details of the AGN fueling process and feedback mode are not fully understood.
If SMBH accretion is to explain thermal regulation of the core, then the accretion rate must be linked to the thermal properties of the ICM. As pointed out by McNamara & Nulsen [30], if the time-averaged heating rate exceeds the cooling rate, the core will heat beyond what is observed, and if it is lower it will fail to prevent gas from cooling. More importantly, the short cooling times observed in many cluster cores require the heating mechanism to respond on short timescales, on the order of tens of millions of years. It is therefore desirable that heating be coupled to the cooling rate, to ensure that feedback is able to balance cooling both on short timescales and over the lifetime of the cluster. Two qualitatively different accretion modes have been described in the literature and implemented in numerical simulations of AGN feedback. Most implementations base the black hole accretion rate on the properties of the ambient hot gas using modifications of the classic Bondi [5] analysis of smooth, adiabatic accretion, while others rely on condensation and infall of cold clouds to fuel the black hole [38, 20, 19, e.g.,]. The analysis of Voit et al. [55] strongly suggests that the latter “cold feedback” mode is more important, because of a universal floor observed in the radial cooling-time profiles of galaxy clusters that corresponds to the predicted threshold for condensation of cold clouds [45].
“Cold mode” accretion could be fueled by cold gas condensing out of the ICM in response to thermal instability. The transition of the ICM from a homogeneous to a hetrogeneous, multiphase structure has a long history of investigation using theoretical arguments and simulations. From a theoretical standpoint, Field [15] studied the evolution of small perturbations in cooling plasmas and described an isobaric condensation mode, in which variations in temperature and density may be amplified. Defouw [12] extended this analysis, finding that thermal and convective stability are tightly coupled, a connection further explored in Balbus & Soker [2]. The problem of thermal instability in the context of cooling flows in clusters was subsequently considered by numerous authors [11, 34, 24, 23, e.g.] who concluded that the cooling ICM should indeed be subject to thermal instability. However, further analysis by Balbus [1] and Balbus & Soker [2] using a Lagrangian framework (in contrast to the Eulerian approach of the earlier works) indicated that the ICM might be less susceptible to thermal instability than previously thought, especially without the inclusion of a heating term. These studies generally take as their starting point an equilibrium or steady-state configuration of gas that may not accurately capture the behavior of the dynamic ICM. Further, theoretical studies are often incapable of dealing with spatially dependent heating terms, such as would be expected from star formation and AGN feedback.
There is growing evidence suggesting that the dominant parameter controlling the transition to a multiphase state and the amount of cold gas that condenses is the ratio of gas cooling time, , to freefall time, . Both numerical simulations of thermal instability [27] and observations of galaxy-cluster cores [9, 39, 55] support this conclusion. Without gravity to restore equilibrium, multiphase structure can develop within a few cooling times, because collisional cooling processes scale with the square of the gas density, allowing denser regions to cool faster than their surroundings. If the medium is in overall thermal balance, gas clumps that are denser than average cool and condense, while underdense regions heat and expand faster than they can cool. In a gravitational potential, however, buoyancy complicates the development of thermal instability and can inhibit condensation [24, 2]. If the freefall time is significantly longer than the radiative cooling time, an overdense clump can sink to a denser layer before it can significantly cool.
While theoretical studies provide insight into the general physics behind condensation in the ICM, they are necessarily limited by model assumptions and can say little about the fate of instabilities that enter the nonlinear regime. In recent decades, hydrodynamic simulations such as those of Malagoli et al. [25], McCourt et al. [27], and Li & Bryan [22] have explored the development of thermal instability in astrophysical environments. These works demonstrated that condensation can indeed be expected to occur in environments comparable to the ICM, at a level exceeding the predictions of Balbus & Soker [2].
Condensation has been explored in the idealized simulations of McCourt et al. [27], which show that the growth of thermal instabilities is significantly inhibited if . However, further studies by Sharma et al. [46] have found that in a spherical geometry, multiphase gas can still condense whenever due to geometric compression (see Singh & Sharma [48] for further discussion.) Gaspari et al. [20] also finds that a ratio of around 10 is required for the formation of cold clumps. Alternately, recent work by Li & Bryan [22] finds that condensation occurs when is between 3 and 10. There, condensation is stimulated by interactions between the ICM and an AGN jet. The jet entrains cold gas from near the SMBH, pushing it to less dense regions. The clump’s positive radial velocity prevents it from returning to an equilibrium position, and the gas rapidly cools. Finally, observations by Voit & Donahue [54] find that the minimum value of in clusters with multiphase gas in the form of H nebulae generally lies between 5 and 30.
In this paper, we use idealized 2D and 3D hydrodynamic simulations to study how the onset of condensation depends on the ratio of cooling time to freefall time and why there appears to be a change in cluster core properties around a ratio of 10. Section II presents simulations based on McCourt et al. [27] in which we explore a wider range of initial conditions. Section III analyzes how thermal instabilities grow in these simulations and investigate how that growth depends on the initial conditions. Section IV relates this work to previous theoretical work and discusses the validity of these results in the context of real galaxy clusters. Section V concludes by discussing how future work along these lines may clarify how AGN feedback solves the cooling flow problem in galaxy clusters.
II. Method
In this study, we consider simulations of idealized cluster cores with planar, cylindrical, and spherical geometries in 2 and 3 dimensions. The simulations were carried out using the AMR Hydrodynamics code Enzo22 2 http://enzo-project.org/ [6]. Unless otherwise noted, 2D runs were conducted on a 300x300 cell grid with no adaptive mesh, and 3D runs employed a cell root grid with 2 layers of adaptive mesh, with refinement based on overdensity, density gradient, and cooling time. We do not include magnetic fields, conduction, or the self gravity of the gas. The simulations were analyzed using the yt33 3 http://yt-project.org/ analysis toolkit [51].
II.1. Problem Setup
We set up the gas in our simulations subject to the constraint of hydrostatic equilibrium (HSE) and an ‘iso-cooling’ initial condition, under which the ratio is uniform throughout the volume. Additionally, we run a number of simulations using an isothermal initial condition instead of the iso-cooling one.
The setup described in this section applies to all geometries, as long as the definition of the height coordinate changes accordingly. In planar geometries, is the distance from the midplane, in cylindrical geometries it is the distance from the axis of symmetry, and in spherical geometries it is the distance from the origin. We choose a scale height of kpc (roughly corresponding to a large cluster), a box size of , a scale temperature of K, and a gravitational acceleration scale
| (1) |
so that the gravitational potential energy and thermal energy are of similar magnitude at the scale height . The cooling time is given by
| (2) |
where is the thermal energy per unit volume and the form of the cooling function is taken from Sarazin & White [43] for gas of half-solar metallicity.
The standard normalization of is used for gas with an iso-cooling initial condition of , and we obtain initial conditions corresponding to other initial values of by adjusting the normalization of while keeping the gas density and temperature profiles fixed. Two time scales characterizing the initial conditions will be useful in our analysis of the onset of thermal instability. One is the cooling time at one scale height () at the beginning of the simulation. The other is the freefall time at one scale height, , which stays constant throughout the simulation.
In general, the freefall time of the gas at height is
| (3) |
where the gravitational acceleration defining the potential well is
| (4) |
for and is directed toward either the midplane, the symmetry axis, or the origin, depending on the geometry of the potential. The relative constancy of away from the origin is meant to mimic the inner region of a spherical gravitational potential in which the mass density is proportional to . For , the function ensures continuity of the potential, while the parameter allows adjustment of its cuspiness. In cylindrical and spherical geometries, the magnitude of for decreases smoothly decreases smoothly with increasing radius to avoid strong acceleration near the boundaries. We restrict our analysis to the region . The simulations we present here use , which results in a relatively smooth potential with a gradual softening near the midplane.
Following the work of McCourt et al. [27], we implement a heating rate that exactly balances the average cooling rate at each height. To do this, we sum the total amount of cooling in each bin of , divide by the total volume of the bin, and change the sign to get the volumetric heating rate at height . While clearly idealized, this heating prescription ensures that the gas remains in overall thermal balance, in agreement with the observed thermal behavior of clusters. The validity of this prescription is discussed in Section IV.3.
For iso-cooling initial conditions, the initial temperature at is . Equations 2 and 3 relate density to temperature via
| (5) |
and the HSE condition for an ideal gas is
| (6) |
Combining these two expressions gives the temperature derivative for iso-cooling initial conditions in the form of an ODE:
| (7) |
We integrate this equation to find and determine the density from the iso-cooling condition. For cylindrical and planar simulations, gas outside of is taken to be isothermal and in HSE, with .
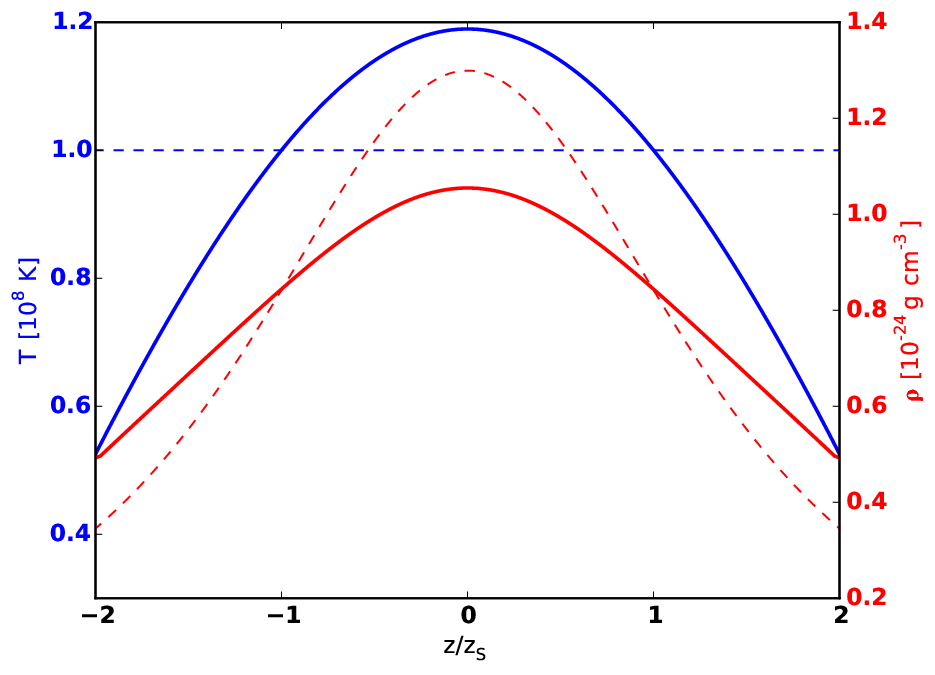
The resulting density and temperature profiles are shown in Figure 1. We impose a temperature floor at K, as we assume that gas below that temperature inevitably cools rapidly to much lower temperature. The details of the gas flow below that temperature occur at finer resolutions than are employed in our models, and do not affect the overall condensation rate. Finally, we add randomly generated isobaric perturbations to the gas with an RMS overdensity of 0.01 and a flat spectrum with wave numbers between 2 and 20 (with k=1 corresponding to the box size). The same realization of perturbations is used across all simulations to ensure consistency. As the gas quickly settles into a convective state, the details of the initial perturbations are soon forgotten.
Figure 1 also shows a comparison between the iso-cooling and isothermal setups. In both setups, the initial density and temperature profiles do not vary by more than a factor of 4 throughout the volume. The density is more sharply peaked in the isothermal case, leading to a shorter cooling time in the center. Consequently, the growth of thermal instabilities in the isothermal case is more dependent on height and the initial conditions than in the iso-cooling setup.

III. Results: The Growth of Thermal Instabilities
III.1. Validation of Method
We begin by conducting simulations with initial conditions similar to those in McCourt et al. [27] to check if our model produces qualitatively similar results. Our setup differs from theirs in a number of minor details, including the shape of the gravitational profile (ours is less cuspy near the midplane) and the form of the cooling function . More importantly, the region near the midplane does not receive special treatment in our simulations, whereas McCourt et al. [27] shut off heating and cooling in this region and exclude the midplane region from analysis. In spite of these differences, we obtain qualitatively similar results in the regime . We see close agreement for the isothermal setup for higher ratios, and somewhat more condensation is seen for the iso-cooling case for .
Figure 2 shows slices of density in 2D Cartesian simulations with similar initial conditions to those explored by McCourt et al. [27]. The top row of Figure 2 uses isothermal initial conditions determined by the initial value of at one scale height. In comparison, the simulations in the bottom row use the iso-cooling initial conditions described in Section II for which is initially constant throughout the simulation volume. The overall behavior is qualitatively similar in both cases and resembles the results obtained by McCourt et al. [27] outside of the midplane region. When the ratio of timescales is below unity, the gas cools in place and forms droplets of condensate that rain down towards the midplane. In these cases, convection does not hinder thermal instability because the gas is able to adjust its thermal state faster than it is able to convect. As the ratio of timescales is increased, the dynamics of the gas become increasingly dominated by convection, although gas continues to condense around the midplane.
While each vertical pair of models illustrated in Figure 2 behaves similarly, a number of minor differences can be observed. Principally, condensation occurs more uniformly for iso-cooling initial conditions than for isothermal ones. This result arises from the differing density profiles needed to satisfy the HSE constraint—isothermal initial conditions have a steeper gas-density gradient and consequently a larger range in cooling time across the simulation domain. Shorter cooling times near the midplane lead to a ‘cross talk’ effect that is more pronounced for isothermal initial conditions. Condensation of gas near the midplane causes hot, low-density bubbles to form there and to rise to greater altitudes, creating inhomogeneity at those altitudes on a freefall time scale instead of a cooling time scale. This cross talk between lower and upper layers complicates the task of interpreting how thermal instability and condensation depend on the choice of initial timescale ratio at one scale height. The ‘iso-cooling’ condition, while not necessarily more physically valid, reduces this cross talk and allows for clearer interpretation of the relationship between the initial timescale ratio and the onset of condensation. In contrast, dense midplane gas in models with isothermal initial conditions is able to condense quickly even when the initial ratio of timescales at one scale height is large. This happens because the gas near the midplane will have a lower ratio of , leading to localized condensation.
III.2. Instability Growth in the Strong Cooling Regime
Using the iso-cooling simulations presented in the previous section, we have examined the evolution of perturbations for the case in which rapid cooling dominates the dynamics of the gas. If perturbations are able to cool and collapse more rapidly than they can sink, condensation proceeds on a time scale . When global thermal balance is maintained, the average of the ambient gas quickly increases as condensation lowers the gas mass and density of the ambient medium. Within a few cooling times, rises to , as shown in Figure 3. In this strong-cooling regime, the onset of condensation is determined by the growth of the initial perturbations and does not depend strongly on the initial ratio of . Condensation continues unabated until the timescale ratio is above 10, at which point the cooling is weak enough that the condensation rate slows.

III.3. Instability Growth in the Convective Regime
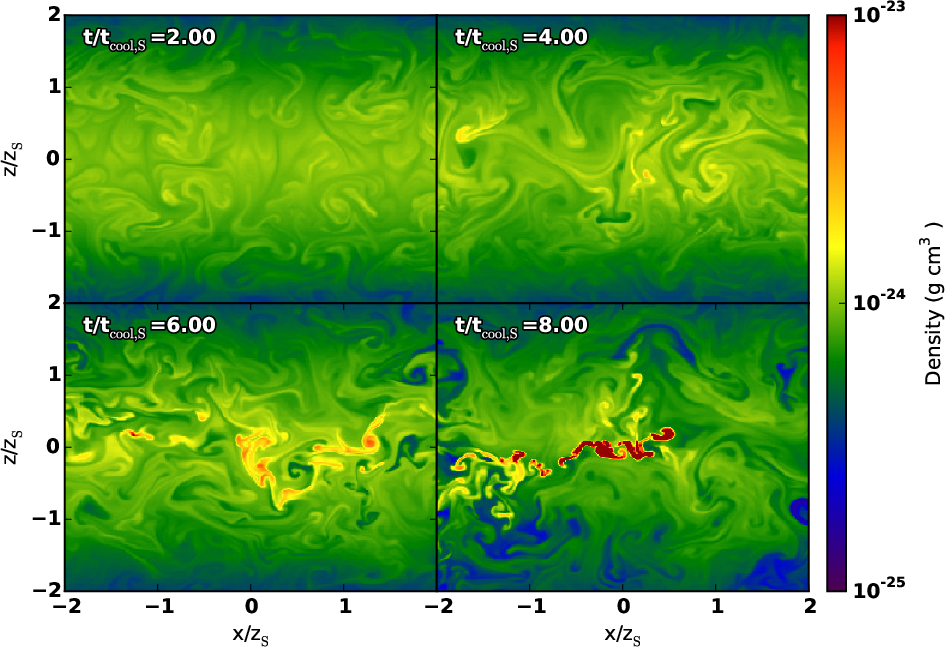
When the initial ratio of is large, incipient condensing regions sink into the gravitational potential faster than they can cool, leading to a roiling, convective state. The convection is subsonic, and although the pressure remains nearly constant at a given height, convection does not prevent the temperature and density perturbations generated by cooling from growing. Figure 4 illustrates the growth of perturbations in a medium with an initial timescale ratio of . After 2 cooling times (1 cooling time = 585 Myr), the gas is convecting. After 4 cooling times, the gas continues to convect, but the density perturbations have increased. After 6 cooling times, convection can no longer suppress condensation of gas near the midplane, and it cools catastrophically. After 8 cooling times, a significant amount of the dense gas has condensed.
It is thus clear that the condensation does not simply switch on when the average ratio of cooling time to the dynamical time drops below some special value. To quantify the transition of the gas from a relatively smooth, convective state to a multiphase medium, we plot in Figure 5 the probability distribution function of the thermal state of the gas as the run with initial evolves. After several cooling times the distribution of gas in the –() plane has widened considerably. After 4 cooling times, gas in the tail of the distribution has reached a ratio of around 3. At this point, further perturbation growth is inevitable and condensation begins.

Increasing the initial timescale ratio to slows the condensation process and further restricts it to the midplane region, as shown in Figure 6. Condensation follows the same general pattern as in Figure 5, except that it is delayed for more than 10 times the initial cooling time and is much more pronounced near the midplane. The concentration toward the midplane occurs because cooling gas blobs can settle over a larger number of freefall times and preferentially accumulate in the midplane before condensing.

In all of our simulations, which have iso-cooling initial conditions up to , condensation eventually occurs as long as it is given enough time to develop. Figure 7 shows how both the average and minimum values of evolve during each run. Condensation in the runs with large values of may be surprising in light of recent theoretical studies predicting that the medium should become multiphase only if [46, 20, 48], and we will discuss possible explanations for this difference in Section IV.


Figure 8 shows the same simulations as Figure 7 plotted with time in units of the freefall time at one scale height rather than the initial cooling time. As all simulations use the same gravitational potential, the freefall time is a standard clock and corresponds to the same time interval in physical units (approximately 117 million years). When the initial ratio of cooling time to freefall time exceeds , condensation occurs after freefall times, corresponding to a timescale comparable to the Hubble time.
III.4. Transition to the Condensed State
While studying the growth of thermal instabilities gives insight into the conditions under which gas will condense, it does not necessarily explain how the gas reaches a condensed state or how an individual parcel of gas behaves. Figure 9 depicts the gas distribution in the plane integrated over 30 cooling times. To compute this distribution, we bin gas mass in space in each data output (which are evenly spaced in time), sum over all of the outputs, and normalize so that the integral over the distribution is equal to 1. This probability distribution corresponds to the probability of a parcel of gas being found in a given thermodynamic state at some point during the simulation. The gas is for the most part constrained to a line of constant pressure with spread due to gravitational stratification. The distribution has two peaks; a low density, high temperature node in which the gas is convecting, and a cool, low temperature node representing the condensed state of the gas. The probability of finding gas in the connecting region is low, indicating that condensation from the hot phase into the cold phase proceeds rapidly once it begins.
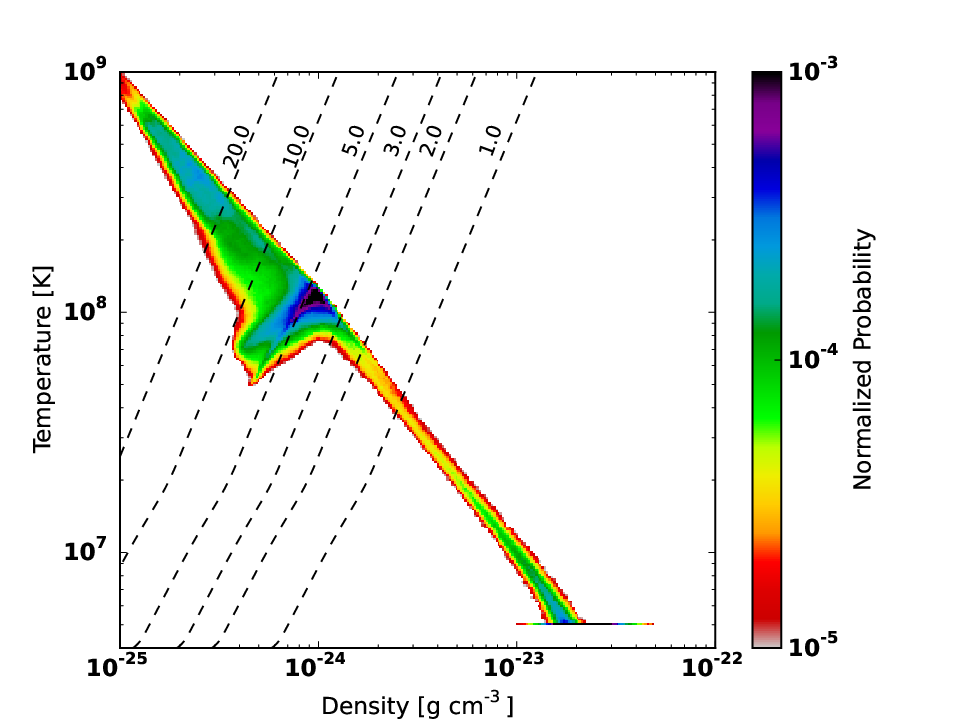
Figure 10 illustrates the dynamics of the gas during the convective stage and the condensation process using the motion of a Lagrangian tracer particle in phase space. The figure shows the path of a representative particle which condenses early in the simulation. For several cooling times, the gas simply convects within a narrow portion of phase space. As the thermal perturbations are amplified, the gas is driven to a colder, denser state which is where condensation occurs. When the gas does condense, the condensation process is very rapid, and the gas stays in the condensed phase afterwards.

III.5. Condensation Rate

In our simulations, condensed gas remains in the condensed state and settles towards the center. After the onset of condensation the gas segregates into two phases - the cool condensed material in the center and the hot, convective gas that remains uncondensed. This departure from the expectation of self-regulation is a consequence of our feedback implementation and is discussed further in Section IV.4. Still, it is instructive to examine the rate of condensation in our simulations, as is shown in Figure 11. Following the onset of condensation, instabilities continue to grow on the cooling timescale. Each simulation behaves similarly on a thermal timescale, with a roughly linear growth in the total condensed fraction.
III.6. Effect of Geometry
Simulations with different geometries are shown in Figure 12. All simulations use the same initial conditions (). In the spherical case, gravity pulls towards the origin, while in the cylindrical setups gravity pulls towards the symmetry axis. All simulations exhibit similar thermal behavior. After 10 cooling times, the gas has entered into a convective state and condensation has begun near the center of the potential. In the non-planar runs, less gas condenses as the region near the center occupies less volume. Nevertheless, we do not observe a significant change in the condensation process among simulations with different geometries.

IV. Discussion and Relationship to Related Work
Our simulations would seem to indicate that any medium subject to a heating/cooling balance as we have described in our model will eventually succumb to thermal instability and produce condensation. Nevertheless, observations seem to indicate that clusters with time scale ratios above roughly 10 do not produce much multiphase gas. To explain this discrepancy, we note that at a radius of around 30 kpc, a time scale ratio of 10 in a large galaxy cluster corresponds to a cooling time on the order of a Gyr. Physical processes such as mergers, star formation, and AGN feedback occur on shorter timescales, rendering the condensation process sub-dominant in these cases. Therefore, in a realistic cluster environment only clusters with a cooling time to freefall time ratio of are likely to develop condensation. An important caveat to this observation is that while the growth of thermal instabilities from initially small perturbations may be unimportant on cluster timescales, if the gas is inhomogeneous due to other physical processes (such as an AGN jet) condensation may occur in the tail of the thermal distributions shown in Figure 5 and 6. Thus, predicting the onset of condensation is not as simple as measuring the value of ; the level of inhomogeneity must also be taken into account.
Our simulations examine the formation of multiphase gas in an idealized setting wherein global balance between heating and cooling is strictly enforced. While this model gives rise to results that are qualitatively consistent with observations, it clearly neglects the complex physics of AGN feedback and heat transport which occur in real clusters. In this section, we discuss our results in light of current observations of multiphase gas and previous simulations of condensation and consider the complications that inclusion of additional physical processes would cause.
IV.1. Observations of Multiphase Gas
Owing to the timescales involved and the limits of current telescopes, astronomers can not directly observe the condensation process in the ICM. Nevertheless, the past decade has deepened the field’s appreciation of a fascinating dichotomy in cluster properties when cluster cores are probed for cold gas and signatures of AGN feedback. While cooling is generally suppressed in cool-core galaxy clusters [37, 36], at least some cold gas is observed in galaxies with low central temperatures, as seen in the works of McDonald et al. [28] and Werner et al. [57]. Cavagnolo et al. [9] considers the entropy profiles, radio emissions, and presence of H in the ACCEPT sample of 222 galaxy clusters. As H emission requires the presence of cold (relative to the ICM) gas, the presence or absence of H in a cluster may be taken as an indicator of multiphase gas. In the clusters with H observations, H is conclusively detected in slightly over half of the sample. A strong correlation is seen between the presence of H and the core entropy; clusters with H have central entropies below 30 keV cm2, while those without H detections tend to lie above the 30 KeV line. When the entropy profile is used to infer a cooling time, [54, 55, as in] a central entropy of 30 KeV corresponds to a cooling time of around 1 billion years, consistent with a cooling time to freefall time ratio of around 10. In clusters in the ACCEPT sample, those with detected H emission consistently have values below , while those without H detections lie entirely above that value.
IV.2. Simulations of Multiphase Gas
McCourt et al. [27], upon which this study is based, finds that precipitation will occur rapidly if the gas is able to cool in place, which occurs when . The authors also conclude that the condensation process is relatively insensitive to variations in the heating rate and mechanism. Employing a similar method, Sharma et al. [46] finds that condensation may occur in gas with a timescale ratio of in a spherical simulation, an enhancement they attribute to the compression of overdense blobs descending in a spherical geometry. Additionally, Sharma et al. [46] concludes that condensation does not occur when the timescale ratio rises above 10.
Analytic work has lent further credence to the idea that represents a critical threshold for condensation. Singh & Sharma [48], extending the analysis of Pizzolato & Soker [38], finds that small instabilities may grow when for planar geometries and, when the effects of geometric compression are included, may grow for for spherical geometries. While the results presented in Section III of this paper suggest a moderately higher threshold for the planar case, we believe that these results are largely consistent with Singh & Sharma [48] in the context of individual overdensities cooling and condensing in place. In our simulations, however, we see that overdensities in a medium above the critical threshold oscillate, leading to a roiling state that develops further perturbations. This cross talk effect between layers generates non-linear perturbations and causes the temperature dispersion in the medium to grow on the cooling timescale. When the cold tail of the distribution has dropped to the condensation process begins. Thus we find that the mechanism responsible for condensation above the critical threshold is not geometric compression but the continued growth of perturbations following the onset of convection in the gas.
Simulations that employ more realistic heating mechanisms also find that condensation occurs in galaxy clusters, albeit under somewhat different circumstances than in simulations with idealized heating. Li & Bryan [22] employ an AGN feedback algorithm in which heating is triggered by cold gas accretion. The study finds that condensation occurs when . This condensation occurs along the axis of the jet, where dense gas is dragged up and is able to cool as it falls. This is consistent with our findings, in which the thermal instability can grow when , but only when gas is sufficiently hetrogeneous. Similarly, Gaspari et al. [20] employs jet heating in response to accretion and finds that multiphase gas can form when .
IV.3. Caveats and Limitations
In this study, we have used an idealized model to simulate the onset of condensation in galaxy clusters. While the simplicity makes this model easy to analyze, we have left out physics that may have significant impact on the development of a multiphase medium. In particular, conduction and the presence of magnetic fields may inhibit or shape the growth of condensation. Conduction works to smooth out temperature perturbations, while magnetic fields will lead to conduction being anisotropic.
Magnetic fields in clusters are poorly understood. While weak, they are known to be present and may be dynamically important in cluster cores (Carilli & Taylor [8] and references therein). More important for this work, magnetic fields in a plasma will lead to anisotropic conduction, channeling heat along the direction of magnetic field lines as explored in Ruszkowski et al. [41]. Similarly, Wagh et al. [56] studies the growth of thermal instabilities in a spherical setup and includes both conduction and magnetic fields. Anisotropic conduction is not found to inhibit condensation, but does lead to the formation of filaments rather than globules of dense gas. Conduction is found to inhibit condensation if the efficiency is above 0.3 of the Spitzer value.
In addition to these omissions, our assumed heating function does not capture the true physical process responsible for transferring energy from the AGN to the ICM. While the details of AGN heat transfer are not currently understood, several mechanisms have been proposed, including shocks [31, 40], cosmic rays [47, 16, 17, 18], turbulent mixing [44, 3], PdV work from the inflation of hot bubbles [30, 4], and the uplifting of cool gas by rising bubbles [32]. The actual heating function is unlikely to maintain perfect thermal balance, and presumably does not act in a strictly volumetric sense as assumed in this work. Still, the lack of cold gas and star formation in cool-core clusters implies that the heating function must broadly maintain thermal equilibrium, making the model considered in this work physically relevant.
IV.4. Self-Regulation
The gas does not reach a steady state, as might be expected for an ideal self-regulating system. Instead, condensation continues in the convective gas after the condensation process has begun, increasing the separation between the hot and cold phases. In real clusters, feedback is expected to operate in a thermostat-like manner, which should produce a rough thermal equilibrium. The lack of self-regulation in our simulations is purely an effect of the heating model that we employ, and does not accurately capture the response of feedback to condensation. However, if we imagine feedback to be powered by condensation, we can use the calculated heating rate to determine what feedback efficiency would be necessary for the system to balance radiative losses.
During accretion, AGN are expected to convert a significant fraction of the infalling mass into energy that is then returned to the surrounding medium. The feedback rate can be related to the mass accretion via
| (8) |
where is the total energy output, is an efficiency parameter, and is the mass accretion rate. Under the assumptions that all of the condensing gas is used to power feedback and that all of the feedback energy is transferred to the ICM, we have estimated the conversion efficiency necessary to maintain thermal balance. The estimate is shown in Figure 13 for several initial values of . Once condensation has begun, the required efficiency in all runs reaches a value of around , in line with the values found in Sharma et al. [46]. As the accumulation of cold gas near the midplane is an artifact of our setup and would not be expected in a real cluster, we calculate the cooling rate over the ambient gas, which is that gas that is above the temperature floor of K. Although we do not explore the mechanism for releasing mass-energy from condensed gas in this work, if condensation resulting from the growth of thermal perturbations is in principle capable of balancing radiative cooling in the ICM, thermal instability must be taken seriously as a feature of a self-regulating energy cycle in cool-core clusters.

V. Conclusions and Future Work
In this study, we have investigated the onset of convection in a thermally unstable medium using an idealized model, including a heating scheme that strictly enforces a global heating-cooling balance. Although a simplification, this model gives insight into the conditions necessary for the onset of condensation in a gravitationally stratified medium such as that in a cool-core galaxy cluster. This study indicates that condensation proceeds as follows:
- •
If heating is able to balance cooling at all radii, thermal instabilities will grow in amplitude, regardless of the initial conditions.
- •
If the ratio of the cooling to the freefall time is , (the strong cooling regime) the gas will condense in place, driving the volume-averaged value above 10.
- •
Above a ratio of , perturbations will grow on a timescale proportional to the cooling time.
- •
Once the perturbation distribution has broadened, gas with will condense, even if the volume-averaged ratio of is above 10.
- •
If the timescale ratio is , the timescale for condensation to occur in gas with Gyr is comparable to the Hubble Time and greatly exceeds other relevant cluster timescales.
A fundamental limitation of this work is that the model assumes a heating function that is idealized and does not mimic a specific physical process. In preparation for future work, it will be necessary to examine a greater variety of heating modes, including models more analogous to jet feedback and quasar winds from accreting supermassive black holes. The physical processes underlying black hole accretion, feedback, and heat transfer to the ICM are still poorly understood, and elucidating them will form the focus of future studies.
VI. Acknowledgments
The authors would like to thank Gus Evrard, Devin Silvia, Greg Bryan, and Yuan Li for helpful discussions during the preparation of this paper. This work was supported by NASA through grant NNX12AC98G and Hubble Theory Grant HST-AR-13261.01-A, and by the National Science Foundation through grant PHY-0941373. The simulations presented in this paper were performed and analyzed on the TACC Stampede supercomputer under XSEDE allocations TG-AST090040 and TG-AST100004. This work was supported in part by Michigan State University through computational resources provided by the Institute for Cyber-Enabled Research. BWO was supported in part by the sabbatical visitor program at the Michigan Institute for Research in Astrophysics (MIRA) at the University of Michigan in Ann Arbor, and gratefully acknowledges their hospitality. Enzo and yt are developed by a large number of independent researchers from numerous institutions around the world. Their commitment to open science has helped make this work possible.
References
- [1] Balbus, S. A. 1988, ApJ, 328, 395
- [2] Balbus, S. A., & Soker, N. 1989, ApJ, 341, 611
- [3] Banerjee, N., & Sharma, P. 2014, MNRAS, 443, 687
- [4] Bîrzan, L., Rafferty, D. A., McNamara, B. R., Wise, M. W., & Nulsen, P. E. J. 2004, ApJ, 607, 800
- [5] Bondi, H. 1952, MNRAS, 112, 195
- [6] Bryan, G. L., Norman, M. L., O’Shea, B. W., et al. 2014, ApJS, 211, 19
- [7] Burns, J. O., Hallman, E. J., Gantner, B., Motl, P. M., & Norman, M. L. 2008, ApJ, 675, 1125
- [8] Carilli, C. L., & Taylor, G. B. 2002, ARA&A, 40, 319
- [9] Cavagnolo, K. W., Donahue, M., Voit, G. M., & Sun, M. 2008, ApJ, 683, L107
- [10] Churazov, E., Sunyaev, R., Forman, W., & Böhringer, H. 2002, MNRAS, 332, 729
- [11] Cowie, L. L., Fabian, A. C., & Nulsen, P. E. J. 1980, MNRAS, 191, 399
- [12] Defouw, R. J. 1970, ApJ, 160, 659
- [13] Dunn, R. J. H., & Fabian, A. C. 2006, MNRAS, 373, 959
- [14] Fabian, A. C. 1994, Anual Reviews of Astronomy and Astrophysics, 32, 277
- [15] Field, G. B. 1965, ApJ, 142, 531
- [16] Fujita, Y., Kimura, S., & Ohira, Y. 2013, MNRAS, 432, 1434
- [17] Fujita, Y., & Ohira, Y. 2011, ApJ, 738, 182
- [18] —. 2012, ApJ, 746, 53
- [19] Gaspari, M., Brighenti, F., & Temi, P. 2012a, MNRAS, 424, 190
- [20] Gaspari, M., Ruszkowski, M., & Sharma, P. 2012b, ApJ, 746, 94
- [21] Kim, W.-T., El-Zant, A. A., & Kamionkowski, M. 2005, ApJ, 632, 157
- [22] Li, Y., & Bryan, G. L. 2014, ApJ, 789, 153
- [23] Loewenstein, M. 1990, ApJ, 349, 471
- [24] Malagoli, A., Rosner, R., & Bodo, G. 1987, ApJ, 319, 632
- [25] Malagoli, A., Rosner, R., & Fryxell, B. 1990, MNRAS, 247, 367
- [26] Markevitch, M., & Vikhlinin, A. 2007, Phys. Rep., 443, 1
- [27] McCourt, M., Sharma, P., Quataert, E., & Parrish, I. J. 2012, MNRAS, 419, 3319
- [28] McDonald, M., Veilleux, S., Rupke, D. S. N., & Mushotzky, R. 2010, ApJ, 721, 1262
- [29] McDonald, M., Veilleux, S., Rupke, D. S. N., Mushotzky, R., & Reynolds, C. 2011, ApJ, 734, 95
- [30] McNamara, B. R., & Nulsen, P. E. J. 2007, ARA&A, 45, 117
- [31] —. 2012, New Journal of Physics, 14, 055023
- [32] Million, E. T., Werner, N., Simionescu, A., et al. 2010, MNRAS, 407, 2046
- [33] Nagai, D., Kravtsov, A. V., & Vikhlinin, A. 2007, ApJ, 668, 1
- [34] Nulsen, P. E. J. 1986, MNRAS, 221, 377
- [35] O’Dea, K. P., Quillen, A. C., O’Dea, C. P., et al. 2010, ApJ, 719, 1619
- [36] Peterson, J. R., & Fabian, A. C. 2006, Phys. Rep., 427, 1
- [37] Peterson, J. R., Kahn, S. M., Paerels, F. B. S., et al. 2003, ApJ, 590, 207
- [38] Pizzolato, F., & Soker, N. 2005, ApJ, 632, 821
- [39] Rafferty, D. A., McNamara, B. R., & Nulsen, P. E. J. 2008, ApJ, 687, 899
- [40] Ruszkowski, M., Brüggen, M., & Begelman, M. C. 2004, ApJ, 611, 158
- [41] Ruszkowski, M., Lee, D., Brüggen, M., Parrish, I., & Oh, S. P. 2011, ApJ, 740, 81
- [42] Ruszkowski, M., & Oh, S. P. 2011, MNRAS, 414, 1493
- [43] Sarazin, C. L., & White, III, R. E. 1987, ApJ, 320, 32
- [44] Sharma, P., Chandran, B. D. G., Quataert, E., & Parrish, I. J. 2009, ApJ, 699, 348
- [45] Sharma, P., McCourt, M., Parrish, I. J., & Quataert, E. 2012a, MNRAS, 427, 1219
- [46] Sharma, P., McCourt, M., Quataert, E., & Parrish, I. J. 2012b, MNRAS, 420, 3174
- [47] Sharma, P., Parrish, I. J., & Quataert, E. 2010, ApJ, 720, 652
- [48] Singh, A., & Sharma, P. 2015, MNRAS, 446, 1895
- [49] Skory, S., Hallman, E., Burns, J. O., et al. 2013, ApJ, 763, 38
- [50] Smith, B., O’Shea, B. W., Voit, G. M., Ventimiglia, D., & Skillman, S. W. 2013, ApJ, 778, 152
- [51] Turk, M. J., Smith, B. D., Oishi, J. S., et al. 2011, ApJS, 192, 9
- [52] Valdarnini, R. 2006, New A, 12, 71
- [53] Voigt, L. M., Schmidt, R. W., Fabian, A. C., Allen, S. W., & Johnstone, R. M. 2002, MNRAS, 335, L7
- [54] Voit, G. M., & Donahue, M. 2015, ApJ, 799, L1
- [55] Voit, G. M., Donahue, M., Bryan, G. L., & McDonald, M. 2014, ArXiv e-prints, arXiv:1409.1598 Nature, in Press
- [56] Wagh, B., Sharma, P., & McCourt, M. 2014, MNRAS, 439, 2822
- [57] Werner, N., Simionescu, A., Million, E. T., et al. 2010, MNRAS, 407, 2063
- [58] Zakamska, N. L., & Narayan, R. 2003, ApJ, 582, 162
- [59] ZuHone, J. A., Markevitch, M., & Johnson, R. E. 2010, ApJ, 717, 908