Sign Structure of Susceptibilities of Conserved Charges in the Polyakov Quark Meson Model
Abstract
The sign structure of correlations of conserved charges are investigated in a QCD like
model: the flavor Polyakov Quark Meson model. We compute all
susceptibilities of the conserved charges on the plane up to
fourth order and a few at higher order as well. By varying the mass of the sigma meson,
we are able to study and compare scenarios with as well as without a critical point.
In the hadron-quark transition regime we identify certain
correlations that turn negative unlike expectation from ideal hadron resonance gas
calculations. The striking feature being that these remain negative deep into the hadronic side and thus could be measured in experiments. Measurement of such quantities in heavy ion collision
experiments can elucidate the location of the QCD transition curve and possibly the critical point.
PACS numbers: 12.38Mh, 25.75.Nq, 12.38.Gc
The phase diagram of Quantum Chromodynamics (QCD), the theory of strongly interacting matter, has been a subject of intense study both theoretically and experimentally for some time now. The thermodynamic state of the strongly interacting medium which is expected to be created in a heavy ion collision (HIC) experiment can be specified by four quantities: temperature and three chemical potentials corresponding to the conserved charges baryon number , electric charge and strangeness , namely , and respectively. The QCD degrees of freedom are sensitive to these thermodynamic quantities resulting in a rich phase diagram [1, 2]. At zero chemical potentials , first principle Lattice QCD (LQCD) Monte-Carlo simulations have shown that QCD undergoes a smooth analytic crossover transition from the low hadron resonance gas (HRG) phase to the high phase of quarks and gluons (QGP) [3, 4]. At non zero but small , recent LQCD results [5, 6] show similar behavior.
However, the QCD phase diagram for is far from established. Direct first principle techniques of LQCD using Monte-Carlo methods fail due to the sign problem [7, 8]. This is where QCD like models which have been tuned to reproduce LQCD results at zero could provide valuable insight about the nature of the QCD medium [9, 10, 11, 12, 13, 14, 15, 16, 17, 18]. Model computations at large predict the possibility of a first order phase transition [9, 10, 11, 12, 13, 14, 15, 16, 17, 18]. Thus the location of the critical point (CP) which is the end point of this first order transition line where there is a second order phase transition is an important landmark on the QCD phase diagram. Mapping the phase transition line and the CP is a major goal of the heavy ion collision experiments [19].
The CP dynamics gives rise to diverging correlation length that result in non-monotonic variations of some quantities which have been proposed as plausible observables to identify the CP [20]. For example, moments of conserved charges that can be extracted experimentally through event by event analyses are good candidates to hunt for the CP [21, 22]. At zero , with three flavors of quarks there are numerous computations of the susceptibilities both on the lattice [23, 24, 25, 26] as well as in models [27, 28, 29, 30, 31, 31, 32, 33]. Recently, for non-zero but small , susceptibilities have been computed on the lattice [34, 35, 36]. Some of these cumulants have also been computed on the plane in models [29, 37].
Such observables are good markers of the CP, as long as they are measured close to the CP, the location of which is unknown. Further, in HIC experiments, the produced fireball has finite size and lifetime which can tame the divergence of the correlation length and render it finite. This will blur the effects of singularity in the critical region and hence diminish the chances of a direct experimental confirmation of the CP [38, 39, 40]. Thus, rather than looking at the absolute values of the susceptibilities, sign structures of the same might be better suited for such studies [40]. Third moments of conserved charges like , and energy have been already studied in this regard [40]. These were found to change sign at the hadron-quark phase boundary corresponding to peak like structures of second order susceptibilities. Studies based on the Polyakov Quark Meson (PQM) model show that higher order cumulants of and become negative valued in the transition regime [41, 42]. It has been suggested that such distinctive sign structures follow from the scaling functions of the 3-D universality class [42]. Higher order generalized susceptibilities for and their sign structure in the phase diagram was studied in the PQM model [37]. For all the above cases, the negative regions were found very close to the phase boundary and mostly on the QGP side. It is interesting to note that LQCD computations along the chemical freeze-out curve as determined from HRG analysis of yields show that the kurtosis of exhibits a change of sign around GeV [43]. This has been attributed to proximity to the CP [43]. Such sign structures of susceptibilities due to the quark-hadron transition regime and the CP can be observed if the chemical freeze-out (CFO) curve also passes very close to the phase boundary or the dynamics is such that the sign structures are retained during expansion between the phase boundary and the CFO curve. However, observation of negative baryonic kurtosis has remained elusive so far in the Beam Energy Scan (BES) program at RHIC [44]. This motivates us to investigate the sign structures of the off-diagonal components of the correlations of conserved charges which has so far been ignored. In this paper we work with the flavor PQM model at the mean field level and analyze the sign structures of the cumulants of conserved charges on the plane with and without CP. We do not find any unique sign structure that could be attributed to the presence of the CP alone. On the other hand, there are a few candidates, as summarized in Table 2, that are sensitive to the crossover/transition region whether or not there is a CP and show a change of sign. Thus these observables are good indicators of the transition regime. Some of these off-diagonal susceptibilities were found to exhibit negative regions that extend deep into the hadronic side and hence could be more easily accessible to experiments.
The rest of this paper is organized as follows: In Section I, we provide the details of the PQM model and its parameters used in this study. We further define the susceptibilities that are studied here and their connections with the corresponding moments of the conserved charges that are experimentally measurable. In Section II, we first compare our model computations with those of lattice at non-zero but small . We compare, with lattice, some cumulants as well as the values of the strangeness chemical potential obtained by imposing the strangeness neutrality condition. We then present our results on various cumulants on the plane and comment on their usefulness in mapping out the QCD phase diagram, namely identifying the transition regime and the location of the CP. Finally, in Section III, we summarize and conclude.
I Formalism
The relevant thermodynamic potential in the flavor PQM with the inclusion of the vacuum term at a temperature and chemical potentials , and in the mean field approximation is given in Refs. [45, 46]. The pressure is given by
| (1) |
The cumulants of the conserved charges are computed by taking appropriate derivatives of
| (2) |
These generalized susceptibilities are related to the moments of the distribution of the conserved charges such as the mean , variance , skewness etc. The derivatives in eq. (2) have been computed numerically using the package ADOL-C [47, 48] which allows efficient computation of higher order susceptibilities without further truncation errors.
When relating to heavy ion collision experiments, there are two constraints to be met. Since the number of participating nucleons is not fixed a priori, the net baryon number or electric charge can not be fixed independently. But, the ratio of to can be fixed to that of the initial heavy ion used in the experiment (). Since the incoming heavy ions carry zero net strangeness , the condition of vanishing also has to be imposed.
| (3) | |||||
| (4) |
Eqs. (3) and (4) fix and respectively. In this work we will mainly present our results for 3 different variants of the flavor PQM model: msig400, msig400-phys and msig600. These differ from each other on the choice of the mass of the sigma meson and also the way we treat and . We have used MeV for msig400 and msig400-phys while for msig600 we put MeV. While msig400 and msig400-phys possess a CP on the plane, msig600 has no CP on the phase diagram [45]. Thus we are able to study and compare the effects of the CP on the sign structures. In order to understand the effects of non-zero and , for msig400 and msig600 we use and while for msig400-phys we use and as obtained from eqs. (3) and (4). In Table 1, we have listed the above scenarios with their descriptions for easy reference
II Results
In our earlier works [45, 46], we had shown good qualitative agreements between LQCD data and PQM model predictions at zero chemical potential for a large number of thermodynamic quantities like pressure, entropy density, energy density, specific heat, speed of sound etc., and also for some susceptibilities of conserved charges up to sixth order. LQCD data are now available also at non-zero but small and also for non-zero and satisfying Eqs. (3) and (4 ) [35, 36]. Before we present our model results for the susceptibilities on the entire plane, we perform a comparative study between LQCD and our model at small . Here we will particularly look at the extracted values of and few ratios of susceptibilities at non-zero .
II.1 : Model vs Lattice
For a realistic estimate of thermodynamic observables related to the QGP experiments, it is important that the computations are done for non-zero and obtained from the conditions as imposed by eqs. (3) and (4). We have implemented this and extracted the values of and for different and . In Fig. 1 we show normalized to for several values of MeV. We have compared these model values with the continuum estimates obtained in LQCD [49] and find good agreement. seems to have a monotonically increasing behavior with , with a faster rise around and finally saturates in the QGP phase to (shown by the thick black line in Fig. (1)). This limiting value can be understood easily in the context of a Stefan-Boltzmann (SB) gas of ideal quarks and gluons. In the SB limit, only the strange quarks which carry both and decide the value. Now in order to ensure that Eq. (3) is obeyed, the fugacity factors for strange and anti-strange quarks should be unity. Since strange quarks carry and while anti-strange quarks carry and , it turns out that in order to ensure , must be . We have ignored in this discussion since its value is much less than both and . Thus the SB limit is independent of and we see this also in the Fig. 1 where different curves all saturate to in the QGP side. On the contrary, in the low regime where the degrees of freedom are hadronic, is much more sensitive to . This is because in the hadronic regime unlike the ideal quark gluon gas, strangeness carriers can be both: baryonic (eg.) and non-baryonic or mesonic (eg. kaons). If we had a mesonic gas, will always be the solution of Eq. 3. Non-zero values of arise only because of the strange baryons. Since there is a large mass difference of the order of MeV between the lightest strange meson and baryon, depending on the relative contribution of the strange baryons differ from that of the strange mesons, rising monotonically with . This results in the monotonically increasing behavior of with for constant . Again, with increasing value of the strange baryon contribution increases and this results in a larger value of for same .
II.2 : Model vs Lattice
Recently, a lot of effort has been invested in computing susceptibilities at non-zero in LQCD in order to confront them with experimentally measured moments of , and [34, 35, 36]. Such a comparison will enable a determination of the CFO and , bridging the gap between LQCD and experiments. This is a complementary program to the already quite successful endeavor of determining the freeze-out conditions by comparing the hadron yields between experiments and hadron resonance gas models [50, 51, 52, 53]. In Refs. [35, 36], the variation of the ratio for , have been measured on the lattice. A comparison between theory and experiment of these ratios can provide an estimate of at CFO [35]. In Fig. 2 we have plotted these quantities as obtained in PQM and compared them with the HotQCD lattice data [35] as well as WB lattice data [36]. Both lattice as well as PQM show an almost linear variation of with in the range . The model over predicts the lattice data in the entire range. For example, at , the model is about more than the lattice. We should note that there is an uncertainty in the determination of adjusting which it is possible to get a better agreement between model and lattice. However, here our main intention in performing this comparison is to demonstrate the good qualitative agreement between LQCD and PQM model predictions. This gives us faith to trust the PQM results on the plane where there is yet to be any lattice data. Thus, having set the platform for a discussion of the PQM results at non-zero , we go into the next section where we report on the novel qualitative features of the sign structures of the generalized susceptibilities whose measurements in heavy ion collision experiments could shed light on the features of the QCD phase diagram.
II.3 Sign Structures of Susceptibilities: Model
Having found good qualitative agreement between PQM and LQCD at non-zero , we will now analyze the sign structures of various fluctuations and correlations of conserved charges on the plane. We shall focus mainly on the transition regime between the HRG and QGP phases. The transition region can be broadly classified into three categories: firstly for small there is a smooth crossover and no true phase transition. Secondly, for large enough , we expect a first order phase transition. Thirdly, in the intermediate range of , one thus expects a critical region with a second order phase transition at the CP where the line of first order phase transition meets the crossover line. The existence and location of this CP is a topic of intense current research. In PQM, the location of the CP is highly sensitive to the value of used. For example, with MeV one finds no CP [45]. In order to understand the distinguishing features of the QCD phase diagram with and without a CP and also the effect of non-zero and , we have computed the susceptibilities for three different variants of PQM as outlined in Table 1: msig400, msig400-phys and msig600. We will now report our findings on the sign structure of several susceptibilities up to sixth order in these different regions of the QCD phase diagram for the three cases.
Before we proceed, please note that all figures shown henceforth will be plots on the plane. In fact, since we are interested only in the qualitative features of negative correlations, we scale the axis (-axis) by (the cross-over temperature at ) and the axis (y-axis) by (the value where the first order phase transition line meets the axis). In all plots we show the smooth cross-over curve in blue dashed lines. The CP is denoted by a red dot whereas a black (thick) solid line denotes the first order phase transition line. Contours of various susceptibilities are shown with boxed numbers indicating the numerical value of the susceptibilities along those contours. Finally, regions of negative correlation are indicated by orange (shaded) regions.
II.3.1 Diagonal Susceptibilities up to 4th order
We have shown the baryonic susceptibilities up to 4th order in Figure. 3. Experimentally only net proton number is obtained as the neutrons are never observed. Cumulants of net proton number act as proxy to the susceptibilities of the net baryon number. Up to 2nd order there are no zero contours and therefore no regions of negative correlation. The first appearance of a negative region is for . It spans through the crossover as well as first order phase transition regions. For all the three cases studied here, the negative region is located just above the hadron-quark transition on the QGP side. For , the negative region is only in the crossover region and terminates at the CP. Negative values for have also been measured on lattice at non-zero [43]. For the case of msig600, even though the CP is absent, there is a negative region in the transition regime that stretches all the way up to very small T. Thus, we see that negative regions in and only imply the proximity of the hadron-quark transition region that may or may not include a CP. Thus negative values of and do not necessarily imply the existence of a CP. We have not shown plots of the susceptibilities of as the sign structure for the electric charge susceptibilities look similar to that of the baryonic ones. The contours of susceptibilities on the plane are devoid of any interesting sign structures. The susceptibilities are shown in Fig. 4. We note that in msig400-phys where the physical conditions of eqs. (3) and (4) are imposed, the diagonal strange susceptibilities are affected strongly and are distinctly different from what one obtains in msig400 and msig600. In msig400-phys the variation of along becomes gentler with the contours being almost parallel to the axis.


II.3.2 Mixed susceptibilities of order two
Neither nor have any interesting sign structure. Neither have any negative regions. On the other hand, has a narrow region where it turns negative for msig400 and msig600. Interestingly, this region of negative susceptibilities lies in the hadronic side. Fig. 5 shows which has negative values for large close to the transition region and within the hadronic phase. For msig400 we see that the region is close to the CP. For msig400-phys we observe that regions of negative correlation are in fact reduced and very close to the CP. Since negative correlations are also seen for msig600, we infer that a measurement of negative values of this correlation does not necessarily confirm a CP.

II.3.3 Mixed susceptibilities of order three
The third order mixed susceptibilities show more interesting behavior. In Fig.6, we show and . For msig400-phys, there is a large region deep into the HRG phase where is negative. Thus, there is a possibility that the CFO curve passes through this region and these negative regions could be observed in experiments. Interestingly, for both msig400 and msig600 where and are zero this negative region is highly localized on the first order line. which is not shown here has small negative valued region along the crossover line from the CP in msig400. However, this effect is absent in msig400-phys and msig600 and therefore probably cannot be used to probe the CP in experiment. For , all the variants show negative region in the hadronic side, though they do not extend as deep as in the case of . Interestingly, the region of negative correlation extends deeper into the hadronic region for msig400-phys For the remaining off diagonal susceptibilities of order 3 we find that none of them have regions of negative correlation in the hadronic phase, although some of them have negative regions in the QGP phase close to the transition curve.

II.3.4 Mixed susceptibilities of higher order
In Fig. 7 we show only those fourth order off-diagonal susceptibilities that have regions of negative correlation that penetrate the hadronic phase significantly. and have negative values only in the hadronic phase 11 1 Other negative regions seen in the plot are deep in the QGP phase and we disregard them.. We observe that while extends deep into the hadronic phase, is highly localized near the transition region and the CP. Also while the negative region for appears extended in msig400-phys as compared to the other cases, the opposite effect is observed in where the negative region diminishes slightly. For and regions of negative correlation exist on either side of the QCD transition line at large and close to the CP. These regions appear as two separate lobes that merge across the first order transition curve and separate above the CP where the nature of the transition is that of a cross-over. shows a slightly enhanced region of negative correlation for the physical conditions of msig400-phys in comparison to the other cases while the negative regions are reduced for in msig400-phys. In Fig.8 we show the contours for which has a behavior similar to the diagonal susceptibilities, with the region of negative correlation closely following the QCD transition curve and proceed into the QGP side.


II.4 Tracking the QCD phase transition
| Susceptibility | Negative Region | Negative in Hadronic Phase | Range | R |
|---|---|---|---|---|
| ✗ | – | – | – | |
| ✗ | – | – | – | |
| ✓ | ✗ | (0.6,0.9)-E | – | |
| ✓ | ✓ | (0.3,1.0)-CP | 0.98 | |
| ✗ | – | – | – | |
| ✗ | – | – | – | |
| ✓ | ✗ | (0.9,0.5)-E | – | |
| ✓ | ✗ | (0.7,0.9)-CP | – | |
| ✗ | – | – | – | |
| ✗ | – | – | – | |
| ✗ | – | – | – | |
| ✗ | – | – | – | |
| ✗ | – | – | – | |
| ✓ | ✓ | (0.9,0.6)-CP | 0.99 | |
| ✓ | ✓ | (0.7,0.7)-E | 0.91 | |
| ✓ | ✗ | (0.9,0.7)-E | – | |
| ✓ | ✗ | (0.5,0.9)-E | – | |
| ✗ | – | – | – | |
| ✓ | ✗ | (0.9,0.6)-CP | – | |
| ✓ | ✓ | |||
| ✓ | ✗ | (0.6,0.9)-E | – | |
| ✓ | ✓ | (0.6,0.8)-E | 0.84 | |
| ✓ | ✓ | (0.7,0.9)-CP | 0.99 | |
| ✓ | ✓ | (0.6,0.8)-E | 0.84 | |
| ✓ | ✓ | (0.4,0.9)-CP | 0.99 | |
| ✓ | ✗ | (0.6,0.9)-E | – | |
| ✓ | ✗ | (0.9,0.7)-E | – | |
| ✓ | ✓ | (0.2,0.1)-CP | 0.98 | |
| ✓ | ✓ | (0.4,1.0)-CP | 0.99 | |
| ✓ | ✓ | (0.8,0.6)-E | 0.96 | |
| ✓ | ✓ | (0.8,0.6)-CP | 0.99 | |
| ✓ | ✓ | (0.4,1.0)-CP | 0.99 | |
| ✗ | – | – | – | |
| ✓ | ✗ | (0.4,0.9)-CP | – | |
| ✓ | ✓ | (0.8,0.7)-E | 0.92 | |
| ✗ | – | – | – | |
| ✓ | ✓ | ()-CP | 0.96 | |
| ✓ | ✓ | (0.2,1.0)-CP | 0.97 | |
| ✓ | ✓ | (0.6,0.8)-E | 0.87 | |
| ✓ | ✓ | (0.5,0.9)-CP | 0.98 | |
| ✓ | ✓ | (0.3,1)-E | 0.99 | |
| ✓ | ✓ | (0.7,0.7)-E | 0.87 | |
| ✗ | – | – | – |
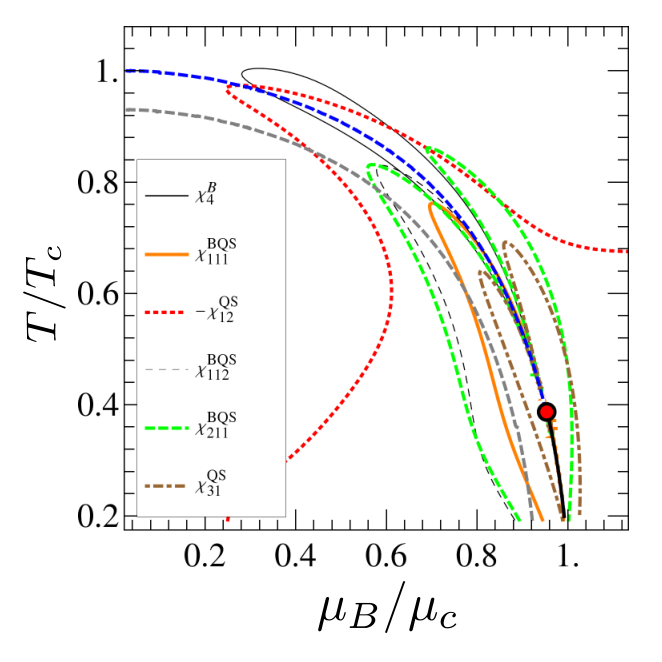
After a brief description of the essential features of the sign structure of various susceptibilities in the discussion above, we would like to indicate how a measurement of the same might be useful in locating the QCD phase transition curve as well as the CP. In Fig. 9, we show along with the phase transition curve, negative regions of a few select susceptibilities, namely , , , , and . We include the diagonal susceptibility in this plot to accentuate the fact the off-diagonal susceptibilities have regions of negative correlation significantly deeper in the hadronic phase. It is our proposal that a systematic measurement of these off-diagonal susceptibilities can provide valuable information about the proximity of the phase transition curve as well as the CP.
In order to illustrate this point, let us consider a hypothetical CFO curve as indicated by the (gray dashed line). The curve has been drawn by scaling the phase transition curve down by a factor and hence our CFO curve follows the phase transition curve. We have marked four points (labeled: A, B, C, and D) at various values of along this curve that indicate possible freeze-out points at which the sign of the susceptibilities can be determined. Point A, at high T and low (akin to the experiments at LHC) would not show negative values of the susceptibilities under consideration. At lower energies and larger , we approach point B where we might obtain the negative values for one of the susceptibilities, namely . As we proceed to point C along the CFO, we now have three negative susceptibilities; , and . Finally at point D, in addition to these three susceptibilities, is also negative. This indicates that point D is closest to the CP.
One must be wary that the CFO curve might have a more complicated shape than the simple scaled curve that we have used. In which case the CFO curve may miss some of the negative regions. Nevertheless, measurement of negative values of the susceptibilities we have considered here are indicative of proximity to the phase transition region. Most importantly, since these susceptibilities are negative deep in the hadronic phase, the CFO curve is more likely to pass through them.
Before we conclude, we summarize our findings in Table 2. In this table we list various susceptibilities and describe some of their properties. In the second column we of the table we indicate the presence of region of negative correlation by a tick mark and the absence of one by a cross. In the third column we indicate whether there there is a region of negative correlation in the hadronic phase. In the last two columns we map out regions of negative correlation. This we do by first observing that a common characteristic of negative regions is that they originate at some point of the plane and follow the phase transition curve. The negative regions terminate either at the CP or follow the phase transition curve all the way up to the end (E) at zero T. The fourth column thus indicates the point at which the negative region begins and whether it follows the phase transition curve up to the CP or to the end (E). Finally, for those susceptibilities that have negative regions in the hadronic phase we give the least value of the scale factor (R) for which our hypothetical CFO curve (described above) just touches the negative region. As can be gleaned from the table, there are several useful candidates that could be used to locate the QCD phase transition curve and CP.
III Conclusion
The sign structure of diagonal susceptibilities have been studied previously with negative regions found in the HRG-QGP transition regime and mostly in the QGP side. Thus only if CFO occurs close to the phase transition regime are these negative regions likely to be observed. HRG analysis of yields reveal that the CFO curve is close to the QCD transition curve for small as in the case of LHC [50, 51, 52, 53]. At SPS and future experiments like FAIR where is large, the CFO curve could be further away from the transition curve and therefore it is likely that these experiments may miss the negative regions. In this study we find that for particular choices of off-diagonal susceptibilities as listed in Table 2, negative regions could extend deep into the hadronic phase and should be accessible to the experiments even at large values of . Our study suggest that the correlations of conserved charges exhibit a rich sign structure in the plane that can be accessed by experiments. These can guide us in our search for the CP as well as the hadron-quark phase transition line. Their detection will also signal unambiguously the creation of a novel phase of QCD matter unlike the HRG phase. However, we should caution the reader that unlike critical exponents, sign structures of cumulants and the region over which they are negative are model dependent. Thus, our results should be viewed with caution when we want to extrapolate to real QCD. Another caveat is that , currently this study is at the mean field level. As an immediate step, the fate of these negative structures on including beyond mean field physics needs to be worked out. We also hope that our work motivates a similar study on the LQCD front on the sign structures of the off-diagonal susceptibilities which have so far been ignored.
IV Acknowledgements
SC acknowledges “Centre for Nuclear Theory” [PIC XII-R&D-VEC-5.02.0500], Variable Energy Cyclotron Centre for support. KAM acknowledges the support by the National Science Foundation under Grant No. PHY-0854889. The authors would like to thank the organizers of WHEPP-2013 (Workshop on High Energy Particle Physics and Phenomenology) where part of this work was done. KAM would like to thank K. Sridhar and the Department of Theoretical Physics, TIFR (Mumbai) for hospitality where part of this work was done.
References
- [1] L. D. McLerran and B. Svetitsky, Phys.Rev. D24, 450 (1981).
- [2] B. Svetitsky, Phys.Rept. 132, 1 (1986).
- [3] Y. Aoki, G. Endrodi, Z. Fodor, S. Katz, and K. Szabo, Nature 443, 675 (2006), arXiv:hep-lat/0611014 [hep-lat] .
- [4] C. Schmidt (HotQCD Collaboration), AIP Conf.Proc. 1343, 513 (2011), arXiv:1012.2230 [hep-lat] .
- [5] S. Borsanyi, G. Endrodi, Z. Fodor, S. Katz, S. Krieg, et al., JHEP 1208, 053 (2012a), arXiv:1204.6710 [hep-lat] .
- [6] O. Kaczmarek, F. Karsch, E. Laermann, C. Miao, S. Mukherjee, et al., Phys.Rev. D83, 014504 (2011), arXiv:1011.3130 [hep-lat] .
- [7] P. de Forcrand, PoS LAT2009, 010 (2009), arXiv:1005.0539 [hep-lat] .
- [8] S. Gupta, PoS LATTICE2010, 007 (2010), arXiv:1101.0109 [hep-lat] .
- [9] P. N. Meisinger and M. C. Ogilvie, Phys.Lett. B379, 163 (1996), arXiv:hep-lat/9512011 [hep-lat] .
- [10] K. Fukushima, Phys.Lett. B591, 277 (2004), arXiv:hep-ph/0310121 [hep-ph] .
- [11] C. Ratti, M. A. Thaler, and W. Weise, Phys.Rev. D73, 014019 (2006), arXiv:hep-ph/0506234 [hep-ph] .
- [12] S. K. Ghosh, T. K. Mukherjee, M. G. Mustafa, and R. Ray, Phys.Rev. D73, 114007 (2006), arXiv:hep-ph/0603050 [hep-ph] .
- [13] B.-J. Schaefer, J. M. Pawlowski, and J. Wambach, Phys.Rev. D76, 074023 (2007), arXiv:0704.3234 [hep-ph] .
- [14] H. Mao, J. Jin, and M. Huang, J.Phys. G37, 035001 (2010), arXiv:0906.1324 [hep-ph] .
- [15] B.-J. Schaefer and M. Wagner, Phys.Rev. D79, 014018 (2009), arXiv:0808.1491 [hep-ph] .
- [16] J. T. Lenaghan, D. H. Rischke, and J. Schaffner-Bielich, Phys.Rev. D62, 085008 (2000), arXiv:nucl-th/0004006 [nucl-th] .
- [17] K. Fukushima and T. Hatsuda, Rept.Prog.Phys. 74, 014001 (2011), arXiv:1005.4814 [hep-ph] .
- [18] R. Ray, Nucl.Phys. A862-863, 118 (2011).
- [19] B. Mohanty, (2013), arXiv:1311.3722 [nucl-ex] .
- [20] M. A. Stephanov, K. Rajagopal, and E. V. Shuryak, Phys.Rev.Lett. 81, 4816 (1998), arXiv:hep-ph/9806219 [hep-ph] .
- [21] M. A. Stephanov, K. Rajagopal, and E. V. Shuryak, Phys.Rev. D60, 114028 (1999), arXiv:hep-ph/9903292 [hep-ph] .
- [22] V. Koch, A. Majumder, and J. Randrup, Phys.Rev.Lett. 95, 182301 (2005), arXiv:nucl-th/0505052 [nucl-th] .
- [23] C. Bernard et al. (MILC Collaboration), Phys.Rev. D71, 034504 (2005), arXiv:hep-lat/0405029 [hep-lat] .
- [24] C. Bernard, C. E. DeTar, L. Levkova, S. Gottlieb, U. Heller, et al., Phys.Rev. D77, 014503 (2008), arXiv:0710.1330 [hep-lat] .
- [25] M. Cheng, P. Hendge, C. Jung, F. Karsch, O. Kaczmarek, et al., Phys.Rev. D79, 074505 (2009), arXiv:0811.1006 [hep-lat] .
- [26] S. Borsanyi, Z. Fodor, S. D. Katz, S. Krieg, C. Ratti, et al., JHEP 1201, 138 (2012b), arXiv:1112.4416 [hep-lat] .
- [27] K. Fukushima, Phys.Rev. D77, 114028 (2008), arXiv:0803.3318 [hep-ph] .
- [28] W.-j. Fu, Y.-x. Liu, and Y.-L. Wu, Phys.Rev. D81, 014028 (2010), arXiv:0910.5783 [hep-ph] .
- [29] W.-j. Fu and Y.-l. Wu, Phys.Rev. D82, 074013 (2010), arXiv:1008.3684 [hep-ph] .
- [30] A. Bhattacharyya, P. Deb, A. Lahiri, and R. Ray, Phys.Rev. D82, 114028 (2010), arXiv:1008.0768 [hep-ph] .
- [31] A. Bhattacharyya, P. Deb, A. Lahiri, and R. Ray, Phys.Rev. D83, 014011 (2011), arXiv:1010.2394 [hep-ph] .
- [32] B.-J. Schaefer, M. Wagner, and J. Wambach, Phys.Rev. D81, 074013 (2010), arXiv:0910.5628 [hep-ph] .
- [33] J. Wambach, B.-J. Schaefer, and M. Wagner, Acta Phys.Polon.Supp. 3, 691 (2010), arXiv:0911.0296 [hep-ph] .
- [34] S. Gupta, Pramana 76, 801 (2011).
- [35] A. Bazavov, H. Ding, P. Hegde, O. Kaczmarek, F. Karsch, et al., Phys.Rev.Lett. 109, 192302 (2012), arXiv:1208.1220 [hep-lat] .
- [36] S. Borsanyi, Z. Fodor, S. Katz, S. Krieg, C. Ratti, et al., Phys.Rev.Lett. 111, 062005 (2013), arXiv:1305.5161 [hep-lat] .
- [37] B. Schaefer and M. Wagner, Phys.Rev. D85, 034027 (2012), arXiv:1111.6871 [hep-ph] .
- [38] B. Berdnikov and K. Rajagopal, Phys.Rev. D61, 105017 (2000), arXiv:hep-ph/9912274 [hep-ph] .
- [39] C. Nonaka and M. Asakawa, Phys.Rev. C71, 044904 (2005), arXiv:nucl-th/0410078 [nucl-th] .
- [40] M. Asakawa, S. Ejiri, and M. Kitazawa, Phys.Rev.Lett. 103, 262301 (2009), arXiv:0904.2089 [nucl-th] .
- [41] V. Skokov, B. Friman, F. Karsch, and K. Redlich, J.Phys. G38, 124102 (2011), arXiv:1108.1300 [hep-ph] .
- [42] B. Friman, F. Karsch, K. Redlich, and V. Skokov, Eur.Phys.J. C71, 1694 (2011), arXiv:1103.3511 [hep-ph] .
- [43] R. Gavai and S. Gupta, Phys.Lett. B696, 459 (2011), arXiv:1001.3796 [hep-lat] .
- [44] L. Adamczyk et al. (STAR Collaboration), (2013), arXiv:1309.5681 [nucl-ex] .
- [45] S. Chatterjee and K. A. Mohan, Phys.Rev. D85, 074018 (2012a), arXiv:1108.2941 [hep-ph] .
- [46] S. Chatterjee and K. A. Mohan, Phys.Rev. D86, 114021 (2012b), arXiv:1201.3352 [hep-ph] .
- [47] A. Walther and A. Griewank, in Combinatorial Scientific Computing, edited by U. Naumann and O. Schenk (Chapman-Hall CRC Computational Science, 2012) Chap. 7, pp. 181–202.
- [48] M. Wagner, A. Walther, and B.-J. Schaefer, Comput.Phys.Commun. 181, 756 (2010), arXiv:0912.2208 [hep-ph] .
- [49] A. Bazavov, H. T. Ding, P. Hegde, O. Kaczmarek, F. Karsch, et al., (2014), arXiv:1404.6511 [hep-lat] .
- [50] J. Cleymans and K. Redlich, Phys.Rev.Lett. 81, 5284 (1998), arXiv:nucl-th/9808030 [nucl-th] .
- [51] A. Andronic, P. Braun-Munzinger, and J. Stachel, Nucl.Phys. A772, 167 (2006), arXiv:nucl-th/0511071 [nucl-th] .
- [52] F. Becattini, J. Manninen, and M. Gazdzicki, Phys.Rev. C73, 044905 (2006), arXiv:hep-ph/0511092 [hep-ph] .
- [53] S. Chatterjee, R. Godbole, and S. Gupta, Physics Letters B 727, 554 (2013), arXiv:1306.2006 [nucl-th] .