Pursuing the planet-debris disk connection: Analysis of upper limits from the Anglo-Australian Planet Search
Abstract
Solid material in protoplanetary discs will suffer one of two fates after the epoch of planet formation; either being bound up into planetary bodies, or remaining in smaller planetesimals to be ground into dust. These end states are identified through detection of sub-stellar companions by periodic radial velocity (or transit) variations of the star, and excess emission at mid- and far-infrared wavelengths, respectively. Since the material that goes into producing the observable outcomes of planet formation is the same, we might expect these components to be related both to each other and their host star. Heretofore, our knowledge of planetary systems around other stars has been strongly limited by instrumental sensitivity. In this work, we combine observations at far-infrared wavelengths by IRAS, Spitzer, and Herschel with limits on planetary companions derived from non-detections in the 16-year Anglo-Australian Planet Search to clarify the architectures of these (potential) planetary systems and search for evidence of correlations between their constituent parts. We find no convincing evidence of such correlations, possibly owing to the dynamical history of the disk systems, or the greater distance of the planet-search targets. Our results place robust limits on the presence of Jupiter analogs which, in concert with the debris disk observations, provides insights on the small-body dynamics of these nearby systems.
Keywords:
Stars: solar type; Stars: circumstellar matter; Stars: planetary systems; Techniques: radial velocities; Infrared: stars, planetary systemsI Introduction
Circumstellar debris discs around main-sequence stars are composed of second-generation dust produced by the attrition of larger bodies [2], which are remnants of primordial protoplanetary discs [14]. Exoplanets form early in the history of these systems, with 10 M⊕ planets required to capture a gas envelope from the protoplanetary disc before it dissipates [14, 43, typically within 3-10 Myr], whereas terrestrial planet formation by hierarchical growth [20, 40] may continue over longer timescales of a few tens of Myr [8, 9, e.g. Earth-Moon forming collision at 40 Myr].
Planet formation requires the hierarchical growth of dust grains to pebbles and thereafter to larger bodies eventually ending up at asteroids and comets - the planetesimals from which exoplanets form [37, 1]. At the same time, collisions between these planetesimals produce the dust grains we observe as the visible components of debris discs. Since planetesimals are key to production of both planets and dusty debris, one might expect the properties of planets and debris around a star to be mutually dependent. This expectation has been strengthened by the direct imaging of several exoplanet systems around debris disc host stars and indirectly by the structural features observed in many debris discs (warps, off-sets, asymmetries), which are often inferred to be due to the gravitational perturbation of the debris by one or more unseen exoplanet(s) [68, 18, 32, see reviews by].
Observations of nearby sun-like stars at far-infrared wavelengths by the Spitzer [56] and Herschel [38] space telescopes revealed evidence for several correlations between planets and debris. Herschel observations determined that a higher statistical incidence of exoplanets around debris disk host stars is seen, explicitly linking these two components of planetary systems [6]. Further correlations between the presence of both a debris disc and low-mass planets around low (sub-solar) metallicity stars [69, 26], and between the presence of a debris disc and cold (distant) Jovian planet(s) [22], have also been identified. Such correlations can be understood, and even expected, within a picture of planet formation via core accretion, and the subsequent dynamical interaction between planet(s) and planetesimal belts.
Previous studies to determine the underlying connections between these distinct components of planetary systems – stars, planets and debris – have concentrated on analysis of target samples consisting of known exoplanet host stars with or without debris [4, 31, 16, 5]. Little regard was given to the potential that any given star may in fact host a planet below the threshold of current detection capabilities. In this work we take account of the threshold upper limits for companions orbiting stars targeted by the Anglo-Australian Planet Search, some of which are already known to host planetary companions.
The Anglo-Australian Planet Search (AAPS) is an ongoing, 16-year high-precision radial-velocity survey of 250 nearby solar-type stars [48, 7]. It has achieved a consistent velocity precision of 2-3m s-1 for its lifetime, making the AAPS a world leader in the detection of long-period planets analogous to Jupiter. These “Jupiter analogs” are among the more recent of the 40 planets discovered by the AAPS, [62, 65, e.g.], and are the focus of ongoing observations and simulation work [60, 63]. In addition to the planet discoveries, the AAPS data are useful for setting limits on the presence of undetected planets [33, 59, 61, e.g.].
In this paper, we use the AAPS data, including non-detections, to further explore the connection between debris disks and planets. For the first time, we include the detection limits for targets which have debris disc observations but as yet no known planets. In Section 2, we describe the sample and detection-limit technique. Section 3 presents the results, and we give our conclusions in Section 4.
II Observations and the stellar sample
The stellar physical parameters used in the analysis, i.e. luminosity, photospheric temperature, age, and metallicity, were taken from [46] and [52]. The distances were taken from the re-reduction of the HIPPARCOS catalogue by [53].
II.1 Far-infrared observations
Of the 141 AAPS stars analysed here, 54 were observed at far-infrared wavelengths by the Herschel Space Observatory [38] with the Photodetector Array Camera and Spectrometer instrument [39, 3, PACS;] through a combination of the Guaranteed Time debris discs programme, the Open Time Key Programmes “Disc Emission via a Bias-free Reconnaissance in the Infrared /Submillimetre” [27, DEBRIS;] and “DUst around NEarby Stars” [10, DUNES;], and the Open Time programmes “Search for Kuiper-belts Around Radial-velocity Planet Stars” [6, 15, SKARPS;] and program OT1_amoromar_1 (PI: A. Moro-Martín). A further 11 stars were observed at 70 m by the Spitzer Space Telescope [56] with its “Multi-band Imaging Photometer for Spitzer” instrument [12, MIPS;]. Finally, upper limits at 60 m were taken from the IRAS Faint Source Catalogue for an additional 39 targets. A total of 104/141 AAPS stars therefore have some measure of the presence (or absence) of debris in their circumstellar environment. Of these, 21 stars have detected infrared excesses.
Herschel flux densities were taken from the literature where available [19, 10, 26]. For targets without published measurements, the PACS data were reduced and analysed using the Herschel Interactive Processing Environment [34, HIPE;] using the standard data reduction scripts and following the method laid out in Eiroa et al. [10]. Spitzer flux densities were taken from the literature, namely Trilling et al. [49] and Bryden et al. [5].
II.2 Dust limits
Dust fractional luminosities, or upper limits in the case of non-detection at far-infrared wavelengths, of the AAPS target stars were calculated from fitting of a modified blackbody [68] to the Spitzer MIPS measurements at 70 m [49, 5, compiled from] and Herschel PACS measurements at 70 and/or 100 and 160 m, along with optical, near- and mid-infrared and sub-mm measurements (where available) taken from the literature, following the approach of [26]. In the case of targets with only upper limits on their emission at far-infrared wavelengths, a dust temperature of 50 K was assumed for the fitting process. We compare the AAPS results presented here with results from the Herschel-observed radial-velocity planet host sample from [26] (see Figure 2).
II.3 Planetary detection limits
Amongst the 141 AAPS stars examined here, 43 are previously known to host one or more companions. For the targets known to host planets, we fit for and removed the signals of those planets, making use of additional velocity data from the literature where available. The stars considered here and the characteristics of the velocity data are given in Table 1. The detection limit was determined by adding a fictitious Keplerian signal to the data, then attempting to recover it via a generalized Lomb-Scargle periodogram [70]. Here, we have assumed circular orbits; for each combination of period and radial-velocity semiamplitude , we tried 30 values of orbital phase. The radial-velocity amplitude of the injected planet is increased until 99% of orbital configurations at a given are recovered with a false-alarm probability [44] of less than 1%. This approach is virtually identical to that used in our previous work [57, 58, 60, e.g.]. Because this approach uses a periodogram to determine detectability, gaps in data sampling can conspire to make some trial periods fail to produce a significant peak even for very large amplitudes (m s-1). These situations result in allegedly undetectable trial signals [59]. We compensate for this artefact in the following way: If an injected signal at a trial period fails to be detected for all values, the algorithm switches from the periodogram to the -test, starting again at m s-1 and increasing until all trial configurations at that combination result in an rms which differs from the original data at the 99% significance level. The upper limits on planetary companions were computed in this way for all 141 stars. We choose the detection limit at 5 AU as a representative figure of merit, being the approximate orbital radius of Jupiter, and being at an orbital period (12 yr) within the total timespan of the AAPS data (16 yr)11 1 For the median stellar mass 1M⊙, 12 yr. The range in this sample is 0.45-1.72M⊙, or 16.9-8.5 yr, respectively).
III Results and Discussion
Planetary detection limits in the sample of 141 stars are shown as a histogram in Figure 1; for comparison, known planets with au and m sin 0.2MJup are shown as a filled histogram. In Figure 2, the AAPS stars are presented as coloured or black data points, while those taken from literature sources are in greyscale. Broadly speaking, two distinct regions dominate the parameter space illustrated in Fig. 2: systems with high fractional luminosities and no known planets (of any given age) occupy the top left (with masses derived from sub-mm flux densities), whilst systems with low dust luminosities (or only upper limits) and massive Jovian exoplanets occupy the bottom right. This is suggestive that massive, cool Jovian planets preclude a peaceful coexistence with a debris belt [22]. Exceptions to this trend do exist including HD 95086 and HR 8799 with bright discs and massive exoplanets at comparable orbital radii [41, 42, 30, 23, 24, 28, e.g.], but such cases are usually young (100 Myr) and A-type stars. For a summary of A-star debris population statistics, see e.g. Su et al. [45] and Thureau et al. [47]. Such systems are quite different from the targets of the AAPS survey which are mature (Gyr), sun-like (FGK type) stars. For a summary of debris around FGK stars, see e.g. Bryden et al. [5], Maldonado et al. [22], and Eiroa et al. [10].
In the search for any correlation between the planets and debris it should be noted that only the brightest ends of the distributions of both planet mass (modulo orbital radius/instrument sensitivity) and dust luminosity have heretofore been measured. That we are able to discern any correlation between these components of planetary systems, however tentatively, is perhaps unexpected [22, 69, 26]. It is as yet impossible to detect direct dusty analogues to our solar system, due to the faintness of its cool debris disc, the Edgeworth-Kuiper belt, [54, ,]. Long term radial-velocity programs monitoring exoplanet host stars are still only in their third decade, with the AAPS being the longest currently running exoplanet survey, although the now defunct Lick survey still holds the record for longest duration [11]. The solar system was speculated to be at the fainter end of the dust brightness distribution [13, amongst the bottom 10%], although subsequent Herschel observations suggest it may in fact lie close to the average disk brightness (Moro-Martin et al., in prep.).
III.1 Statistical Analysis
Recent analysis of results from Spitzer [22, 69] and Herschel [6, 26] have identified correlations between the presence of debris and exoplanets around sun-like stars, finding that debris discs are more common around stars with known planetary companions [6] and that low-mass planet hosts favour the presence of debris over those stars with Jovian-mass companions [69, 26]. In this section, we apply the Kolmogorov-Smirnov (KS) and Fisher exact tests to the sample of AAPS stars presented here, looking for similar correlations.
We consider the dust fractional luminosities, or 3- upper limits, derived from either Spitzer MIPS 70 m or Herschel PACS 100 m measurements assuming a disc temperature of 50 K, with a preference for Herschel values if both are available due to the superior angular resolution of the PACS instrument over that of MIPS. The mass upper limits at 5 au for the stars are derived in this work. For the purposes of statistical analysis in this work, any star with a mass limit and no known Jovian-mass companion is ruled to be a potential low-mass planet host star, whilst those stars with mass limits (or host a known Jovian-mass companion) may potentially harbour a Jupiter analogue planet and are therefore potential high-mass planet hosts in this analysis.
In the AAPS sample presented here there is a total of 141 stars. Amongst these, 43 stars host known substellar companions22 2 HD 164427 is a brown dwarf, [48]. of which nine also host a cool debris disk. Of the remainder, twelve stars are known to host a debris disk without exhibiting any evidence of planets, whilst the remaining 87 stars in the sample have no observational evidence of a companion planetary system.
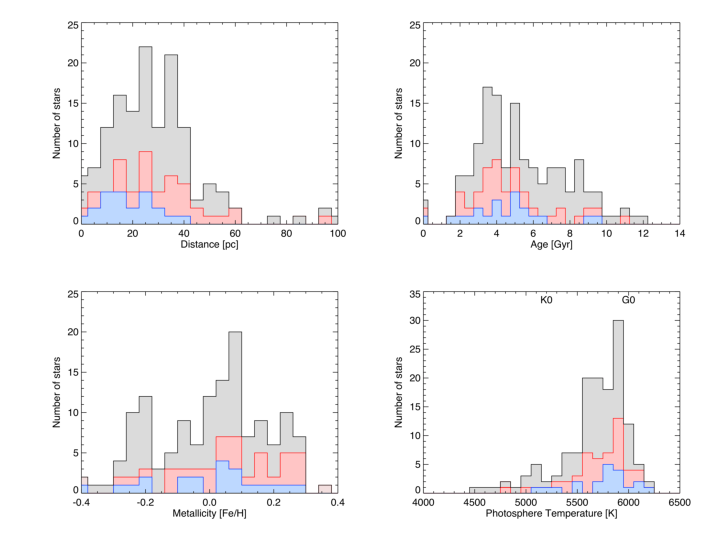
Stellar properties: Comparing the stellar properties of the AAPS sample with the volume limited radial-velocity planet hosts sample from [26] using the Fisher exact test, we find -values in the range 0.5 to 1.0 for their effective temperatures, , ages and metallicities. The results are plotted in Figure 3. The stellar composition of the two samples are therefore similar, to be expected as they are both comprised of targets from radial velocity planet searches. However, a comparison of the distance distributions shows a marked dissimilarity, with a -value of 0.057 as the AAPS stars, by and large, lie beyond 20 pc. The dust upper-limits are a strong function of the stellar distance with only weak constraints on the presence of debris beyond 25 pc (in the range to ), but the -value for dust incidence comparison of the AAPS sample presented here with [10] is 0.599, so the two samples are indistinguishable regarding the presence of debris.
Planetary mass (limits): Stars with sub-Jovian mass limits are preferentially low (sub-Solar) metallicity, suggesting that these stars do not have high mass planetary companions, as seen in [26]. The significance of this correlation is low, as the low metallicity stars in the sample are older and closer than the average for the sample, such that bias plays a role there.
Debris brightness: Looking at the distribution of detected debris discs in the sample, cool Jupiter host stars seem to favour the presence of a bright debris disc over low mass planet host stars, a trend identified by [22]. Checking this correlation in our sample with the KS test, we obtain a -value of 0.17 which is suggestive, but not conclusive, of a correlation between cool Jupiter mass planets and debris. The strength (weakness) of the correlation is heavily influenced by the presence of HD 207129, a large, bright debris disc host star [17, 25, 21], in the potential low-mass planet hosts subgroup. If we omit this star, then the -value of the KS test drops to 0.05, strengthening the significance of the (potential) correlation.
III.2 Conclusions
We have analysed a sample of AAPS stars, combining upper limits (ruling out Jovian analogues around several stars) with radial velocity detections, and have been able to identify a weak trend of debris brightness with planet mass. Further analysis, searching for other previously identified trends, is hampered by the weak upper limits on the presence of debris due to the larger distances to most of the stars in our sample than those of other samples, which typically concentrate on nearby stars (pc).
The absence of any strong trends between planets and debris may be a function of the dynamical history of these systems wherein the chaotic dynamical evolution of planets (including migration and scattering) dominates the observed disc brightness. Any correlations visible in more strictly defined stellar samples, wherein we have a better understanding of the relative incidences of their component parts as a function of the stellar and planetary properties is thereby diluted.
References
- [1] Armitage, P. J. 2013, Astrophysics of Planet Formation, by Philip J. Armitage, Cambridge, UK: Cambridge University Press, 2013,
- [2] Backman, D. E., & Paresce, F. 1993, Protostars and Planets III, 1253
- [3] Balog, Z., Müller, T., Nielbock, M., et al. 2013, Experimental Astronomy, 38
- [4] Beichman, C. A., Bryden, G., Stapelfeldt, K. R., et al. 2006, ApJ, 652, 1674
- [5] Bryden, G., Beichman, C. A., Carpenter, J. M., et al. 2009, ApJ, 705, 1226
- [6] Bryden, G., Krist, J. E., Stapelfeldt, K. R., et al. 2013, American Astronomical Society Meeting Abstracts, 221, #144.24
- [7] Butler, R. P., Tinney, C. G., Marcy, G. W., et al. 2001, ApJ, 555, 410
- [8] Canup, R. M. 2008, Icarus, 196, 518
- [9] Canup, R. M. 2012, Science, 338, 1052
- [10] Eiroa, C., Marshall, J. P., Mora, A., et al. 2013, A&A, 555, A11
- [11] Fischer, D. A., Marcy, G. W., & Spronck, J. F. P. 2014, ApJS, 210, 5
- [12] Gordon, K. D., Engelbracht, C. W., Fadda, D., et al. 2007, PASP, 119, 1019
- [13] Greaves, J. S., & Wyatt, M. C. 2010, MNRAS, 404, 1944
- [14] Hernández, J., Hartmann, L., Megeath, T., et al. 2007, ApJ, 662, 1067
- [15] Kennedy, G. M., Wyatt, M. C., Bryden, G., Wittenmyer, R., & Sibthorpe, B. 2013, MNRAS, 436, 898
- [16] Kóspál, Á., Ardila, D. R., Moór, A., & Ábrahám, P. 2009, ApJ, 700, L73
- [17] Krist, J. E., Stapelfeldt, K. R., Bryden, G., et al. 2010, AJ, 140, 1051
- [18] Krivov, A. V. 2010, Research in Astronomy and Astrophysics, 10, 383
- [19] Lestrade, J.-F., Matthews, B. C., Sibthorpe, B., et al. 2012, A&A, 548, A86
- [20] Lissauer, J. J. 1995, Icarus, 114, 217
- [21] Löhne, T., Augereau, J.-C., Ertel, S., et al. 2012, A&A, 537, A110
- [22] Maldonado, J., Eiroa, C., Villaver, E., Montesinos, B., & Mora, A. 2012, A&A, 541, A40
- [23] Marois, C., Macintosh, B., Barman, T., et al. 2008, Science, 322, 1348
- [24] Marois, C., Zuckerman, B., Konopacky, Q. M., Macintosh, B., & Barman, T. 2010, Nature, 468, 1080
- [25] Marshall, J. P., Löhne, T., Montesinos, B., et al. 2011, A&A, 529, A117
- [26] Marshall, J. P., Moro-Martín, A., Eiroa, C., et al. 2014, A&A, 565, A15
- [27] Matthews, B. C., Sibthorpe, B., Kennedy, G., et al. 2010, A&A, 518, L135
- [28] Matthews, B., Kennedy, G., Sibthorpe, B., et al. 2014, ApJ, 780, 97
- [29] Mayor, M., Udry, S., Naef, D., et al. 2004, A&A, 415, 391
- [30] Moór, A., Ábrahám, P., Kóspál, Á., et al. 2013, ApJ, 775, LL51
- [31] Moro-Martín, A., Carpenter, J. M., Meyer, M. R., et al. 2007, ApJ, 658, 1312
- [32] Moro-Martin, A. 2013, Planets, Stars and Stellar Systems. Volume 3: Solar and Stellar Planetary Systems, 431
- [33] O’Toole, S., et al. 2009, ApJ, 701, 1732
- [34] Ott, S. 2010, Astronomical Data Analysis Software and Systems XIX, 434, 139
- [35] Pepe, F., Mayor, M., Galland, F., et al. 2002, A&A, 388, 632
- [36] Pepe, F., Correia, A. C. M., Mayor, M., et al. 2007, A&A, 462, 769
- [37] Perryman, M. 2011, The Exoplanet Handbook by Michael Perryman, Cambridge University Press; 1 edition, 424 p., ISBN: 0521765595,
- [38] Pilbratt, G. L., Riedinger, J. R., Passvogel, T., et al. 2010, A&A, 518, L1
- [39] Poglitsch, A., Waelkens, C., Geis, N., et al. 2010, A&A, 518, L2
- [40] Pollack, J. B., Hubickyj, O., Bodenheimer, P., Lissauer, J. J., Podolak, M., & Greenzweig, Y. 1996, Icarus, 124, 62
- [41] Rameau, J., Chauvin, G., Lagrange, A.-M., et al. 2013a, ApJ, 772, LL15
- [42] Rameau, J., Chauvin, G., Lagrange, A.-M., et al. 2013b, ApJ, 779, LL26
- [43] Ribas, Á., Merín, B., Bouy, H., & Maud, L. T. 2014, A&A, 561, A54
- [44] Sturrock, P. A., & Scargle, J. D. 2010, ApJ, 718, 527
- [45] Su, K. Y. L., Rieke, G. H., Stansberry, J. A., et al. 2006, ApJ, 653, 675
- [46] Takeda, Y. 2007, PASJ, 59, 335
- [47] Thureau, N. D., Greaves, J. S., Matthews, B. C., et al. 2014, MNRAS, 445, 2558
- [48] Tinney, C. G., Butler, R. P., Marcy, G. W., et al. 2001, ApJ, 551, 507
- [49] Trilling, D. E., Bryden, G., Beichman, C. A., et al. 2008, ApJ, 674, 1086
- [50] Tuomi, M., Anglada-Escudé, G., Gerlach, E., et al. 2013, A&A, 549, A48
- [51] Udry, S., Mayor, M., Benz, W., et al. 2006, A&A, 447, 361
- [52] Valenti, J. A., & Fischer, D. A. 2005, ApJS, 159, 141
- [53] van Leeuwen, F. 2007, A&A, 474, 653
- [54] Vitense, C., Krivov, A. V., Kobayashi, H., Lohne, T. 2012, A&A, 540, AA30
- [55] Vogt, S. S., Wittenmyer, R. A., Butler, R. P., et al. 2010, ApJ, 708, 1366
- [56] Werner, M. W., Roellig, T. L., Low, F. J., et al. 2004, ApJS, 154, 1
- [57] Wittenmyer, R. A., Endl, M., Cochran, W. D., Hatzes, A. P., Walker, G. A. H., Yang, S. L. S., & Paulson, D. B. 2006, AJ, 132, 177
- [58] Wittenmyer, R. A., Endl, M., Cochran, W. D., Levison, H. F., & Henry, G. W. 2009, ApJS, 182, 97
- [59] Wittenmyer, R. A., O’Toole, S. J., Jones, H. R. A., et al. 2010, ApJ, 722, 1854
- [60] Wittenmyer, R. A., Tinney, C. G., O’Toole, S. J., Jones, H. R. A., Butler, R. P., Carter, B. D., & Bailey, J. 2011a, ApJ, 727, 102
- [61] Wittenmyer, R. A., Tinney, C. G., Butler, R. P., et al. 2011b, ApJ, 738, 81
- [62] Wittenmyer, R. A., Horner, J., Tuomi, M., et al. 2012, ApJ, 753, 169
- [63] Wittenmyer, R. A., Tinney, C. G., Horner, J., et al. 2013, PASP, 125, 351
- [64] Wittenmyer, R. A., Tan, X., Lee, M. H., et al. 2014a, ApJ, 780, 140
- [65] Wittenmyer, R. A., Horner, J., Tinney, C. G., et al. 2014b, ApJ, 783, 103
- [66] Wittenmyer, R. A., Tuomi, M., Butler, R. P., et al. 2014c, ApJ, 791, 114
- [67] Wright, J. T., et al. 2011, PASP, 123, 412
- [68] Wyatt, M. C. 2008, ARA&A, 46, 339
- [69] Wyatt, M. C., Kennedy, G., Sibthorpe, B., et al. 2012, MNRAS, 424, 1206
- [70] Zechmeister, M., Kürster, M. 2009, A&A, 496, 577
| Star | (days) | RMS (m s-1) | Telescope | Reference | |
|---|---|---|---|---|---|
| GJ 729 | 30 | 3218 | 20.7 | AAT | |
| GJ 832 | 39 | 5465 | 5.7 | AAT | Wittenmyer et al. [66] |
| 54 | 1089 | 1.9 | HARPS | Wittenmyer et al. [66] | |
| 16 | 818 | 1.7 | PFS | Wittenmyer et al. [66] | |
| total | 109 | 5569 | 3.5 | ||
| HD 142 | 86 | 5667 | 11.3 | AAT | |
| HD 1581 | 110 | 5668 | 3.3 | AAT | |
| HD 2039aaNo far-IR observations available. | 46 | 4780 | 14.0 | AAT | |
| HD 3823aaNo far-IR observations available. | 75 | 5668 | 5.6 | AAT | |
| HD 4308 | 41 | 680 | 1.7 | HARPS | Udry et al. [51] |
| 109 | 5669 | 3.8 | AAT | ||
| total | 150 | 5669 | 3.3 | ||
| HD 7570 | 53 | 5665 | 6.3 | AAT | |
| HD 9280aaNo far-IR observations available. | 30 | 4970 | 12.6 | AAT | |
| HD 10360 | 64 | 5668 | 4.7 | AAT | |
| HD 10647 | 51 | 5134 | 10.7 | AAT | |
| HD 10700 | 248 | 5726 | 3.0 | AAT | |
| 638 | 8800 | 7.1 | Lick | Fischer et al. [11] | |
| total | 886 | 9511 | 6.2 | ||
| HD 11112aaNo far-IR observations available. | 37 | 5724 | 15.8 | AAT | |
| HD 12387aaNo far-IR observations available. | 25 | 4403 | 8.0 | AAT | |
| HD 13445 | 64 | 5724 | 5.9 | AAT | |
| HD 14412 | 26 | 2561 | 3.4 | AAT | |
| HD 16417 | 117 | 5724 | 3.8 | AAT | |
| HD 17051 | 36 | 4843 | 18.0 | AAT | |
| HD 18709aaNo far-IR observations available. | 23 | 5104 | 8.5 | AAT | |
| HD 19632aaNo far-IR observations available. | 30 | 3863 | 24.8 | AAT | |
| HD 20201 | 31 | 5105 | 8.0 | AAT | |
| HD 20766 | 50 | 5881 | 6.5 | AAT | |
| HD 20782 | 53 | 5520 | 5.8 | AAT | |
| HD 20807 | 91 | 5724 | 4.4 | AAT | |
| HD 23079 | 37 | 5132 | 5.6 | AAT | |
| HD 23127 | 44 | 4850 | 11.6 | AAT | |
| HD 23484 | 19 | 2976 | 14.0 | AAT | |
| HD 26965 | 104 | 3046 | 4.4 | AAT | |
| 78 | 5016 | 7.8 | Lick | Fischer et al. [11] | |
| total | 182 | 6941 | 6.1 | ||
| HD 27274 | 28 | 4114 | 7.0 | AAT | |
| HD 27442 | 96 | 5724 | 7.3 | AAT | |
| HD 30177 | 36 | 5438 | 18.5 | AAT | |
| HD 30295aaNo far-IR observations available. | 33 | 4850 | 9.2 | AAT | |
| HD 31827aaNo far-IR observations available. | 29 | 5265 | 8.1 | AAT | |
| HD 33811aaNo far-IR observations available. | 26 | 4878 | 8.8 | AAT | |
| HD 36108aaNo far-IR observations available. | 34 | 5549 | 4.0 | AAT | |
| HD 38283aaNo far-IR observations available. | 64 | 5883 | 4.0 | AAT | |
| HD 38382aaNo far-IR observations available. | 45 | 5936 | 5.4 | AAT | |
| HD 38973aaNo far-IR observations available. | 43 | 5882 | 5.2 | AAT | |
| HD 39091 | 69 | 5879 | 6.4 | AAT | |
| HD 40307 | 28 | 5882 | 5.8 | AAT | |
| 345 | 1912 | 1.1 | HARPS | Tuomi et al. [50] | |
| total | 373 | 5882 | 1.9 | ||
| HD 42902aaNo far-IR observations available. | 17 | 4840 | 24.6 | AAT | |
| HD 43834 | 131 | 5880 | 6.1 | AAT | |
| HD 44120aaNo far-IR observations available. | 39 | 5882 | 3.8 | AAT | |
| HD 44594aaNo far-IR observations available. | 43 | 5937 | 6.8 | AAT | |
| HD 45289aaNo far-IR observations available. | 34 | 5941 | 5.1 | AAT | |
| HD 52447aaNo far-IR observations available. | 24 | 3689 | 15.8 | AAT | |
| HD 53705aaNo far-IR observations available. | 130 | 5880 | 4.3 | AAT | |
| HD 53706aaNo far-IR observations available. | 45 | 5881 | 3.3 | AAT | |
| HD 55720aaNo far-IR observations available. | 28 | 5634 | 3.8 | AAT | |
| HD 59468aaNo far-IR observations available. | 45 | 5881 | 5.0 | AAT | |
| HD 69655 | 30 | 4754 | 5.6 | AAT | |
| HD 69830 | 19 | 1181 | 4.4 | AAT | |
| 32 | 3451 | 7.8 | Lick | Fischer et al. [11] | |
| total | 51 | 4848 | 6.7 | ||
| HD 70642 | 41 | 5882 | 4.4 | AAT | |
| HD 72769aaNo far-IR observations available. | 30 | 5637 | 4.8 | AAT | |
| HD 73121aaNo far-IR observations available. | 43 | 5961 | 5.9 | AAT | |
| HD 73524aaNo far-IR observations available. | 84 | 5935 | 5.4 | AAT | |
| HD 73526 | 36 | 5226 | 7.7 | AAT | Wittenmyer et al. [64] |
| 20 | 856 | 2.8 | PFS | Wittenmyer et al. [64] | |
| total | 56 | 5226 | 6.3 | ||
| HD 75289 | 46 | 5879 | 6.6 | AAT | |
| HD 76700 | 43 | 4785 | 6.4 | AAT | |
| HD 78429aaNo far-IR observations available. | 38 | 5788 | 8.6 | AAT | |
| HD 80635aaNo far-IR observations available. | 23 | 4784 | 10.6 | AAT | |
| HD 83443aaNo far-IR observations available. | 23 | 1211 | 10.2 | AAT | |
| HD 83529AaaNo far-IR observations available. | 31 | 5964 | 4.9 | AAT | |
| HD 86819aaNo far-IR observations available. | 34 | 5844 | 10.2 | AAT | |
| HD 88742aaNo far-IR observations available. | 35 | 5941 | 12.3 | AAT | |
| HD 92987aaNo far-IR observations available. | 51 | 5935 | 5.3 | AAT | |
| HD 93385aaNo far-IR observations available. | 45 | 5845 | 7.8 | AAT | |
| HD 96423aaNo far-IR observations available. | 38 | 5464 | 5.1 | AAT | |
| HD 100623 | 95 | 3305 | 3.7 | AAT | |
| HD 102117 | 59 | 5766 | 4.7 | AAT | |
| HD 102365 | 178 | 5881 | 2.7 | AAT | |
| HD 102438 | 53 | 5881 | 4.1 | AAT | |
| HD 103932 | 18 | 2978 | 5.5 | AAT | |
| HD 105328 | 52 | 5961 | 6.2 | AAT | |
| HD 106453 | 36 | 3014 | 10.7 | AAT | |
| HD 108147 | 56 | 5166 | 13.0 | AAT | |
| 118 | 1076 | 16.0 | CORALIE | Pepe et al. [35] | |
| total | 174 | 5166 | 15.0 | ||
| HD 108309 | 66 | 5961 | 4.7 | AAT | |
| HD 114613 | 235 | 5965 | 3.9 | AAT | |
| HD 114853 | 57 | 5962 | 6.9 | AAT | |
| HD 115617 | 153 | 3228 | 3.1 | AAT | |
| 78 | 1682 | 2.3 | Keck | Vogt et al. [55] | |
| total | 231 | 3228 | 3.1 | ||
| HD 117618 | 73 | 5881 | 5.7 | AAT | |
| HD 120690 | 11 | 1176 | 4.5 | AAT | |
| HD 122862 | 100 | 5961 | 4.7 | AAT | |
| HD 128620 | 102 | 4926 | 3.5 | AAT | |
| HD 128621 | 119 | 5725 | 3.7 | AAT | |
| HD 134060 | 95 | 5876 | 6.3 | AAT | |
| HD 134330 | 44 | 5549 | 6.2 | AAT | |
| HD 134987 | 73 | 5579 | 3.0 | AAT | |
| HD 140901 | 113 | 5551 | 12.1 | AAT | |
| HD 142415 | 22 | 2687 | 17.0 | AAT | |
| 137 | 1529 | 14.6 | CORALIE | Mayor et al. [29] | |
| total | 159 | 3808 | 14.8 | ||
| HD 143114 | 40 | 5878 | 6.2 | AAT | |
| HD 147722 | 66 | 5879 | 17.8 | AAT | |
| HD 154857 | 42 | 4109 | 3.2 | AAT | Wittenmyer et al. [65] |
| HD 155974 | 50 | 5878 | 9.6 | AAT | |
| HD 159868 | 49 | 4077 | 6.6 | AAT | Wittenmyer et al. [62] |
| 34 | 1593 | 4.4 | Keck | Wittenmyer et al. [62] | |
| total | 83 | 4077 | 5.8 | ||
| HD 160691 | 172 | 5581 | 2.6 | AAT | |
| 40 | 2483 | 7.7 | CORALIE | Pepe et al. [36] | |
| 86 | 980 | 1.7 | HARPS | Pepe et al. [36] | |
| total | 298 | 5581 | 3.5 | ||
| HD 161612 | 50 | 5874 | 4.4 | AAT | |
| HD 164427 | 44 | 5079 | 6.2 | AAT | |
| HD 177565 | 165 | 3501 | 3.1 | AAT | |
| HD 179949 | 68 | 5085 | 12.2 | AAT | |
| HD 183877 | 43 | 5673 | 5.8 | AAT | |
| HD 187085 | 69 | 5434 | 12.0 | AAT | |
| HD 189567 | 88 | 5345 | 5.5 | AAT | |
| HD 191408 | 177 | 5497 | 3.9 | AAT | |
| HD 192310 | 158 | 5377 | 3.1 | AAT | |
| HD 192865 | 44 | 5345 | 10.4 | AAT | |
| HD 193193 | 52 | 5652 | 5.8 | AAT | |
| HD 193307 | 79 | 5377 | 4.4 | AAT | |
| HD 194640 | 78 | 5377 | 4.8 | AAT | |
| HD 196050 | 55 | 5021 | 7.7 | AAT | |
| HD 196068 | 35 | 5375 | 11.8 | AAT | |
| HD 196761 | 45 | 3010 | 5.7 | AAT | |
| HD 196800 | 38 | 5675 | 6.6 | AAT | |
| HD 199190 | 52 | 5521 | 4.8 | AAT | |
| HD 199288 | 80 | 5521 | 5.1 | AAT | |
| HD 199509 | 32 | 5732 | 4.6 | AAT | |
| HD 202628 | 30 | 4367 | 10.9 | AAT | |
| HD 204385 | 38 | 5465 | 6.5 | AAT | |
| HD 205536 | 27 | 5432 | 4.1 | AAT | |
| HD 205390 | 33 | 5521 | 9.6 | AAT | |
| HD 207129 | 120 | 5433 | 4.9 | AAT | |
| HD 207700 | 33 | 5522 | 5.4 | AAT | |
| HD 208487 | 46 | 5433 | 8.5 | AAT | |
| HD 208998 | 34 | 5054 | 7.8 | AAT | |
| HD 209653 | 40 | 5462 | 5.0 | AAT | |
| HD 210918 | 68 | 5521 | 5.0 | AAT | |
| HD 211317 | 41 | 5433 | 5.1 | AAT | |
| HD 212168 | 47 | 5464 | 5.4 | AAT | |
| HD 212330 | 31 | 5218 | 3.7 | AAT | |
| HD 212708 | 35 | 4069 | 4.3 | AAT | |
| HD 213240 | 35 | 4487 | 5.0 | AAT | |
| HD 214759 | 30 | 5465 | 5.7 | AAT | |
| HD 214953 | 78 | 5464 | 4.2 | AAT | |
| HD 216435 | 74 | 4723 | 6.5 | AAT | |
| HD 216437 | 51 | 5668 | 4.6 | AAT | |
| 21 | 865 | 8.0 | CORALIE | Mayor et al. [29] | |
| total | 72 | 5668 | 5.8 | ||
| HD 217958 | 35 | 4727 | 9.2 | AAT | |
| HD 219077 | 69 | 5635 | 4.8 | AAT | |
| HD 220507 | 27 | 5464 | 4.2 | AAT | |
| HD 221420 | 79 | 5960 | 4.0 | AAT | |
| HD 222237 | 30 | 5431 | 4.6 | AAT | |
| HD 223171 | 58 | 5464 | 6.0 | AAT |