Eliashberg analysis of the optical conductivity in superconducting Pr2CuOx ()
Abstract
Superconducting Pr2CuOx, films with structure and a of 27 K have been investigated by millimeter-wave transmission and broadband (infrared-to-ultraviolet) reflectivity measurements in the normal and superconducting state. The results obtained by both experimental methods show a consistent picture of the superconducting condensate formation below . An Eliashberg analysis of the data proves -wave superconductivity and unitary-limit impurity scattering of the charge carriers below . The derived electron-exchange boson interaction spectral function shows only marginal changes at the superconducting transition with the mass enhancement factor , the first inverse moment of , being equal to 4.16 at 30 K and to 4.25 at 4 K.
pacs
74.25.Gz, 74.25.nd, 74.72.Ekewald.schachinger@live.at, pronin@ran.gpi.ru
1 Introduction
The parent compounds of the superconducting high- cuprates are generally considered to be antiferromagnetic charge-transfer insulators (CTIs) [1, 2]. For the hole-doped compounds, this statement is commonly accepted. For the electron-doped cuprates, the situation is trickier: there are studies, that put a question mark on this picture.
For example, in 1995 Brinkmann et al. [3] demonstrated that the superconducting phase in Pr2-xCexCuO4 (PCCO) single crystals can exist at doping levels as low as 4 %. This was achieved by a special oxygen-reduction and annealing technique. A large body of work performed in the last few years on thin films demonstrated that even the parent compounds of the electron-doped cuprates, e.g. (La,Y)2CuO4 and CuO4 with being Pr, Sm, Nd, Eu, or Gd, are metallic and become superconducting at low temperatures [4, 5, 6, 7, 8, 9, 10, 11]. Finally, superconductivity was reported in nominally undoped polycrystalline samples of (La,Sm)2CuO4 [12, 13] and in heavily underdoped single crystals of the Pr-La-Ce-Cu-O system [14].
The sharp contradiction between these and earlier results can be explained as being due to structure-related issues, namely due to the presence or absence of oxygen atoms in apical positions, i.e. in positions directly above and below the copper atoms in the CuO2 planes, as illustrated in the right-hand corner of Figure 1. While the hole-doped cuprates have the so-called structure characterized by the presence of apical oxygen, the electron-doped cuprates are supposed to posses the structure, with no apical oxygen. In practice, though, it is very hard to remove the apical oxygen from the electron-doped cuprates completely, particularly in bulk samples [10]. Apical oxygen in the structure is known to act as a very strong scatterer and pair breaker [15] and, thus, the reduction in the underdoped compounds may in fact be due to the remaining apical oxygen. Because of tenuity of films and their large surface-to-volume ratio, the process of removing extra oxygen (oxygen reduction) is easier to perform and control in films rather than in bulk samples. This makes films advantageous for achieving the proper structure with no apical oxygen.
Superconductivity reported in undoped cuprates challenges the applicability of the CTI picture to electron-doped cuprates [16]. It is worth noting here that recent calculations performed on the basis of a new first-principles method report a sharp difference between the parent compounds with and structures [17, 18, 19]. While the first are found to be “standard” CTIs, the latter, e.g. Pr2CuO4, are essentially metallic and their apparent insulating nature may originate from magnetic long-range order (Slater transition) which is competing with the metallic ground state.
However, it is still an open question whether the supposedly undoped superconductors are truly undoped. An alternative possibility is a doping by oxygen vacancies in the O layers. These vacancies may in principle be created during the oxygen-reduction process. Because no single-crystalline bulk -CuO4 superconducting samples have yet been synthesized, direct measurements of the oxygen distribution are impossible so far. Nevertheless, neutron diffraction experiments performed on Nd2-xCexCuO4+y single crystals showed that it was mostly apical oxygen, which was removed during the oxygen reduction [20, 21]. The recent report on superconductivity in bulk heavily underdoped -Pr1.3-xLa0.7CexCuO4+δ gives hope that the oxygen distribution issue for the cuprates might be clarified in the near future [14].


In our recent paper [22] we investigated the optical response of MBE-grown Pr2CuOx (PCO) films with . We showed that the optical response can be consistently understood within the picture in which superconductivity develops in undoped PCO, i.e. is indeed 4. (Although it is quite obvious that one cannot judge whether or not the CTI picture is valid from optical measurements alone). In that paper, we reported on normal-state broadband optical reflectivity measurements and on millimeter-wave measurements below the superconducting transition. We demonstrated that neither raw experimental optical data nor their analysis reveal any indication of normal-state gap-like features which could be attributed to the existence of a normal-state pseudogap. This observation is in line with the breakdown of the CTI picture in PCO. In our millimeter-wave measurements, we directly observed the formation of the superconducting condensate at and found that the temperature dependence of the London penetration depth at low temperatures follows a quadratic power law indicating a -wave pairing symmetry typical for cuprate superconductors. Similar results on penetration depth for PCO films, prepared by metalorganic decomposition, were also reported by some of us a few years earlier [23].
In this paper, we report on the broadband optical conductivity in the superconducting state, measured on the same sample as in Ref. [22]. We perform Eliashberg analysis of optical data collected below and compare the results to the normal-state data of Ref. [22]. We demonstrate that the results obtained by both our techniques (broadband optical reflectivity and millimeter-wave transmission measurements) for the superconducting state reveal a consistent picture of the superconducting condensate formation. We find that -wave superconductivity and unitary-limit electron scattering off impurities describe best the available experimental data below .
2 Samples and Experiment
As described in Ref. [22], the PCO films were grown by molecular beam epitaxy (MBE) [8] on a (110)-oriented 0.35 mm thick DyScO3 substrate. The films were 100 nm thick with the -axis oriented perpendicular to the film’s surface. We investigated two thin films of PCO. The results, obtained on the films, do not demonstrate any significant difference. Hereafter we discuss results gathered from one of the two films, the same one as in Ref. [22].
Figures 1 and 2 show the results of dc resistivity and x-ray diffraction measurements performed on the film. The sharp diffraction peaks with no signs of spurious phases demonstrate the film’s quality. The resistivity decreases monotonically with decreasing temperature down to K. The width of the superconducting transition is 0.8 K. The and the transition width remained unchanged after completion of all optical measurements (as evident from the inset of Figure 1) indicating that the film did not degrade in the course of our measurements.
We measured near-normal reflectivity from 40 to 55000 cm-1 at selected temperatures from 4 to 300 K and phase-sensitive transmission at 210 and 250 GHz (7 and 8.3 cm-1) as a function of temperature, using backward wave oscillators (BWOs). Details of these measurements have been discussed by us earlier [22].

3 Experimental results
Figure 3 shows the in-plane (-plane) reflectivity of the PCO film on a DyScO3 substrate versus frequency at K and K, e.g. at the lowest possible in the superconducting state and at a temperature slightly above the . At low frequencies, the reflectivity is quite high, typical for metals and metallic films. At 100 – 700 cm-1, a number of phonon modes from both, the substrate and the film, affect the spectra. From 1000 to 10000 cm-1, the reflectivity monotonously decreases with frequency. The maxima seen above 10000 cm-1 are due to inter-band transitions [22].
The inset of Figure 3 discusses the ratio of the reflectivity at K () and K (). Changes in the spectrum induced by the superconducting transition are not very pronounced but, nevertheless, can clearly be seen at frequencies below 200 cm-1. If we reduce the frequency resolution [thick (black) line] the changes become more apparent. Let us emphasize, though, that because of the fact that the film is thin and partly transparent (the absolute reflectivity at low frequencies is only about 0.8) pronounced changes in the reflectivity induced by superconductivity cannot be expected in contrast to what can be observed in bulk samples.
For conventional isotropic -wave superconductors the maximum in is known to indicate the position of the superconducting energy gap [24]. For a rough estimate of such an approach can also be applied to the cuprates. If we associate in a straightforward way the maximum in to the energy gap, then we obtain = 110 cm-1 and = 5.8. This value is roughly in the middle of the broad range of obtained by different experimental methods for the electron-doped cuprates [2] and is close to the results of optical measurements on PCCO with different doping levels [25, 26].
The film’s complex optical conductivity, , has been extracted from the reflectivity spectra by use of a thin-film Drude-Lorentz fitting procedure which was described in necessary detail by Chanda et al. [22]. This procedure is similar to the one proposed by Kuzmenko [27] and can be as accurate as the Kramers-Kronig analysis (which is hardly possible for partly-transparent films on substrates). Neither BWO data nor values of the dc conductivity in the normal state have been utilized within this fitting procedure.

The real part of the PCO optical conductivity obtained by this modeling at K and K is presented in Figure 4. The lowest frequency of the reflectivity measurements was 40 cm-1. Therefore, the data obtained from this analysis below this threshold frequency is to be considered as an extrapolation and is indicated by dashed lines as a guide to the eye. Nevertheless, the zero-frequency limit of at K evolves in accordance with [(red) triangle on the vertical left-hand axis of Figure 4]. At low frequencies, the superconducting-state is below its normal state values. However, a large Drude-like contribution persists in the superconducting state. Similar behavior of optical conductivity has also been reported e.g. for La2Sr2-xCuO4 [28] and Bi2Sr2CaCu2O8+δ [29, 30].
The inset of Figure 4 presents the data of the imaginary part of the optical conductivity, , at K [(black) line] and K [(red) line]. In addition, the independent BWO data at 7 and 8.3 cm-1 are indicated by solid circles and it is evident that at K tends to diverge for , while at K tends to zero within the same limit. Thus, our data for the superconducting and normal state are not only distinct from each other but they also exhibit the expected behavior [24] in the superconducting state: a divergence at , and in the normal state: a Drude metal with diminishing at .
4 Data Analysis
We start our analysis with the so-called extended Drude model [31, 32]. In this model the complex conductivity is given by
| (1) |
where and are the frequency-dependent mass renormalization factor and the optical scattering rate, respectively. Inverting equation (1) gives:
| (2) |
The frequency-dependent optical scattering rate, as obtained from our data using (2) with = 2.19 eV [22], is displayed in Figures 5(a,b) as a function of frequency for K and K [solid (black) curves], respectively. The general trend in is to increase with frequency, but this increase is non-monotonic. This is due to phonons and a localization mode seen as a bump at around 230 cm-1 as discussed by Chanda et al. [22].
There is only little difference between the K and K data. This is quite similar to what has been reported for PCCO by Schachinger et al. [33]. Nevertheless, it is important to emphasize that according to (2) and the results for (see inset of Figure 4) the normal-state stays finite in the limit . On the other hand, it drops precipitately to zero in the rather narrow energy range of cm-1 at K. To emphasize this feature we added a small negative offset to the frequency-scale in Figures 5(a,b).

The difference between total optical scattering rate and impurity scattering rate, i.e. , is according to P. B. Allen [34] closely related to the electron-exchange boson interaction spectral density which is at the core of the normal and superconducting state Eliashberg theory [35]. Thus, it is of quite some interest to gain knowledge on by inverting this difference using methods which have been discussed in detail by Schachinger et al. [36]. It was, furthermore, demonstrated by Schachinger et al. [37] that any non-zero contribution to at some energy will always result in an increase of the optical scattering rate. Consequently the bump observed in the experimental optical scattering rate of PCO (Figure 5) at around 230 cm-1 (meV) cannot be caused by electron-exchange boson interaction and is, therefore, not part of the conducting-electron background.

The inversion of the normal state K data using a maximum entropy method of inversion [37] has already been discussed in quite some detail by Chanda et al. [22] and resulted in an spectrum featuring a double peak structure followed by a deep valley and a hump at higher energies. We reproduce these results for comparison in Figure 5(a) which shows the experimental data by a solid (black) line and the data reconstruction due to normal-state Eliashberg theory by a dashed (green) line. The resulting is presented by a dashed (black) line in Figure 6. The low-energy peak is at meV and the high energy peak can be found at meV. This inversion process resulted also in an impurity scattering rate of meV (meV) which is quite substantial but in reasonable agreement with what has been reported for the system PCCO [33]. Similar double peak spectra have been reported for PCCO by Schachinger et al. [33] and for La1.83Sr0.17CuO4 (a hole doped cuprate) by Hwang et al. [38] both with a less pronounced low-energy peak. It is most likely that the bump around meV in the PCO data is responsible that the low-energy peak is too pronounced in the PCO spectrum.
More information on can be gained from an inversion of superconducting state data together with a comparison between data and theory. An inversion of the K superconducting state optical scattering rate data should be possible [36], but the formula quoted there is only valid in the clean-limit case and cannot be applied here. The only possibility that remains is to use the spectrum for K as a starting point and to calculate the optical scattering rate in the superconducting state at K using the full -wave Eliashberg theory [35]. The use of -wave Eliashberg theory is justified by the fact that neither the superconducting-state data of nor the optical scattering rate show the signature of a full -wave gap, where and would be equal to zero within the energy range with the superconducting gap. Moreover, the use of the normal state as a staring point is also justified by the fact that there is very little difference between the K and K data except, of course, in the vicinity of . Thus, a least-squares fit procedure was employed to generate the superconducting state spectrum which allowed an optimum fit to the data. This spectrum is shown in Figure 6 by a solid (red) curve and is only marginally different from the corresponding normal-state derived spectrum. The mass enhancement factor also varies only little from 4.16 at K to 4.25 at K.
Theory is compared with experiment in Figure 5(b). In contrast to the normal state, the scattering of the electrons off impurities is in the superconducting state more accurately described by a -matrix approximation. Here, the impurity scattering rate is described by a parameter with the concentration of scattering centers and is the electronic density of states at the Fermi level. In addition, there is a scattering phase shift and we introduce an additional parameter for convenience. The case corresponds to unitary scattering and for , i.e. , the weak scattering limit (Born’s approximation) is recovered [39]. (In the normal state only the weak scattering limit matters.) Consequently, Figure 5(b) presents results for unitary [dotted (blue) line] as well as Born limit scattering [dashed (magenta) line] off impurities. As in the normal state there is little agreement between theory and experiment in the energy range around the bump at meV. Nevertheless, it is obvious that theory with unitary scattering describes rather well the precipitous drop of to zero as , while in the case of Born-limit scattering the decrease of as is more moderate.
If we want to discriminate even better between unitary and Born limit scattering we are required to analyze other experimental data which are linearly independent from the optical scattering rate data. One possibility is offered by the London penetration depth, , derived from our phase-sensitive millimeter-wave transmission measurements [22]. From the theoretical point of view, can easily be calculated from -wave Eliashberg theory using the K spectrum presented in Figure 6 together with the relevant impurity parameters because there is only little variation in the spectrum in going from K to K.
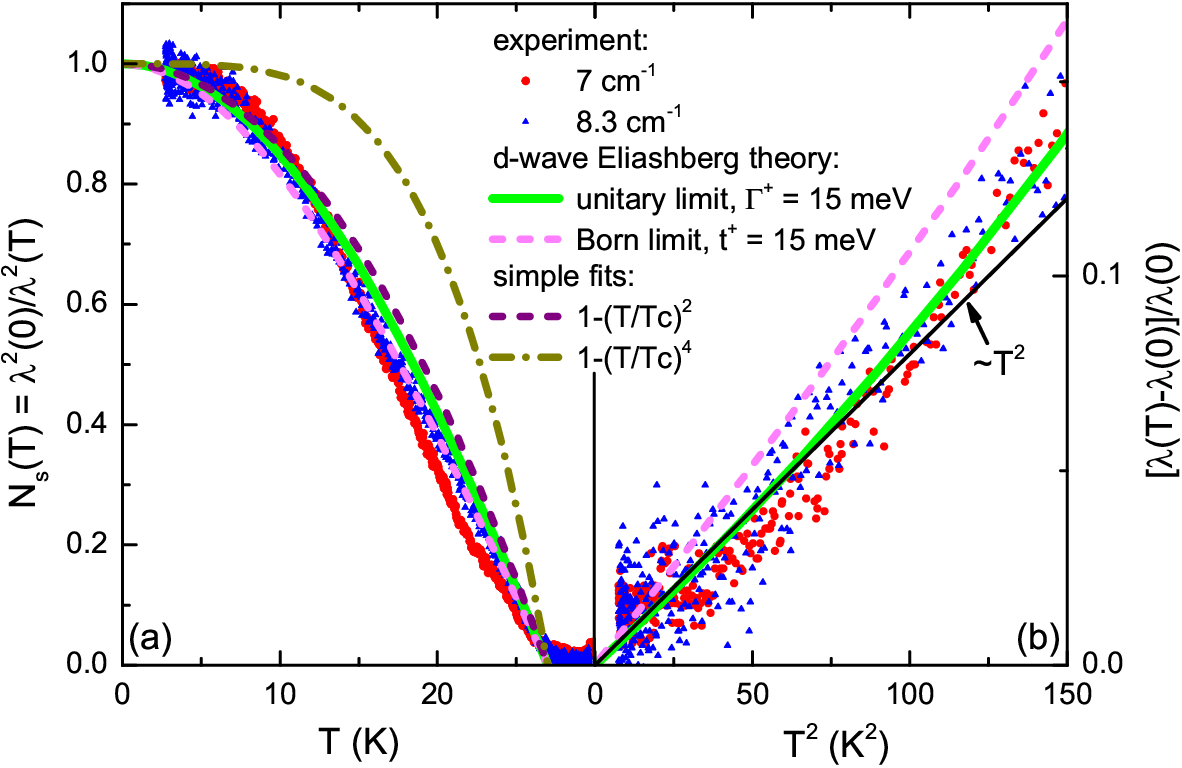
In Figure 7(a) we replot the temperature dependence of the normalized superfluid density, , which was obtained from millimeter-wave measurements at 7 cm-1 and 8.3 cm-1 and reported by us in Ref. [22]. Curves for and are added to mimic the temperature dependence of for nodal (-wave) and fully gaped (-wave) superconductivity, respectively. As it has already been discussed in Ref. [22], the former curve describes the data reasonably well, whereas the fully-gaped behavior can be ruled out [40]. Here we added theoretical results gained from -wave Eliashberg theory calculations for unitary scattering with meV and Born limit scattering with meV. Both results agree reasonably well with experiment over the whole temperature range, thus supporting nodal superconductivity.
As we measure at a non-zero frequency, the normal electrons always contribute to . A comprehensive discussion on this issue is given in Ref. [41]. Obviously, the normal-electron contribution is minimal at the lowest . Hence, the lowest-temperature behavior is most relevant for a comparison between experiment and theory which calculates in the limit. To provide this comparison, we plot the experimental and calculated low-temperature variation of the normalized penetration depth, , as a function of the temperature squared in Figure 7(b). There is no question that the results for unitary scattering reproduce best the data. This result also agrees rather nicely with the findings reported by Schachinger et al. [33] for PCCO.
5 Conclusions
In our broadband investigation of the optical response of thin PCO films, we directly observed the formation of the superconducting condensate at . Eliashberg analysis of the optical spectra and of the temperature dependence of the penetration depth proves PCO to be a rather dirty -wave superconductor. In the superconducting state the scattering off impurities is best described within the unitary limit. The Eliashberg function develops only marginal changes in passing through . Consequently, the mass enhancement factor changes very little from 4.16 at K and to 4.25 at K. This is a rather big value but one has to keep in mind that scattering off impurities is pair-breaking in -wave superconductors and a rather large value of is required to ensure a of K in our particular case.
References
References
- [1] Imada M, Fujimori A and Tokura Y 1998 Rev. Mod. Phys. 70 1039
- [2] Armitage N P, Fournier P and Greene R L 2010 Rev. Mod. Phys. 82 2421
- [3] Brinkmann M, Rex T, Bach H and Westerholt K 1995 Phys. Rev. Lett. 74 4927
- [4] Matsumoto O, Utsuki A, Tsukada A, Yamamoto H, Manabe T and Naito M 2009 Phys. Rev. B 79 100508
- [5] Matsumoto O, Utsuki A, Tsukada A, Yamamoto H, Manabe T and Naito M 2008 Physica C 468 1148
- [6] Matsumoto O, Tsukada A, Yamamoto H, Manabe T and Naito M 2010 Physica C 470 1029
- [7] Matsumoto O, Utsuki A, Tsukada A, Yamamoto H, Manabe T and Naito M 2009 Physica C 469 924
- [8] Yamamoto H, Matsumoto O, Krockenberger Y, Yamagami K and Naito M 2011 Solid State Commun. 151 771
- [9] Ikeda A, Matsumoto O, Yamamoto H, Manabe T and Naito M 2011 Physica C 471 686
- [10] Krockenberger Y, Irie H, Matsumoto O, Yamagami K, Mitsuhashi M, Tsukada A, Naito M and Yamamoto H 2013 Sci. Rep. 3 2235
- [11] Kojima K M, Krockenberger Y, Yamauchi I, Miyazaki M, Hiraishi M, Koda A, Kadono R, Kumai R, Yamamoto H, Ikeda A and Naito M 2014 Phys. Rev. B 89 180508
- [12] Ueda S, Asai S and Naito M 2010 Physica C 470 1173
- [13] Asai S, Ueda S and Naito M 2011 Physica C 471 682
- [14] Adachi T, Mori Y, Takahashi A, Kato M, Nishizaki T, Sasaki T, Kobayashi N and Koike Y 2013 J. Phys. Soc. Jpn. 82 063713
- [15] Sekitani T, Naito M and Miura N 2003 Phys. Rev. B 67 174503
- [16] Naito M, Matsumoto O, Utsuki A, Tsukada A, Yamamoto H and Manabe T 2008 J. Phys.: Conf. Ser. 108 012037
- [17] Das H and Saha-Dasgupta T 2009 Phys. Rev. B 79 134522
- [18] Weber C, Haule K and Kotliar G 2010 Nat. Phys. 6 574
- [19] Weber C, Haule K and Kotliar G 2010 Phys. Rev. B 82 125107
- [20] Schultz A J, Jorgensen J D, Peng J L, and Greene R L 1996 Phys. Rev. B 53 5157
- [21] Radaelli P G, Jorgensen J D, Schultz A J, Peng J L and R. L. Greene R L 1994 Phys. Rev. B 49 15322
- [22] Chanda G, Lobo R P S M, Schachinger E, Wosnitza J, Naito M and Pronin A V 2014 Phys. Rev. B 90 024503
- [23] Pronin A V, Fischer T, Wosnitza J, Ikeda A and Naito M 2012 Physica C 473 11
- [24] Tinkham M 1996 Introduction to Superconductivity (NY: Dover)
- [25] Zimmers A, Lobo R P S M, Bontemps N, Homes C C, Barr M C, Dagan Y and Greene R L 2004 Phys. Rev. B 70 132502
- [26] Homes C C, Lobo R P S M, Fournier P, Zimmers A and Greene R L 2006 Phys. Rev. B 74 214515
- [27] Kuzmenko A B 2005 Rev. Sci. Instrum. 76 083108
- [28] Gorshunov B P, Pronin A V, Volkov A A , Somal H S, van der Marel D, Feenstra B J, Jaccard Y and Locquet J-P 2012 Physica B 244 15
- [29] Santander-Syro A F, Lobo R P S M, Bontemps N, Lopera W, Giratá D, Konstantinovic Z, Li Z Z and Raffy H 2004 Phys. Rev. B 70 134504
- [30] Corson J, Orenstein J, Oh S, ODonnell J, Eckstein J N 2000 Phys. Rev. Lett. 85 2569
- [31] Allen J W and Mikkelsen J C 1977 Phys. Rev. B 15 2952
- [32] Puchkov A V, Basov D N and Timusk T 1996 J. Phys.: Condens. Matter 8 10049
- [33] Schachinger E, Homes C C, Lobo R P S M and Carbotte J P 2008 Phys. Rev. B 78 134522
- [34] Allen P B 1971 Phys. Rev. B 3 305
- [35] Schachinger E and Carbotte J P 2003 Extended Eliashberg Theory for d-wave Superconductivity and Application to Cuprates Models and Methods of High- Superconductivity: Some Frontal Aspects vol 2 (Horizons in World Physics vol 242) ed J K Srivastava and S M Rao (Hauppauge NY: Nova Science)
- [36] Schachinger E, Neuber D and Carbotte J P 2006 Phys. Rev. B 73 184507
- [37] Schachinger E, Tu J J and Carbotte J P 2003 Phys. Rev. B 67 214508
- [38] Hwang J, Schachinger E, Carbotte J P, Gao F, Tanner D B and Timusk T 2008 Phys. Rev. Lett. 100 137005
- [39] Prohammer M, Perez-Gonzalez A and Carbotte J P, 1993 Phys. Rev. B 47 15152
- [40] Formally, a very small full gap cannot be excluded, because we do not measure at temperatures below 2.5 K.
- [41] Dordevic S V, Singley E J, Basov D N, Komiya S, Ando Y, Bucher E, Homes C C and Strongin M 2002 Phys. Rev. B 65, 134511