High-precision photometric redshifts from Spitzer/IRAC: EXTREME [3.6]-[4.5] COLORS identify GALAXIES IN THE REDSHIFT RANGE
Abstract
One of the most challenging aspects of studying galaxies in the universe is the infrequent confirmation of their redshifts through spectroscopy, a phenomenon thought to occur from the increasing opacity of the intergalactic medium to Ly photons at . The resulting redshift uncertainties inhibit the efficient search for [C II] in galaxies with sub-mm instruments such as ALMA, given their limited scan speed for faint lines. One means by which to improve the precision of the inferred redshifts is to exploit the potential impact of strong nebular emission lines on the colors of galaxies as observed by Spitzer/IRAC. At , galaxies exhibit IRAC colors as blue as , likely due to the contribution of [O III]+H to the 3.6 flux combined with the absence of line contamination in the 4.5 band. In this paper we explore the use of extremely blue colors to identify galaxies in the narrow redshift window . When combined with an -dropout criterion, we demonstrate that we can plausibly select a relatively clean sample of galaxies. Through a systematic application of this selection technique to our catalogs from all five CANDELS fields, we identify 20 probable galaxies. We estimate that our criteria select the % strongest line emitters at and from the IRAC colors we estimate a typical [O III] rest-frame equivalent width of 1085 Å for this sample. The small redshift uncertainties on our sample make it particularly well suited for follow-up studies with facilities such as ALMA.
Subject headings
Galaxies: high-redshift — Galaxies: evolutionI. Introduction
Since the installation of the Wide Field Camera 3 (WFC3) on the Hubble Space Telescope (HST), numerous ultraviolet (UV) bright galaxies in the reionization era have been detected through their broadband photometric properties. These observations allow for the determination of the UV luminosity function (Bouwens et al., 2011; Lorenzoni et al., 2011; Oesch et al., 2012; Oesch et al., 2013; Oesch et al., 2014; Bradley et al., 2012; Bowler et al., 2012; Bowler et al., 2014; Schenker et al., 2013a; McLure et al., 2013; e.g.,) and the typical UV colors of galaxies out to (Stanway et al., 2005; Bouwens et al., 2009; Bouwens et al., 2012; Bouwens et al., 2013; Dunlop et al., 2012; Dunlop et al., 2013; Wilkins et al., 2011; Finkelstein et al., 2012).
In contrast to the success of identifying candidate galaxies out to with HST/WFC3 imaging, confirming the redshift of these sources with spectroscopy has proven very challenging due to the absorption of Ly photons by the neutral Intergalactic Medium (IGM) at (Pentericci et al., 2011; Treu et al., 2013; Finkelstein et al., 2013; Caruana et al., 2014; Schenker et al., 2014). This creates particular challenges for follow-up studies with the newest generation of sub-mm telescopes such as ALMA. ALMA has the potential to perform detailed studies of star formation rates (SFRs), kinematic structure, and energetics of galaxies through the direct detection of sub-mm fine structure lines such as [C II]157.7 (Carilli & Walter, 2013; e.g.). However, the frequency range that ALMA is able to scan in one tuning is relatively small, making follow-up studies with ALMA on sources without accurate redshift information observationally expensive.
One way to make progress in this area involves a search for the C III]1908 Å line in galaxies (Stark et al., 2014a; Stark et al., 2014b). This line has a typical rest-frame equivalent width (EW0) of Å in two galaxies where this line has been successfully located (Stark et al., 2014b) and in low-mass lensed star-forming galaxies at (Stark et al., 2014a). The challenge with this approach is the faintness of the C III] line and high density of sky lines in many regions of the near-infrared (IR) spectrum.
Another potentially promising way forward is to utilize the information provided by the Spitzer/IRAC. Recent studies have reported evidence for the presence of strong nebular emission lines such as H and [O III]5007 Å through the apparent impact of these lines on the IRAC 3.6 and 4.5 fluxes of galaxies (Schaerer & de Barros, 2009; Shim et al., 2011; Stark et al., 2013; Labbé et al., 2013; González et al., 2012; González et al., 2014; Smit et al., 2014). These lines appear to cause the colors of high redshift galaxies to vary significantly as a function of redshift. This results in modestly blue colors in galaxies, where both bands are contaminated by emission lines, very blue colors at , where only the 3.6 band suffers line contamination, and red colors for sources at redshifts , where the 4.5 band is contaminated (Labbé et al., 2013; Wilkins et al., 2013; Smit et al., 2014; Laporte et al., 2014).
In this paper we attempt to exploit the extreme IRAC colors galaxies exhibit at specific redshifts to isolate galaxies over a narrow range in redshift. To test this method, we utilize a large sample of galaxies identified from the CANDELS program (Grogin et al., 2011; Koekemoer et al., 2011). We select a sample of sources with extremely blue IRAC colors and show that these sources likely fall in the narrow redshift range . Ultimately, of course, this approach and the assumptions behind it will need to be tested through spectroscopy with the James Webb Space Telescope (JWST).
Additionally we discuss a few objects with blue colors that are clearly at from their HST photometry, and we suggest that these objects could be explained by high [O III]/H ratios such as found at (Schenker et al., 2013b; Holden et al., 2014).
This paper is organized as follows. §2 discusses our data set and photometric procedure. §3 presents the IRAC colors as a function of photometric redshift for a sample of UV-selected galaxies. §4 discusses the selection of extreme color galaxies, and §5 presents our galaxy sample. §6 gives a short summary of our results.
Throughout this paper we adopt a Salpeter IMF with limits 0.1-100 (Salpeter, 1955). For ease of comparison with previous studies we take and. Magnitudes are quoted in the AB system (Oke & Gunn, 1983)

II. Observations, photometry and sample
II.1. HST data and photometry
The primary sample of galaxies that we use in this paper was selected from the catalogs described by Bouwens et al. (2014). The purpose of this sample is to establish how the color of galaxies depends on redshift and also to establish the redshift distribution of galaxies with the most extreme IRAC colors. The catalogs were compiled from HST ACS ( and ) and WFC3/IR ( and ) data over the GOODS-N and GOODS-S fields. We also used the deep and wide-area observations obtained in the HUDF09+HUDF12 (Beckwith et al., 2006; Bouwens et al., 2011; Ellis et al., 2013; Illingworth et al., 2013), ERS (Windhorst et al., 2011) and CANDELS (Grogin et al., 2011; Koekemoer et al., 2011) programs as well as any archival HST observations over these fields. The shallow imaging was taken from the 3D-HST survey (Brammer et al., 2012a) and A Grism H-Alpha Spectroscopic survey (AGHAST, PI:Weiner). The procedure for reducing the data is described in detail by Illingworth et al. (2013) and Bouwens et al. (2014).
A secondary sample of galaxies is used to increase the number of and galaxies in our selection. We derived this sample from the HST data over the CANDELS-UDS, CANDELS-COSMOS, and CANDELS-EGS fields ( and , for more details on the CANDELS fields see Koekemoer et al. 2011 and Skelton et al. 2014) and deep - and -band ground-based observations from CFHT and Subaru (Capak et al., 2007; Furusawa et al., 2008).
An overview of all fields, bands and depths is given in Table 1 of Bouwens et al. (2014). Both the ACS and WFC3/IR data reach total magnitudes of at 5, using as a basis the flux uncertainties on the total magnitude measurements for the faintest 20% of galaxies from the Bouwens et al. (2014) catalogs over these fields. Our total search area over all the fields is 720 arcmin2.
The photometry followed the procedure described by Bouwens et al. (2012). In short, we ran an adapted version of the Source Extractor software (Bertin & Arnouts, 1996) in dual-image mode. The detection images were created by combining all deep bands redwards of the Lyman break (i.e., and ) into a square-root image (Szalay et al., 1999). After matching the observations to the -band point spread function (PSF), colors and total magnitudes were measured in Kron-like apertures with Kron factors 1.6 and 2.5 respectively (defined on the -band).
II.2. Spitzer/IRAC data and photometry
The first part of our Spitzer/IRAC data set covers all five CANDELS fields with the 3.6 and 4.5 bands11 1 http://irsa.ipac.caltech.edu/data/SPITZER/docs/ irac/calibrationfiles/spectralresponse/ from the Spitzer Extended Deep Survey (SEDS, PI: Fazio) and all available archival data sets from before 2011 (Ashby et al., 2013). We complement this data set with the new deep IRAC imaging from the Spitzer Very Deep Survey (S-CANDELS) Exploration Science Project (Ashby et al., submitted), which brings the IRAC coverage up to 50 hours in depth (26.8 mag at 5 in the 3.6 band). For the sources in the HUDF, we utilize additional data from the IRAC Ultra Deep Field (Labbé et al., 2013; IUDF:) program.
Before performing photometry on the sources in our sample, we removed the contamination of foreground sources with an automated cleaning procedure (Labbé et al., 2010a; Labbé et al., 2010b). In short, the HST images provided a high-spatial resolution template with which to model the positions and flux profiles of the foreground sources. The light profiles of individual sources in the HST image were convolved with a kernel to match the IRAC PSF and then simultaneously fitted to the IRAC image within a region of arcseconds around the sources from our sample. We subtracted the flux from the foreground galaxies and performed photometry in 20-diameter circular apertures on the resulting images. We applied a correction to account for the flux outside of the aperture, given by the ratio of the flux enclosed in the photometric aperture in the HST image (before convolution) to the IRAC model (after convolution). This correction ranges from to , depending on the size of the source. The local noise was estimated from the clean background on a residual IRAC image from which all sources were subtracted. Our procedure for deblending can fail when contaminating sources are too bright or too close to the central source. We removed sources from our sample with a high parameter determined from the residual IRAC image (see §II.3).
II.3. Base sample of galaxies
In this section, we present the base sample of galaxies we use to study how the IRAC colors of star-forming galaxies depend upon redshift. We selected our sources from which we measure IRAC colors in the rest-frame UV, adopting the Lyman-break technique (Steidel et al., 1999) with the requirement that the source drops out in the band. Specifically, our requirements for Lyman Break Galaxies (LBGs) were
| (1) |
where indicates logical AND. We chose the and band fluxes for our identification of Lyman Break galaxies, instead of more closely spaced passbands like and , in order to select galaxies over a relatively extended redshift range to (without any gaps) and to use filters that are available over all five CANDELS fields for a more uniform selection. Information from the more closely spaced bandpasses was nevertheless utilised in deriving photometric redshifts for sources from our selection and hence determining the relationship between the IRAC colors of sources and their redshifts.
We also required sources to have either a non-detection in the band () or to have a very strong Lyman break, i.e., . Furthermore, we required sources to be undetected () in the available -band data over GOODS North and South or, in the case of the CANDELS UDS, COSMOS, or EGS fields, to be undetected () in the statistic image Bouwens et al. (2014) derived from the ground-based and images. We required the SExtractor stellarity parameter (equal to 0 and 1 for extended and point sources, respectively) in the band be less than 0.92 to ensure that our selection is largely free of contamination by stars (Holwerda et al., 2014; e.g.). Moreover, the blue IRAC color criterion introduced in §II.3 also selects effectively against contamination from brown dwarfs in our Milky Way (Kirkpatrick et al. 2011,Holwerda et al., in prep). We selected sources with a signal-to-nose ratio , and additionally we required and , where is the measured flux density in the band and and are the estimated uncertainties in the 3.6 and 4.5 band fluxes. Our chosen requirements explicitly do not include a dependence on the observed flux in the IRAC bands to ensure that our results are not biased according to the emission line flux in our candidates. In practice, most high-redshift sources exhibit a somewhat red UV-to-optical color (González et al., 2012), and as a result 75% of our sample is detected at in the 3.6 IRAC band. We exclude those % of the sources that show strong residuals in the IRAC images after our deblending procedure (§II.2), which results in a final sample of 220 sources in GOODS-N/S and 224 sources in CANDELS-EGS/UDS/COSMOS.
III. color vs. redshift
Before moving onto a discussion of how the IRAC color might be used to refine redshift determinations for specific selections, it is useful to quickly assess whether our sample agrees with our main assumption: that the color is strongly influenced by the presence of strong nebular emission lines such as H and [O III] in the IRAC filters. To this end we explore the variation of the median color as a function of redshift for our sample.
Figure 1 shows the colors of our GOODS-N/S sample as a function of the photometric redshift, as derived from the HST broadband photometry. We used the software Easy and Accurate Zphot from Yale (Brammer et al., 2008; EAZY;) to estimate photometric redshifts for the galaxies in our sample. We used the standard template set of EAZY, but we complemented these templates with a number of templates generated with Galaxy Evolutionary Synthesis Models (Kotulla et al., 2009; GALEV;), which includes nebular continuum and emission lines as described by Anders & Fritze-v. Alvensleben (2003). Additionally we included a template with an [O III]4959,5007 Å/H ratio of 10 to match the most extreme line ratios observed in spectroscopy of galaxies at lower redshifts (Amorín et al., 2012; Brammer et al., 2012b; Jaskot & Oey, 2013; Schenker et al., 2013b; van der Wel et al., 2013; Holden et al., 2014; Steidel et al., 2014). No use of the Spitzer/IRAC photometry is made in the photometric redshift determination to avoid coupling between our redshift estimates and the measured IRAC fluxes. We do not include sources from our EGS/UDS/COSMOS sample in Figure 1 because of the lack of deep HST coverage in the and bands, which is needed for obtaining sufficiently accurate redshifts for the analysis we describe.


We observe a clear discontinuity in the median color (red points) around , where the [O III] emission line moves from the 3.6 to the 4.5 band. Moreover, we find the bluest median color at , where [O III] boosts the 3.6 flux while H has already moved out of the 4.5 band. This suggests that the IRAC colors are strongly influenced by emission lines, in agreement with recent studies (Schaerer & de Barros, 2009; Shim et al., 2011; Stark et al., 2013; Labbé et al., 2013; González et al., 2012; González et al., 2014; Smit et al., 2014) and in agreement with predictions of stellar population synthesis models with emission lines. We can use this information to improve our determinations of the redshift probability functions for strong line emitters by including the IRAC fluxes in our photometric redshift estimates.
IV. Ultra-blue galaxies
In the previous section we showed how the IRAC color would likely change as the [O III] and H nebular lines move in and out of the photometric bands, due to the redshifting spectrum. We can use this information to significantly improve our photometric redshift estimates. This is important due to the considerable challenges involved in improving redshift estimates through spectroscopy (largely due to the impact of the more neutral IGM on the prevalence of Ly emission in galaxies).
IV.1. Blue sources at
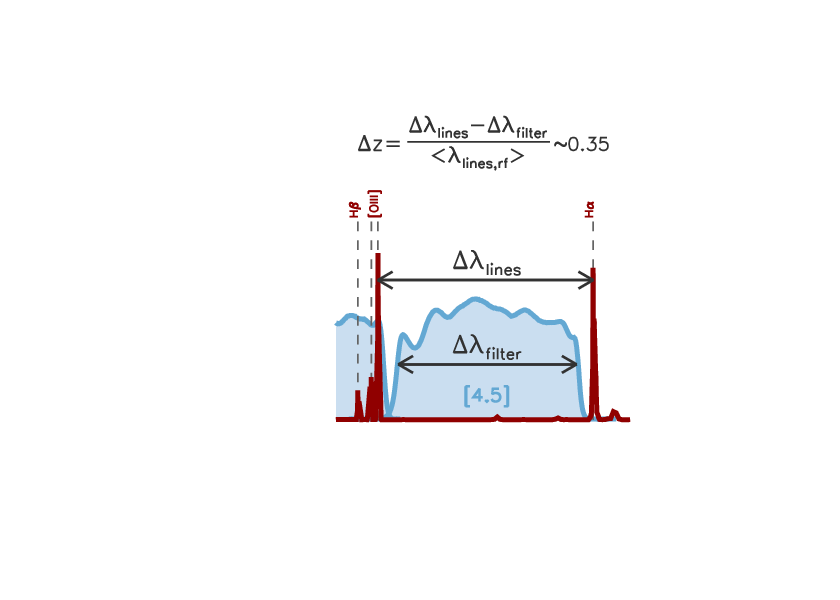
A particularly interesting redshift interval is , where we expect extreme colors due to the presence of the [O III] line in the 3.6 band and the absence of any strong emission lines in the 4.5 band. This is illustrated in Figure 2. Because the H to [O III] line separation () at is slightly wider than the 4.5 filter width (), there is very narrow redshift range in which the 4.5 band is free of strong emission lines. In practice, the effective redshift range where we can observe the extremely blue IRAC colors is even narrower than this, i.e., , because the relevant wavelength is where [O III] leaves the 3.6 filter, not where this line enters the 4.5 filter (see the top panel of Figure 1).
To investigate whether the selection of sources with blue colors can be used to unambiguously identify galaxies at , we collected a sample of emission line candidate galaxies by selecting sources with colors significantly bluer than mag. We adopted the criterion
| (2) |
This criterion indicates that the sources in our selection have a probability (P) of at least 84% to have a true IRAC color bluer than , based on the uncertainties in the 3.6 and 4.5 fluxes. We show the galaxies meeting this color criterion in Figure 3. A color cut in the color can identify galaxies with strong emission lines in the redshift range , but a galaxy with more moderate emission lines and very blue continuum colors can also meet the criterion.
We purposely decided to try to select galaxies based on a color criterion rather than fitting emission line templates to the IRAC bands to obtain photometric redshifts. This was done to avoid a dependence on the SED template set and the assumed line ratios in these templates. Since the physical properties of the H II regions in star-forming galaxies, such as gas metallicity and gas density, strongly influence the line ratios we observe (Kewley et al., 2013; e.g.) we wanted to avoid having our results implicitly depend on these ratios.
Over the 270 arcmin2 CANDELS/ERS region of GOODS- North and GOODS-South, 13 sources satisfy this criterion out of the 220 sources from our base sample. We indicate these in the top panel of Figure 3 and show a histogram in the bottom panel of Figure 3. Furthermore there are 15 sources out of 224 sources from the base sample over a 450 arcmin2 area in the CANDELS-EGS/CANDELS-UDS/CANDELS-COSMOS fields that meet the criterion, but we do not present them in Figure 3 due to the greater difficulty in determining their photometric redshifts.
We identify a large number of blue sources that are broadly consistent with a , similar to the sources found by Smit et al. (2014). For these galaxies the extreme colors are explained by the likely scenario that the [O III] emission dominates the 3.6 flux while at the same time the 4.5 flux is free of emission line contamination. Interestingly enough, Figure 3 indicates there might be a few sources at slightly lower redshift (at instead of at ) with such blue IRAC colors; we will discuss these sources in §IV.2.
Figure 4 shows four examples of blue sources in GOODS-N/S that are consistent with a from their HST photometry only. We present the redshift probability function using only the HST bands and also when using constraints from both Spitzer/IRAC and HST. Due to their extreme colors we can place very tight constraints on the photometric redshift of these galaxies.
This is particularly useful for follow-up studies to obtain line detections with sub-mm detectors such as ALMA. Line detections with interferometer arrays are inherently limited in frequency space by the capabilities of the correlator. ALMA can roughly observe GHz in one tuning in band 6 (211-275 GHz)22 2 A. Lundgren, 2013, ALMA Cycle 2 Technical Handbook Version 1.1, ALMA, ISBN 978-3-923524-66-2. As a reference we indicate the frequency of the bright [C II]157.7 line at a given redshift in Figure 4 and we indicate the frequency range that ALMA can observe in two frequency tunings. With only twice the observing time required with respect to spectroscopically confirmed sources, we can typically search the % probability window for [C II] emission in these sources.
The selection of galaxies at is also of interest for deriving stellar masses of high-redshift galaxies using Spitzer/IRAC constraints (Eyles et al., 2005; Eyles et al., 2007; Yan et al., 2005; Yan et al., 2006; Labbé et al., 2006; Labbé et al., 2010b; Yabe et al., 2009; Stark et al., 2009; González et al., 2010; González et al., 2011; Curtis-Lake et al., 2013). In particular, the redshift range provides us with the only opportunity beyond to measure the rest-frame optical stellar continuum without the contamination of nebular line emission in the 4.5 band, allowing for more accurate stellar mass and specific star formation rate estimates (Smit et al., 2014; e.g.,).
IV.2. Blue sources at
In the previous section we showed that a large number of sources with ultra-blue colors very likely have redshifts in the narrow range , where the blue colors can be easily explained by the presence of [O III] in the 3.6 band, in contrast to the 4.5 band that contains no strong line emission.
Figure 3 also shows a number of very blue sources that prefer a redshift around and that have a probability of less than of being at (based on the photometric redshift probability distribution using only HST bands). In the redshift range , [O III] still contaminates the 3.6 band, but the strong H line also boosts the 4.5 flux. Both lines are expected to be strong in young, actively star-forming galaxies, and therefore it is unclear what the explanation is for the significant spread in colors and in particular the very blue colors observed for a small fraction of the population. While galaxies containing Active Galactic Nuclei (AGN) can exhibit extremely high [O III]/H ratios, this phenomenon is rare in local galaxies with stellar masses below (Juneau et al., 2013; e.g.,). For our sample of star-forming galaxies at , with UV-luminosities ranging from to , we expect nearly all sources to have stellar masses below this limit (González et al., 2011; Salmon et al., 2014; e.g.,). However, we cannot completely rule out this option based on the limited photometric information available for these sources.


Figure 5 shows two examples of sources that are at at high confidence. One source has an IRAC color of but a photometric redshift of ; the other source has an IRAC color of but a photometric redshift of . In both cases, we clearly cannot use the IRAC colors alone to distinguish between these sources and the sources from Figure 4, which strongly prefer a redshift around .
One effect that could influence our estimated photometric redshifts for these objects – and possibly offer an explanation for their blue colors – is the presence of high EW Ly emission in these galaxies. For example Schenker et al. (2014) show that a 160Å EW Ly line can cause the photometric redshift of a galaxy to be underestimated by as much as , suggesting that our blue sample may actually be at higher redshift. Though our templates do not include strong Ly lines, searches for Ly have shown a low abundance of Ly emission at (Pentericci et al., 2011; Treu et al., 2013; Finkelstein et al., 2013; Caruana et al., 2014; Schenker et al., 2014), and even at lower redshifts high-EW Ly is rarely detected in UV bright () galaxies (Stark et al., 2010; e.g.). Therefore it seems unlikely to suppose that these blue sources with are actually galaxies with strong Ly emission.
In order to understand the origin of these extreme IRAC colors at we compare the color distribution of these sources with the colors we would predict based on a sample of galaxies with near-IR spectroscopy in Figure 6. In the top panel of Figure 6 we show the sub-sample of sources that (with 68% confidence) have a redshift in the range , where [O III] emission contaminates the 3.6 band while at the same time H emission contaminates the 4.5 band (see the top panel of Figure 1). In the bottom panel of Figure 6 we show a prediction of the color distribution from the spectroscopic properties of [O III] and H in LBGs as listed by Schenker et al. (2013b) and Holden et al. (2014). These authors find line ratios as high as [O III]4959,5007 Å/H. This strong [O III] flux with respect to the hydrogen Balmer lines could result in very blue colors if similar sources are present at . We computed the predicted colors from the observed [O III]4959,5007 Å EW and an estimate of the H EW derived from the H EW, assuming case B recombination and a flat continuum in . For and assuming all sources are at , the [O III] and H EWs allow for a direct calculation of the colors such as shown in the bottom panel of Figure 6.

The spread in colors in the predicted distribution is smaller than the spread in the observed distribution at . Even when accounting for the spread in due to the observational uncertainties in the IRAC bands, the intrinsic spread exceeds the width of the predicted distribution (see the error bars in the top panel of Figure 6). However, this is likely explained by the spread in the color of the underlying continuum emission due to different dust content and ages of the galaxies in the observed distribution, while we assumed a fixed flat continuum in for our predicted colors. A somewhat evolved population (300 Myr) and modest dust content () could redden the IRAC color of some of the observed galaxies by (see Figure 6). Similarly, the color of the continuum can be as blue as mag for a very young (Myr) and dust-free galaxy.


Another effect that can change the predicted color distribution is a probable evolution of the emission line EWs between and , e.g., because we are observing increasingly younger generations of galaxies. Assuming all line EWs follow the evolution of the H EW derived by Fumagalli et al. (2012) for star-forming galaxies in the redshift range , the predicted spread in color would increase, while the median predicted color would be bluer by .
From the above comparison we conclude that the blue sources at (indicated with the blue histogram in the top panel of Figure 6) can be explained by the high [O III]/H values observed in LBGs and a blue continuum color as seen in young galaxies with low dust content and low metallicity, possibly in combination with an evolving EW strength of nebular emission lines as a function of redshift.
V. A fiducial sample of emission line galaxies
In this section we will present a strategy for the efficient use of HST+IRAC information to select galaxies over the redshift range . In §IV.1 we showed that sources at have very blue colors and that we can use this information to significantly reduce the uncertainty on the redshift determination. However, we also found that a small number of galaxies at show extremely blue colors as well and we cannot distinguish these sources from galaxies in the redshift range on the basis of the IRAC colors alone.
V.1. Selection of our fiducial sample
In order to much more effectively isolate galaxies in the narrow redshift range , we require an additional selection criterion besides our color cut (Eq. 2). For our fiducial sample we require that sources show a significant break across the and bands:
| (3) |
If is undetected we use the 1 upper limit to compute the color. This dropout criterion should effectively exclude the contaminating galaxies from our target selection (see Figure 7). We will separately select ultra-blue galaxies using a criterion.
We apply the criteria given by Eq. 2 and Eq. 3 to our photometric catalogs of sources in all five CANDELS fields (Bouwens et al., 2014) and find 20 sources in our fiducial sample and 8 sources that are likely at lower redshift. We summarize the properties of the fiducial sample and the sources that satisfy Eq. 2 but not Eq. 3 in Table 1, and we show postage stamps of the sources in Figures 8 and 9. The typical width of the 68% redshift confidence intervals for the sources in our fiducial sample as given by P() is .
V.2. Ascertaining the mean redshift and contamination fraction of the sample
To test the robustness of our selection we stacked the sources from GOODS-N/S selected by Eq. 2 and 3 and we show the resulting spectral energy distibution (SED) in Figure 10. We estimate the mean redshift for our selected sources from the stacked photometry. We emphasize that we do not use our flux measurements in the , 3.6 and 4.5 bands, due to flux measurements in these bands playing an important role in the selection of the sources themselves; this should ensure that our derived redshift is not significantly biased by the selection process itself. We find a photometric redshift of , consistent with the redshift range . Since the measured flux in the band was also used in the selection of individual sources, it could have a minor effect on the estimated redshift for the stacked photometry. Excluding the -band flux measurements in deriving the best-fit redshift, gives a photometric redshift of .
As a test of the robustness of our blue IRAC selection criterion (Eq. 2) against scatter in the color due to the uncertainties in the 3.6 and 4.5 flux measurements, we simulated the photometric scatter assuming an intrinsic IRAC color for all sources from the five CANDELS fields in our base sample. We simulated the observed colors by adding noise to the 3.6 and 4.5-band fluxes, that match the measured flux uncertainties (1000 per source). From this simulation we conclude that less than 0.1 source with an intrinsic IRAC color has scattered into our fiducial selection over all five CANDELS fields.
The only significant source of interlopers to our fiducial sample of galaxies would seem to arise from galaxies at . To quantify this interloper fraction, we first estimate the fraction of ultra-blue sources at from Figure 6, which is 6%. From the bottom panel of Figure 3 (see also Table 1) we find that sources in our fiducial sample have estimated redshifts as far as away from our desired redshift range . We therefore assume that galaxies cannot be completely removed from our fiducial sample using our color criterion (Eq. 3) and could potentially be contaminating our sample. Multiplying those sources from our base sample of galaxies from all five CANDELS fields (§II.3) with by the 6% fraction with ultra-blue IRAC colors, we estimate that sources could have scattered into our fiducial sample from . We therefore conservatively estimate that % of the 20 sources with extreme IRAC colors and colors (Table 1) lie in the redshift range .
Furthermore, comparing the 20 galaxies from our , IRAC ultra-blue sample (90% of which we estimated to lie in this redshift range: see previous paragraph) with the 35 galaxies estimated to lie in the redshift range from the redshifts of our base sample, we estimate that 50% of all sources at exhibit ultra-blue colors (vs. 6% at ). This makes IRAC ultra-blue sources roughly times more common at than at . This is useful to establish, since it indicates that ultra-blue IRAC criteria - such as we propose - can potentially improve the purity of selections by up to a factor of 8 over what one would manage using HST and ground-based observations alone.
V.3. Quantifying the rest-frame EWs of [O III]+H in our IRAC ultra-blue sample
Using the assumption that the 4.5 band is free of emission line contamination at while the 3.6 band is contaminated by [O III] and H, we can make a prediction of the [O III] strength and estimate the fraction of high-EW [O III] emitters in the high redshift galaxy population. The median color of our sample is , indicating a typical rest-frame EW0([O III]+H Å (Smit et al., 2014; see).
In order to obtain a more accurate measurement of the [O III] EW, we calculated the difference between the contaminated 3.6 flux and an estimate of the rest-frame optical continuum flux. The continuum flux was estimated by fitting the SEDs of the galaxies with stellar population templates using the Fitting and Assessment of Synthetic Templates (FAST) code (Kriek et al., 2009). In the fitting procedure we used stellar population templates by Bruzual & Charlot (2003) and constant star formation histories with ages between 30 Myr and the age of the Universe at . We assumed a Salpeter (1955) IMF with limits and a Calzetti et al. (2000) dust law. We considered dust contents between and subsolar metallicities between 0.2 and 0.4. We only considered the HST and the 4.5 IRAC photometry in deriving our best-fit model, while excluding the measured 3.6 fluxes (due to their being impacted by the [O III]+H lines). We used the best fit templates from our fitting procedure to obtain an estimate of the 3.6 continuum flux and from this we derived the rest-frame EW of the combined [O III]4959,5007 Å+H lines.

Our estimates of rest-frame EW0([O III]+H) are listed in table 1 and range from Å to Å with a median of 1375 Å. Though the uncertainties on the EWs are too large for the Å EW measurements to be secure, we estimate rest-frame EWs as high as Å in the majority of our selected sources. Nevertheless, we note that the median EW we derive here will be biased towards high values because we are using the same color measurements to derive the EWs as we used for the selection. We estimate this bias by investigating the selection process in a distribution of galaxies with an intrinsic IRAC color and simulated the noise in the 3.6 and 4.5 bands based on the measured flux uncertainties. We selected 50% of the sources with the bluest simulated colors (in agreement with our estimates in §V.2) and found these sources have a median . Using this color bias and eq. 1 and 2 from Smit et al. (2014) and assuming a flat continuum in for these sources, we estimate an observed bias of Å on the measured [O III]+H EW of 1375 Ådue to the noise in the IRAC bands. This suggests that the median EW of our selected sources is really 1085 Å in the noise-free case.
We show the predicted [O III] distribution of our sample in Figure 11. We compare this distribution with the EW distribution from the seven lensed sources selected in the redshift range reported by Smit et al. (2014) and comparable intrinsic UV luminosities. We use the same procedure to derive EWs for these sources as described in the paragraph above. For one source we use the 1 upper limit due to the high uncertainties in the IRAC photometry. The comparison between the two distributions confirms that our suggested critera for selecting sources rougly selects the % most extreme line emitters at that redshift.
The median UV luminosity of our sample (computed from the -band fluxes and assuming ) is , roughly comparable to the from the luminosity function derived by Bouwens et al. (2014). Combining this information with our calculation in §V.2 we argue that roughly % of the galaxy population at produces extreme nebular emission lines (EW0([O III]+H Å) in the rest-frame optical.
It is interesting to compare these derived EWs to the observed [O III] EW distribution at reported by Schenker et al. (2013b) and Holden et al. (2014). In order to match our sample, we use only the 50% most extreme emitters from the combined Schenker et al. (2013b) and Holden et al. (2014) samples and calculate a median [O III] Å (with a median redshift ). Comparing this number to the mean EW at and assuming the evolution of nebular emission line EWs scales as (Fumagalli et al., 2012; see), we derive [O III]. This slope is consistent with the slope derived by Fumagalli et al. (2012) for H EWs over the redshift range () but somewhat steeper than the slope derived by Labbé et al. (2013), who found over the redshift range .
VI. Summary and Discussion
In this paper we explore the use of IRAC colors to select star-forming galaxies in the narrow redshift range . Sources in this redshift range are expected to be very blue due to the boosted flux in the 3.6 band from high-EW [O III] emission, while the 4.5 band is free from contamination of strong nebular emission lines. This suggests a blue IRAC criterion may be appropriate for selecting galaxies in the redshift range .
In evaluating the suitability of such a selection criterion we analyze a large sample of Lyman Break galaxies in GOODS-N and GOODS-S with relatively high Spitzer/IRAC coverage from the Spitzer GOODS, ERS, and S-CANDELS programs (Ashby et al., submitted). We find that the majority of candidates with extremely blue colors are consistent with . In addition to the sources, we also find a small number of sources with extreme colors more likely to be at . The blue galaxies at can be explained by high [O III]/H ratios, such as found in LBGs (Schenker et al., 2013b; Holden et al., 2014), lensed galaxies at (Brammer et al., 2012b; van der Wel et al., 2013), and in Green Pea galaxies at (Amorín et al., 2012; Jaskot & Oey, 2013) in combination with blue colors for the optical continuum.
To obtain a clear selection in the redshift range , we suggest the use of ultra-blue IRAC colors combined with an dropout criterion. Based on our analysis in section §V, we estimate that at least 90% of the sources selected by these criteria lie in the redshift range . We systematically apply such criteria to our source catalogs from the five CANDELS fields (720 arcmin2) and find 20 sources ( arcmin-2). A comparison with the total number of galaxies from our catalogs in this redshift range suggests that we select the % bluest IRAC sources at at a typical UV-luminosity .
We estimate a median uncertainty on the redshift estimates for our fiducial sources of (68% confidence). Such redshift uncertainties are significantly smaller than one finds for these objects without the inclusion of the IRAC fluxes. For example, we find a median 68% confidence interval on of and , respectively, for sources in GOODS-N/S and COSMOS/EGS/UDS. Among other uses, such tight constraints on the redshifts are necessary for efficient observations with ALMA. Our constraints on the redshift of these sources means that we should typically only require two ALMA tunings to successfully observe [C II]157.7 in band 6.
Using our fiducial sample of sources with ultra-blue colors, we estimate the strength of [O III]4959,5007 Å+H from the contaminated 3.6 flux. We find that the majority of the sources in our sample show EWs as high as EW0([O III]+H Å, in excellent agreement with the % most extreme sources from Smit et al. (2014).
Given the recent study by Stark et al. (2014a), who found evidence for strong [O III]4959,5007 Å emission in sources with high-EW C III]1908 Å lines at , it seems reasonable to suppose that our strong [O III] emitters also exhibit relatively strong C III] lines, and therefore our sources are excellent targets for follow-up studies with near-IR spectroscopy (Stark et al., 2014b; e.g.).
Finally, with the future launch of the JWST, we will be able to target these extreme line-emitter galaxies with JWST’s near infrared spectrograph (NIRSpec). The [O III]5007 Å line in a typical galaxy from our sample should be detected at 10 in the JWST/NIRSpec mode with a mere 60 second exposure.
References
- Amorín et al. (2012) Amorín, R., Pérez-Montero, E., Vílchez, J. M., & Papaderos, P. 2012, ApJ, 749, 185
- Anders & Fritze-v. Alvensleben (2003) Anders, P., & Fritze-v. Alvensleben, U. 2003, A&A, 401, 1063
- Ashby et al. (2013) Ashby, M. L. N., Willner, S. P., Fazio, G. G., et al. 2013, ApJ, 769, 80
- Ashby et al. (submitted) Ashby, M. L. N., Willner, S. P., Fazio, et al. ApJS, submitted
- Beckwith et al. (2006) Beckwith, S. V. W., Stiavelli, M., Koekemoer, A. M., et al. 2006, AJ, 132, 1729
- Bertin & Arnouts (1996) Bertin, E., & Arnouts, S. 1996, A&AS, 117, 393
- Bouwens et al. (2009) Bouwens, R. J., Illingworth, G. D., Franx, M., et al. 2009, ApJ, 705, 936
- Bouwens et al. (2011) Bouwens, R. J., Illingworth, G. D., Oesch, P. A., et al. 2011, ApJ, 737, 90
- Bouwens et al. (2012) Bouwens, R. J., Illingworth, G. D., Oesch, P. A., et al. 2012, ApJ, 754, 83
- Bouwens et al. (2013) Bouwens, R. J., Illingworth, G. D., Oesch, P. A., et al. 2013, ApJ, 793, 115
- Bouwens et al. (2014) Bouwens, R. J., Illingworth, G. D., Oesch, P. A., et al. 2014, ApJ, submitted, arXiv:1403.4295
- Bowler et al. (2012) Bowler, R. A. A., Dunlop, J. S., McLure, R. J., et al. 2012, MNRAS, 426, 2772
- Bowler et al. (2014) Bowler, R. A. A., Dunlop, J. S., McLure, R. J., et al. 2014, MNRAS, 440, 2810
- Bradley et al. (2012) Bradley, L. D., Trenti, M., Oesch, P. A., et al. 2012, ApJ, 760, 108
- Brammer et al. (2008) Brammer, G. B., van Dokkum, P. G., & Coppi, P. 2008, ApJ, 686, 1503
- Brammer et al. (2012a) Brammer, G. B., van Dokkum, P. G., Franx, M., et al. 2012a, ApJS, 200, 13
- Brammer et al. (2012b) Brammer, G. B., Sánchez-Janssen, R., Labbé, I., et al. 2012b, ApJ, 758, L17
- Bruzual & Charlot (2003) Bruzual, G., & Charlot, S. 2003, MNRAS, 344, 1000
- Capak et al. (2007) Capak, P., Aussel, H., Ajiki, M., et al. 2007, ApJS, 172, 99
- Carilli & Walter (2013) Carilli, C. L., & Walter, F. 2013, ARA&A, 51, 105
- Caruana et al. (2014) Caruana, J., Bunker, A. J., Wilkins, S. M., et al. 2014, MNRAS, 443, 2831
- Coe et al. (2006) Coe, D., Benítez, N., Sánchez, S. F., et al. 2006, AJ, 132, 926
- Calzetti et al. (2000) Calzetti, D., Armus, L., Bohlin, R. C., et al. 2000, ApJ, 533, 682
- Curtis-Lake et al. (2013) Curtis-Lake, E., McLure, R. J., Dunlop, J. S., et al. 2013, MNRAS, 429, 302
- Dunlop et al. (2012) Dunlop, J. S., McLure, R. J., Robertson, B. E., et al. 2012, MNRAS, 420, 901
- Dunlop et al. (2013) Dunlop, J. S., Rogers, A. B., McLure, R. J., et al. 2013, MNRAS, 432, 3520
- Ellis et al. (2013) Ellis, R. S., McLure, R. J., Dunlop, J. S., et al. 2013, ApJ, 763, L7
- Eyles et al. (2005) Eyles, L. P., Bunker, A. J., Stanway, E. R., et al. 2005, MNRAS, 364, 443
- Eyles et al. (2007) Eyles, L. P., Bunker, A. J., Ellis, R. S., et al. 2007, MNRAS, 374, 910
- Finkelstein et al. (2012) Finkelstein, S. L., Papovich, C., Salmon, B., et al. 2012, ApJ, 756, 164
- Finkelstein et al. (2013) Finkelstein, S. L., Papovich, C., Dickinson, M., et al. 2013, Nature, 502, 524
- Fumagalli et al. (2012) Fumagalli, M., Patel, S. G., Franx, M., et al. 2012, ApJ, 757, L22
- Furusawa et al. (2008) Furusawa, H., Kosugi, G., Akiyama, M., et al. 2008, ApJS, 176, 1
- González et al. (2010) González, V., Labbé, I., Bouwens, R. J., et al. 2010, ApJ, 713, 115
- González et al. (2011) González, V., Labbé, I., Bouwens, R. J., et al. 2011, ApJ, 735, L34
- González et al. (2012) González, V., Bouwens, R. J., Labbé, I., et al. 2012, ApJ, 755, 148
- González et al. (2014) González, V., Bouwens, R., Illingworth, G., et al. 2014, ApJ, 781, 34
- Grogin et al. (2011) Grogin, N. A., Kocevski, D. D., Faber, S. M., et al. 2011, ApJS, 197, 35
- Holden et al. (2014) Holden, B. P., Oesch, P. A., Gonzalez, V. G., et al. 2014, ApJ, submitted, arXiv:1401.5490
- Holwerda et al. (2014) Holwerda, B. W., Trenti, M., Clarkson, W., et al. 2014, ApJ, 788, 77
- Ilbert et al. (2013) Ilbert, O., McCracken, H. J., Le Fèvre, O., et al. 2013, A&A, 556, A55
- Illingworth et al. (2013) Illingworth, G. D., Magee, D., Oesch, P. A., et al. 2013, ApJS, 209, 6
- Jaskot & Oey (2013) Jaskot, A. E., & Oey, M. S. 2013, ApJ, 766, 91
- Juneau et al. (2013) Juneau, S., Dickinson, M., Bournaud, F., et al. 2013, ApJ, 764, 176
- Kewley et al. (2013) Kewley, L. J., Dopita, M. A., Leitherer, C., et al. 2013, ApJ, 774, 100
- Kirkpatrick et al. (2011) Kirkpatrick, J. D., Cushing, M. C., Gelino, C. R., et al. 2011, ApJS, 197, 19
- Koekemoer et al. (2011) Koekemoer, A. M., Faber, S. M., Ferguson, H. C., et al. 2011, ApJS, 197, 36
- Kotulla et al. (2009) Kotulla, R., Fritze, U., Weilbacher, P., & Anders, P. 2009, MNRAS, 396, 462
- Kriek et al. (2009) Kriek, M., van Dokkum, P. G., Labbé, I., et al. 2009, ApJ, 700, 221
- Labbé et al. (2006) Labbé, I., Bouwens, R., Illingworth, G. D., & Franx, M. 2006, ApJ, 649, L67
- Labbé et al. (2010a) Labbé, I., González, V., Bouwens, R. J., et al. 2010a, ApJ, 716, L103
- Labbé et al. (2010b) Labbé, I., González, V., Bouwens, R. J., et al. 2010b, ApJ, 708, L26
- Labbé et al. (2013) Labbé, I., Oesch, P. A., Bouwens, R. J., et al. 2013, ApJ, 777, L19
- Laporte et al. (2014) Laporte, N., Streblyanska, A., Clement, B., et al. 2014, A&A, 562, L8
- Lorenzoni et al. (2011) Lorenzoni, S., Bunker, A. J., Wilkins, S. M., et al. 2011, MNRAS, 414, 1455
- McLure et al. (2013) McLure, R. J., Dunlop, J. S., Bowler, R. A. A., et al. 2013, MNRAS, 432, 2696
- Oesch et al. (2012) Oesch, P. A., Bouwens, R. J., Illingworth, G. D., et al. 2012, ApJ, 745, 110
- Oesch et al. (2013) Oesch, P. A., Bouwens, R. J., Illingworth, G. D., et al. 2013, ApJ, 773, 75
- Oesch et al. (2014) Oesch, P. A., Bouwens, R. J., Illingworth, G. D., et al. 2014, ApJ, 786, 108
- Oke & Gunn (1983) Oke, J. B., & Gunn, J. E. 1983, ApJ, 266, 713
- Ouchi et al. (2009) Ouchi, M., Ono, Y., Egami, E., et al. 2009, ApJ, 696, 1164
- Ouchi et al. (2013) Ouchi, M., Ellis, R., Ono, Y., et al. 2013, ApJ, 778, 102
- Pentericci et al. (2011) Pentericci, L., Fontana, A., Vanzella, E., et al. 2011, ApJ, 743, 132
- Salmon et al. (2014) Salmon, B., Papovich, C., Finkelstein, S. L., et al. 2014, ApJ, submitted, arXiv:1407.6012
- Salpeter (1955) Salpeter, E. E. 1955, ApJ, 121, 161
- Schaerer & de Barros (2009) Schaerer, D., & de Barros, S. 2009, A&A, 502, 423
- Schenker et al. (2013a) Schenker, M. A., Robertson, B. E., Ellis, R. S., et al. 2013a, ApJ, 768, 196
- Schenker et al. (2013b) Schenker, M. A., Ellis, R. S., Konidaris, N. P., & Stark, D. P. 2013b, ApJ, 777, 67
- Schenker et al. (2014) Schenker, M. A., Ellis, R. S., Konidaris, N. P., & Stark, D. P. 2014, ApJ, 795, 20
- Shim et al. (2011) Shim, H., Chary, R.-R., Dickinson, M., et al. 2011, ApJ, 738, 69
- Sirianni et al. (2005) Sirianni, M., Jee, M. J., Benítez, N., et al. 2005, PASP, 117, 1049
- Skelton et al. (2014) Skelton, R. E., Whitaker, K. E., Momcheva, I. G., et al. 2014, ApJS, 214, 24
- Smit et al. (2014) Smit, R., Bouwens, R. J., Labbé, I., et al. 2014, ApJ, 784, 58
- Stanway et al. (2005) Stanway, E. R., McMahon, R. G., & Bunker, A. J. 2005, MNRAS, 359, 1184
- Stark et al. (2009) Stark, D. P., Ellis, R. S., Bunker, A., et al. 2009, ApJ, 697, 1493
- Stark et al. (2010) Stark, D. P., Ellis, R. S., Chiu, K., Ouchi, M., & Bunker, A. 2010, MNRAS, 408, 1628
- Stark et al. (2013) Stark, D. P., Schenker, M. A., Ellis, R., et al. 2013, ApJ, 763, 129
- Stark et al. (2014a) Stark, D. P., Richard, J., Siana, B., et al. 2014, MNRAS, 445, 3200
- Stark et al. (2014b) Stark, D. P., Richard, J., Charlot, S., et al. 2014, MNRAS, arXiv:1408.3649
- Steidel et al. (1999) Steidel, C. C., Adelberger, K. L., Giavalisco, M., Dickinson, M., & Pettini, M. 1999, ApJ, 519, 1
- Steidel et al. (2014) Steidel, C. C., Rudie, G. C., Strom, A. L., et al. 2014, ApJ, 795, 165
- Szalay et al. (1999) Szalay, A. S., Connolly, A. J., & Szokoly, G. P. 1999, AJ, 117, 68
- Tilvi et al. (2013) Tilvi, V., Papovich, C., Tran, K.-V. H., et al. 2013, ApJ, 768, 56
- Treu et al. (2013) Treu, T., Schmidt, K. B., Trenti, M., Bradley, L. D., & Stiavelli, M. 2013, ApJ, 775, L29
- van der Wel et al. (2013) van der Wel, A., van de Ven, G., Maseda, M., et al. 2013, ApJ, 777, L17
- Vanzella et al. (2009) Vanzella, E., Giavalisco, M., Dickinson, M., et al. 2009, ApJ, 695, 1163
- Wilkins et al. (2011) Wilkins, S. M., Bunker, A. J., Stanway, E., Lorenzoni, S., & Caruana, J. 2011, MNRAS, 417, 717
- Wilkins et al. (2013) Wilkins, S. M., Coulton, W., Caruana, J., et al. 2013, MNRAS, 435, 2885
- Windhorst et al. (2011) Windhorst, R. A., Cohen, S. H., Hathi, N. P., et al. 2011, ApJS, 193, 27
- Yabe et al. (2009) Yabe, K., Ohta, K., Iwata, I., et al. 2009, ApJ, 693, 507
- Yan et al. (2005) Yan, H., Dickinson, M., Stern, D., et al. 2005, ApJ, 634, 109
- Yan et al. (2006) Yan, H., Dickinson, M., Giavalisco, M., et al. 2006, ApJ, 651, 24
| ID | RA | Dec | EW([O III]+H)[ Å] | |||||
|---|---|---|---|---|---|---|---|---|
| Fiducial samplea | ||||||||
| GND-7035815571 | ||||||||
| GND-7025017221 | ||||||||
| GND-6427518385 | ||||||||
| GND-6372717115 | ||||||||
| GSD-2504846559 | ||||||||
| GSD-2254450533 | ||||||||
| GSD-2237749136 | ||||||||
| GSD-2252146266 | ||||||||
| COS-3731073631 | ||||||||
| COS-2987030247d | ||||||||
| COS-1318939512e | ||||||||
| COS-3018555981f | ||||||||
| EGS-4434164969 | ||||||||
| EGS-5711424617 | ||||||||
| EGS-3506853076g | ||||||||
| EGS-1952445714h | ||||||||
| EGS-1350184593 | ||||||||
| EGS-2713432218 | ||||||||
| UDS-0089122444 | ||||||||
| UDS-5754844803i | ||||||||
| sampleb | ||||||||
| GND-6322718286 | ||||||||
| GNW-6390808452 | ||||||||
| GSD-2234402156 | ||||||||
| GSW-2573853217 | ||||||||
| ERS-2115344329 | ||||||||
| EGS-2802701763 | ||||||||
| UDS-5417745460 | ||||||||
| UDS-5125213373 | ||||||||
- •
aIn addition to our blue IRAC criterion (see Eq. 2) we require for our fiducial sample. If is undetected we use the 1 upper limit to compute the color.
- •
bHere, we list sources with , as well as blue IRAC colors (satifying Eq. 2). Low sources cannot unambiguously be selected in the sample, i.e., if they satisfy . However, this is only the case for one source in our sample, i.e. GSW-2573853217. The photometric redshift estimate of this source indicates it likely belongs in the sample.
- •
cError bars indicate the 68% confidence interval.
- •
dIn the stacked ground-based optical image (inverse variance weighted) this source is detected at nJy. However, this flux appears to derive from a foreground source, close to our object of interest but distinctly separated in the HST optical images.
- •
eThis source is detected at the edge of the HST/WFC3 field of view. We have verified that this source is also detected in the ground-based photometry from the UltraVISTA survey (Ilbert et al., 2013; see). However, the total magnitude for this source measured from ground-based data appears to be somewhat fainter than we measure for HST, suggesting that our HST stack might be affected by some non-gaussian noise.
- •
fThis source was independently discovered by Tilvi et al. (2013) and Bowler et al. (2014), who estimated a photometric redshift of and respectively.
- •
gThis source is only marginally resolved; while its spatial profile and SED are much more consistent with its being a galaxy, we cannot completely exclude the possibility it is a low-mass star.
- •
hThough the size of this source is consistent with its being a low-mass star, the SED of this source is better fit by a high-redshift galaxy than a stellar tempate.
- •
iThis source, better known as ’Himiko’ (Ouchi et al., 2009; Ouchi et al., 2013), has a spectroscopic redshift at , consistent with our photometric redshift estimate within the 68% probability window.
- •
jThis source is weakly detected in with and therefore included in the sample. However, due to a detection in the band, our estimated photometric redshift indicates a solution.
- •
kThe typical uncertainty in for this sample is very small. The ultra-blue IRAC colors of these galaxies are preferentially fit by the template with the most extreme [O III]/H ratio, which allows for little variation of the colors of the continuum emission and thereby narrows the redshift probability distribution. However, the shape of the spectral energy distributions of these galaxies (and the range of [O III]/H ratios at ) is unknown, and therefore it is likely that the width of the redshift probability distribution is underestimated for this particular sample.