Growing Self-organized Design of
Efficient and Robust Complex Networks
Abstract
A self-organization of efficient and robust networks is important for a future design of communication or transportation systems, however both characteristics are incompatible in many real networks. Recently, it has been found that the robustness of onion-like structure with positive degree-degree correlations is optimal against intentional attacks. We show that, by biologically inspired copying, an onion-like network emerges in the incremental growth with functions of proxy access and reinforced connectivity on a space. The proposed network consists of the backbone of tree-like structure by copyings and the periphery by adding shortcut links between low degree nodes to enhance the connectivity. It has the fine properties of the statistically self-averaging unlike the conventional duplication-divergence model, exponential-like degree distribution without overloaded hubs, strong robustness against both malicious attacks and random failures, and the efficiency with short paths counted by the number of hops as mediators and by the Euclidean distances. The adaptivity to heal over and to recover the performance of networking is also discussed for a change of environment in such disasters or battlefields on a geographical map. These properties will be useful for a resilient and scalable infrastructure of network systems even in emergent situations or poor environments.
I Introduction
Self-organizations with some outstanding properties of no central control, emerging structures, resulting complexity, and high scalability [1] appear in natural, social, and technological systems. To make a structure autonomously, movements or interactions of objects (materials or information) are necessary, therefore naturally induce their flows and form a network as the base. There are several fundamental mechanisms: preferential attachment [2], copying [6, 7], survival [9, 10], subdivision (fragmentation) [13, 14, 15, 16], or aggregation [17], for generating networks in the interdisciplinary research fields of physics, biology, sociology, and computer science. They are summarized in Table I. However, even the state-of-the-art science and technology is still far from fully understanding of the potential for applying to a design of efficient and robust networks, while our daily life strongly depends on network infrastructures in energy supply, communication, transportation, economic, ecological, and biological (nervous or genetic) systems.
As one of the most elucidated evidences, it has been found [18, 19, 20, 21] that many real networks in social, biological, and information systems have a scale-free (SF) structure whose degree distribution follows a power-law; e.g. the networks of coauthors, movie actors, protein interactions, food webs, Internet, and WWW are included in this class [22]. The SF network consists of many low degree nodes and a few very large degree nodes. The key mechanism for network generation is the preferential attachment [2] called as rich-get-richer rule. In other words, people ( nodes) tend to do economic trade with richer persons ( linking to large degree nodes) to get more money in selfishness. The SF networks have the efficient small-world (SW) property [23] that the path length between any two nodes is short even for a large network size, however they have an extreme vulnerability against intentional attacks [24]. Thus, the efficiency and the robustness are incompatible in many real networks. In addition, the percolation analysis in statistical physics has recently found [25, 26, 27] that the vulnerability increases in interdependent networks: realistic modern systems consisting of mutually related vulnerable networks in power-grid, communication, transportation, economic-trading, and so on. Disasters or terrorism are no longer unusual, moreover the threat to induce a malfunction becomes more serious. Because the above current networks are extremely vulnerable in the interdependency, nevertheless to maintain the connectivity is the most fundamental function as network.
Such a fat-tail distribution as power-law is also emerged mathematically by other quite random and unselfish mechanisms, e.g, multiplicative process: a quantity at time is given by the product [28], in which a temporal accumulation of random growth rate contributes to make the inequality even for the uniform randomness at each time step. Because the distribution follows a log-normal from the central limit theory for . Similar distributions have been obtained in a simple model of random copying among individuals in the evolution for studying cultural change [3, 4, 5]. The distributions consist of many uncommon variants and a very few common variants, where cultural variants means first names, journal citations, decorative motifs on archaeological pottery, and patent citations in U.S. Thus, random copying may induce a key mechanism to self-organize a complex structure depending on a probabilistic selection history, however it is not a network model. On the other hand, the biologically inspired duplication process has been so far considered to be fundamental in a model of protein-protein interaction networks [6, 7]. It suggests that complex network structures can be generated by a simple random process.
In this paper, we consider a self-organized design of efficient and robust networks by biologically inspired copying. In particular, we focus on the robust network structure with positive degree-degree correlations [29, 30, 31] and an incrementally growing mechanism. The self-propagation in maintaining the robust structure is particularly important for the scalability of network system without degrading the performance.
The organization of this paper is as follows. In Sec. II, we briefly review related network models to ours. In Sec. III, we propose a basic model for understanding the fundamental mechanism of network self-organization from a viewpoint in complex network science [18, 19, 20, 21] which aims to elucidate the universal properties and the generation rule of networks. We show the important properties of our model for the robustness of connectivity and the emergent functions. In Sec. IV, we consider an incrementally growing mechanism, and investigate the strong robustness and the efficiency for path lengths. We emphasis that the performance of our proposed networks for both the robustness and the efficiency does not degrade rather rises through the growth. In Sec. V, we discuss the possibilities and the issues for applications especially in communication or transportation systems. The adaptivity for changing environment in disasters or battlefields is also discussed. In Sec. VI, we summarize there results.
| Model | Mechanism | Reference |
|---|---|---|
| network | preferential | [2] |
| attachment | ||
| cultural change, | copying or | [3, 4, 5] |
| network | duplication | [6, 7] |
| trail, | survival | [8] |
| network | [9, 10] | |
| cracking, | fragmentation or | [11, 12] |
| network | subdivision | [13, 14, 15, 16] |
| cluster of mass, | aggregation | [12] |
| network | [17] |
II Related Works in Complex Network Science
It is a reasonable assumption that a biological network grows according to a simple mechanism based on random copying which differs from the preferential attachment [2] by selecting large degree nodes in selfishness. Thus, in the duplication-divergence (D-D) model [6, 7], a new node is added at each time step, and duplicately creates links to connected neighbor nodes of a randomly chosen node. Some links in the duplication are deleted with a probability . Without using degrees for the selection of linked nodes, a distribution of power-law with exponential cutoff emerges in the D-D model. However, there is a serious problem that the models by pure duplication without deletion of and by D-D with weak deletion of small have a singular property called as non-self-averaging [7, 32]; In the pure duplication [32], bipartite graphs in any combinations of positive integers and are generated with equiprobability, the degrees of and distribute uniformly. The statistical quantities such as the degree distribution and the total number of links in a sample of the networks have no meaning to characterize the topological structure, since the range between the minimum at and the maximum at diverges for a large size . In addition, the attack vulnerability remains in the D-D model because of the SF-like network.
On the other hand, the optimal structure against the targeted attacks to hub nodes has been shown numerically [29, 30] and analytically [31] in a SF network. It is referred to onion-like structure (see Fig. 1) from the character of connectivity with positive degree-degree correlations, which correspond to a natural tendency of homophily: nodes are more likely connect to other nodes that are similar to them. Under a given degree distribution, an onion-like network with the nearly optimal robustness can be generated by rewirings to enhance the degree-degree correlations [33]. Thus, the onion-like structure is applicable to a network with any degree distribution. For example, after the rewirings, the attack vulnerability is decreased for a power-law degree distribution in a SF network generated by the preferential attachment or other methods. However, the entire rewiring process discards already existing links, it is not effective utilization when a network is growing in a realistic situation. Moreover, in spite of the improvement of robustness, the positive degree-degree correlations in a SF network tend to induce longer path lengths [34], which are undesirable for the efficient communication or transportation. We should not persist SF networks, and study other candidates for future design of networks, especially in considering self-organization mechanisms.

III Basic Properties
In this section, we consider a self-organization of onion-like network, and show the tolerant and topological properties of robustness, degree distribution, and degree-degree correlation. To study the connectivity in a network structure independently of applications is important for clarifying the basic property.
III-A Network model
We propose a modification of the D-D model [6, 7, 32] without mutation. Mutations by connecting randomly chosen two nodes are unnecessary for generating an onion-like network. The basic processes of network construction by using only local information are as follows (see Fig. 2).
- Step 0:
-
Set an initial configuration (e.g. connected two nodes).
- Step 1:
-
At each time step , a new node is added. The new node connects to a randomly chosen node and to the neighbor nodes with a probability [33],
(1) where is a rate of link deletion, is a parameter, and and denote the degrees of nodes and .
- Step 2:
-
The above processes are repeated up to a given size in prohibiting self-loops at a node and duplicate connections between two node.
In Step 1, is temporary set as the degree of the chosen node, since the degree of new node is unknown in advance because of the stochastic process. When degrees and are close, the two nodes and are connected with high probability. The case of without the correlation effect corresponds to the conventional D-D model except the mutual link between new node and chosen node. We set .
Figure 3 shows that our proposed networks satisfy a good property of the self-averaging unlike the conventional D-D model: the statistical deviation for the total number of links converges to zero for a large size . Here, denotes the statistical mean (expectation). We remark a reason of the self-averaging by that a sequence of complete graphs is generated in our case of pure duplication of instead of bipartite graphs in the conventional D-D model [32]. Therefore, with a small change from the conventional D-D model by adding the mutual links, the tendency of dense connections (whose extreme case is a complete graph) induces a core of connected high degree nodes. In addition, since there is an effect of preferential attachment to the random neighbors [35, 36], large degree nodes and tend to be connected together when the chosen node has a large degree. The positive degree-degree correlations is suitable to improve the robustness, especially for the malicious attacks [29, 30]. However, such correlations between low degree nodes are weak in the tree-like structure as shown in the top of Fig. 4. Since a low degree node dangles from a higher degree node, the dangling part is easy to be disconnected by node removals. We remark that the majority is low degree nodes. Thus, we consider the addition of shortcut links [23] in Step 3.
- Step 3 :
-
After Step 2, some shortcut links between randomly chosen nodes and are added with the probability of Eq.(1). The number of shortcut links are given by , where is an adding rate of shortcut and is the total number of links in the original tree-like network generated for the size .
The bottom of Fig. 4 shows an onion-like structure by adding shortcut links after Step 2. In the next subsection, as a basic property, we will separately discuss the effects of copyings and adding shortcuts on the robustness in order to make them clearly.


We emphasize the two important functions. First, a new node act as a local proxy of the chosen node and becomes another access point for the neighbor nodes in an analogy of distributed computer communication systems. Second, the complementary added shortcuts improve the robustness. It has already been shown that adding some shortcut links between uniform randomly chosen nodes improves the robustness in the theory for the small-world model [37] and also in the numerical simulations for many networks [10, 15, 16, 38]. The robustness is further improved due to the positive degree-degree correlations in the onion-like network as shown later, however the case of as the uniform random selections does not give the nearly optimal robustness.
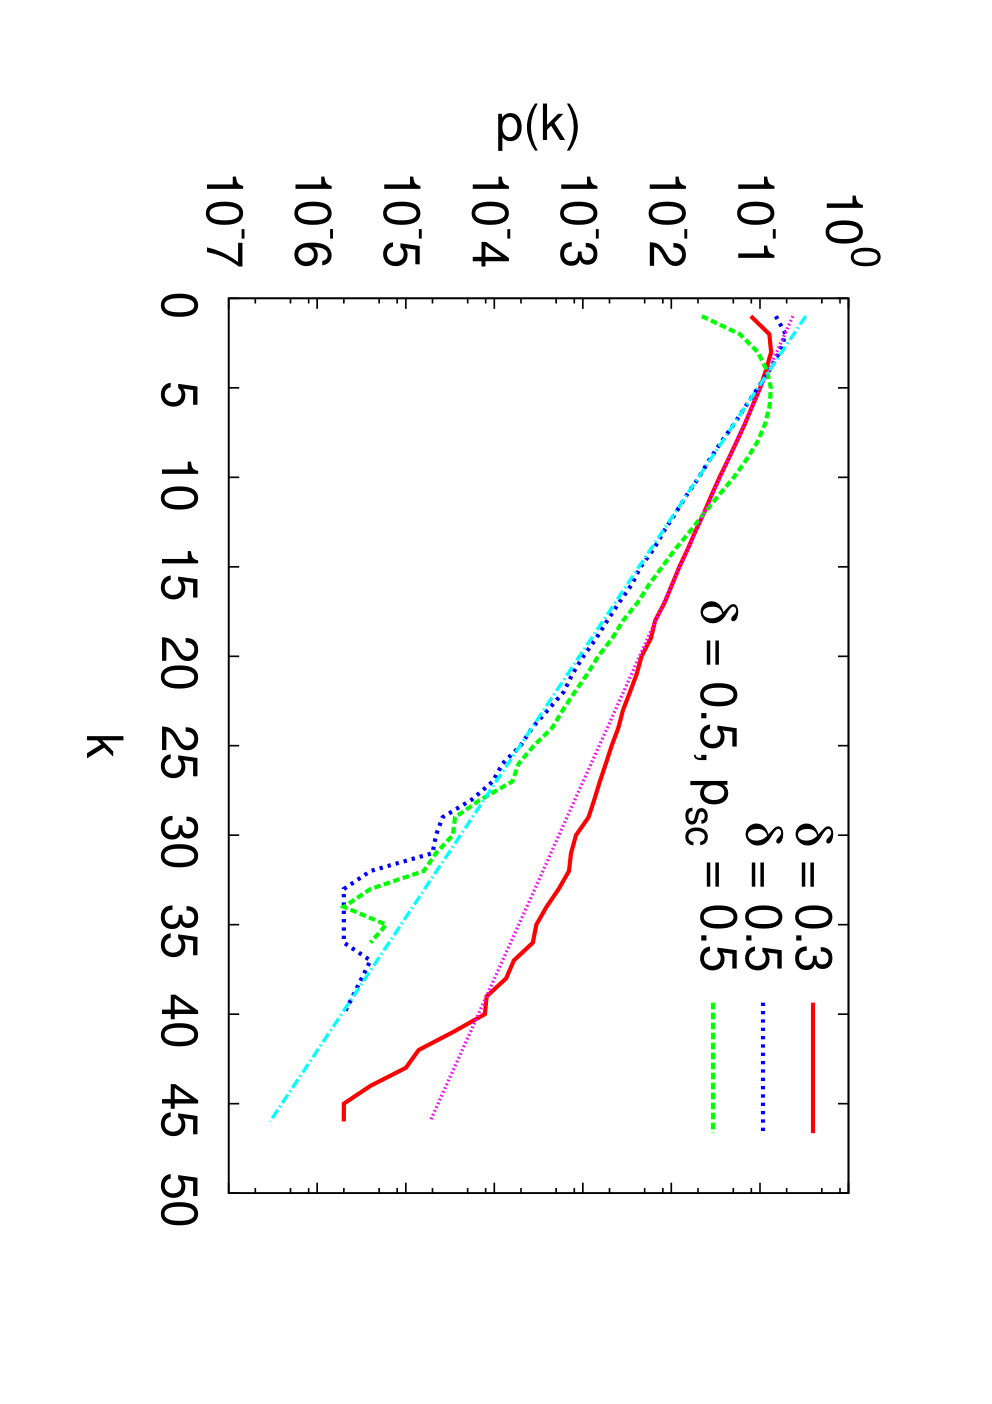
In addition, the proposed network has an efficiency without maintaining huge connections. Figure 5 shows that the degree distributions are approximated by exponential distributions. Therefore, huge degree nodes do not appear in the network, it is suitable for avoiding both the attack vulnerability [24] and the concentration of linking cost or traffic load [39]. Note that the proposed network does not belong to a SF network, since the degree distribution is not a power-law but an exponential.
III-B Measures of robustness and degree-degree correlations
We consider the malicious attacks, in which nodes are removed in decreasing order of the current degrees through the recalculations [40]. This type of attacks is a more serious problem setting from an assumption of circumspect terrorism than the attacks without recalculations. Attackers tend to aim at large degree nodes, since the removals give considerable damage to maintaining paths by many disconnections emanated from the removed nodes. We compare the robustness of the proposed network with the nearly optimal case under the same degree distribution. The nearly optimal case is given by the rewired version defined as follows. According to the stub-connection process until all the stubs have been used up [33], with a probability
the connections of randomly selected nodes and are repeated. Here, and denote the rank for the degrees of nodes and . A remaining small part of unpaired stubs is remedied by the reshuffle procedure. In the stub-connection process, the initial configuration consists of all unpaired stubs: any node has free links (whose linked nodes are undetermined) assigned from a given degree distribution .
We have two measures for investigating the robustness and the degree-degree correlations. The robustness is measured by the following index [29, 30, 33]
| (2) |
where denotes the number of nodes in the giant component (GC: largest connected cluster) after removing nodes by the malicious attacks. is monotonically decreased for increasing from an initial configuration of . The range of is , where corresponds to a completely disconnected network consisting of isolated nodes, and corresponds to the most robust network.
The degree-degree correlation is measured by the assortativity [20]
| (3) |
where , , , denotes the - element of the adjacency matrix. The right-hand side of Eq. (3) is a suitable scheme for the numerical calculation of than the original definition [41]. The range of is as the Pearson correlation coefficient of the degree. Nodes with similar degrees tend to be connected as is larger, while nodes with different degrees tend to be connected as is smaller (but is larger).
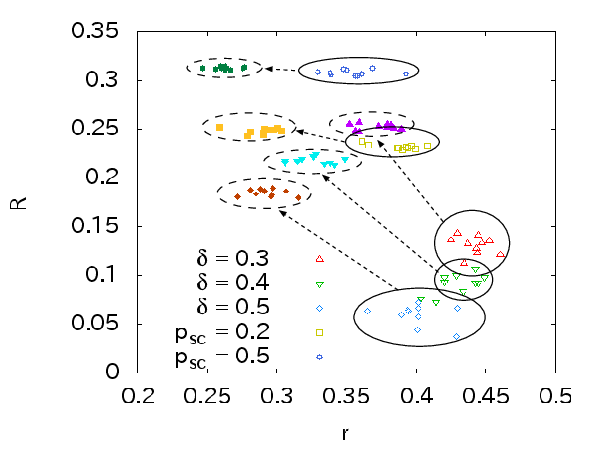
Figure 6 shows a scatter plot of robustness index versus assortativity . The open marks correspond to the proposed networks, and the filled marks correspond to the rewired versions at the optimal [33]. We set for the added versions with shortcut links for rates and . The values of become larger as is smaller in the tree-like networks with more links (denoted by open triangles and diamond marks). While the robustness is improved by adding shortcut links (denoted by open square and circle marks) in comparison with these corresponding results in the similar connection density level of the average degree :
| , | : | ||
| , | : | ||
| : |
and saturated around the nearly optimal for the rewired versions (denoted by filled marks). The dashed arrows show the improvement for the robustness, and the almost flat ones mean that the proposed networks with shortcuts have the nearly optimal robustness. Here, from ovals to dashed ovals, the decrease of is not strange for the rewired version to be onion-like structure with higher robustness. Because it has been pointed out that onion structure and assortativity are distinct property [29]: Not all assortative networks have onion structure but all onion networks are assortative [33].
IV Growing self-organization
We further consider an incrementally growing onion-like networks by simultaneous processes of copyings and adding shortcuts. Because the tree-like network leaves its robustness weak in the growth except at the final stage by adding many shortcut links. Thus, we modify the shortcut process as follows in Step 2. Instead, Step 3 is omitted.
- Step 2’:
-
In Step 2, at every interval , shortcut links are added between randomly chosen nodes and according to the probability of Eq.(1). This process is repeated up to links. Here, denotes the total number of links in the network at that time .
In this section, we numerically show the strong robustness against both attacks and failures and the efficiency for path lengths in the incrementally growing onion-like networks. Not only the emergent structure in distributed manner but also the scalability without performance degradation are important for the self-organization, and don’t appear in the rewiring model [33].
IV-A Robustness in the incrementally growing networks
In order to be at with , we chose a combination of parameters: & , & , & , & , and the corresponding in the tree-like networks. Since the robustness of connectivity depends on a degree distribution but increases as the average degree is larger with more links in general, a same level of connection density must be set to compare the robustness in several networks. Note that the size is at time , where denotes the initial size ( when the initial configuration is a connected two nodes).
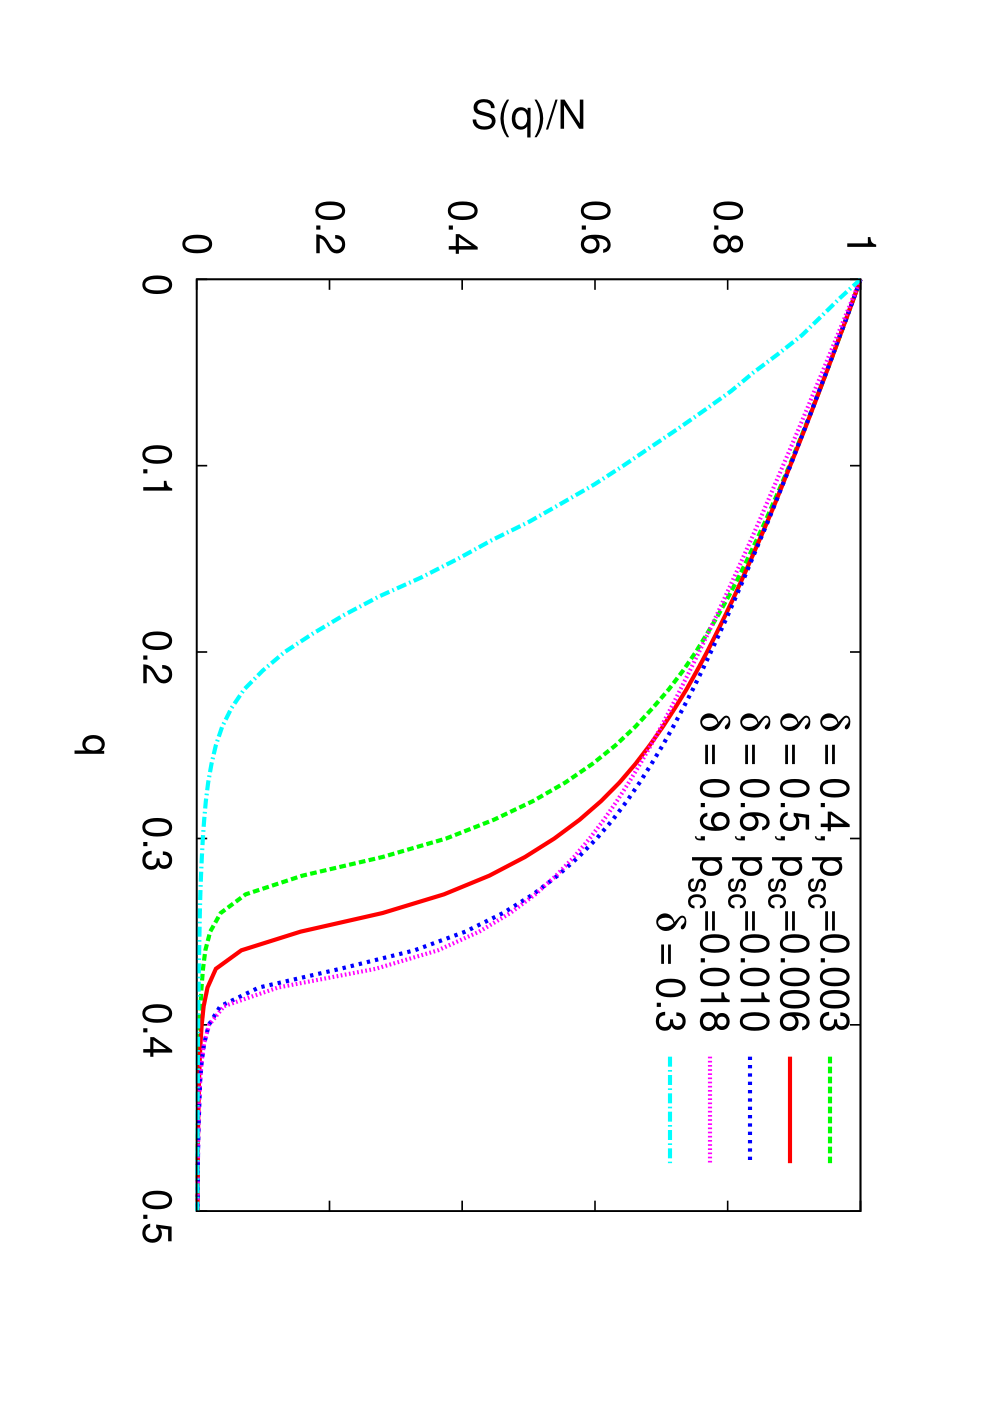
Figure 7(a) shows the relative size of nodes belonging to the GC versus the fraction of removed nodes by the malicious attacks. From the tree-like (denoted by cyan dashed line) to the onion-like (denoted by other lines) networks, the robustness is significantly improved, as is larger. However the difference in is small. For the breaking of the GC, the critical fraction is for the onion-like networks but very small for the tree-like networks as shown in Fig. 7(b) and the inset. At the peak, the GC breaks off and is divided into small clusters. Note that the critical fraction is around for the SF network models [38] and the Internet data at the level of autonomous system [24, 38, 42]. Figure 8(a) shows that the values of is sustained without a considerable drop against random node removals, except the case of (denoted by cyan dashed line). Note that the virtual line of angle is the most robust case of in the complete graph with the maximum : wasteful links. The critical fraction is about for the onion-like networks but for the tree-like networks as shown in Fig. 8(b). Remember that the robustness index defined in Eq.(2) indicates the area under a line of . Thus, higher robustness (values of ) in the growing onion-like networks is obtained than that in the tree-like networks for . Note that the value of include more information in order to compare the robustness, since different values of can exits even when some networks have a same value of . The assortativity and robustness index are summarized in Table II. As the deletion rate is larger, is smaller, while is almost constant in both cases of the attacks and the failures.
| by attacks | by failures | |||
|---|---|---|---|---|
| 0.4 | 0.003 | 0.412 | 0.246 | 0.427 |
| 0.5 | 0.006 | 0.347 | 0.267 | 0.439 |
| 0.6 | 0.010 | 0.277 | 0.283 | 0.447 |
| 0.9 | 0.018 | 0.192 | 0.281 | 0.448 |
| 0.3 | - | 0.442 | 0.127 | 0.356 |
(a)

(b)

(a)

(b)
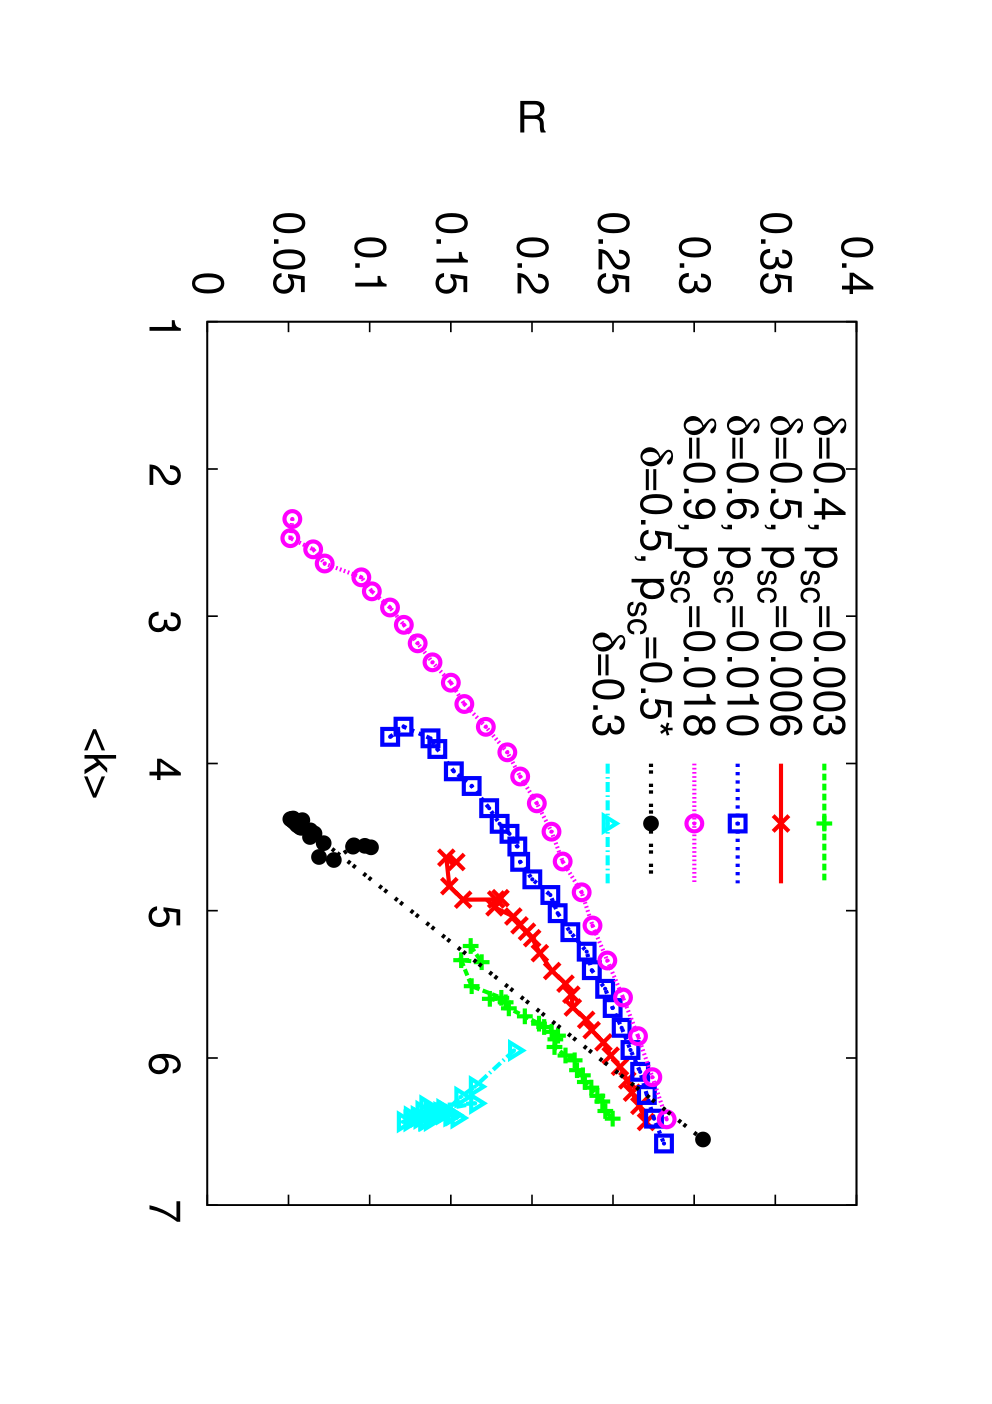
We also study a spatially growing method. We consider the initial configuration of connected two nodes located at the center with the link length in a square. At each time step in Step 1, from the center of a randomly chosen node, a new node is set on the radius of random number between and with any direction as similar to the basic idea of [43]. We set and . As shown in the top of Fig. 9, the growing networks spread out diffusively on the space according to the time course. Figure 10 shows the relation of and through the growth. In the incrementally growing onion-like networks for the values of and , the marks of green plus, red cross, blue open square, and magenta open circle on each line correspond to the size from left to right. Therefore, both and increase with the time course. The robustness is reinforced with increasing . In other words, the network becomes more and more robust through the growth. However, hardly vary and slightly decreases in the tree-like networks denoted by the marks of cyan triangle and black filled circle. The directions of lines are from top to bottom for in the time course. The long upper jump of a gray dashed line is due to become onion-like networks finally at by adding many shortcut links with the rate in Step 3. Through the growth, the assortativity is almost constant around , except it increases (from to ) in the case of & .

IV-B Efficiency for path lengths
The efficiency for communication or transportation is measured by the average path lengths on the shortest paths over the network. The length is usually counted by the minimum number of hops between two nodes. Because a path which passes through as few mediator nodes as possible gives lower cost (energy consumption) and more tolerant (safety or stable) operation for time-delay or information loss. Short paths are also related to reduce traffic load defined by the betweenness centrality [44]: the frequency of passing through a node or a link on the paths between all pairs of nodes. The frequency can be weighted by an inhomogeneously distributed (communication or transportation) requests, e.g. proportional to the products of populations around source and destination nodes on a space [45, 46] in more realistic situation.
Figure 11 shows that the distributions of path lengths in the networks at a same connection density level of . The widths are narrower around 5 hops in the growing onion-like networks denoted by green dashed, red solid, blue dashed, and magenta dotted lines for , , , and than that in the tree-like networks denoted by cyan chain line for . The path lengths are short around 5 hops in average and at most about 10 hops for . Thus, the growing onion-like networks are efficient with short paths.
In more detail for the emergence of SW property [23], it is important whether the average path length follows for the size under a constant connection density. Inset of Fig. 12 shows the SW property in the tree-like networks denoted by cyan and orange chain lines for and . Moreover, as shown in Fig. 12, the path lengths are very short around 5-6 hops in the growing onion-like networks denoted by green dashed, red solid, and blue dashed lines for , , and , except with slightly higher values of (longer path lengths) in denoted by magenta dotted line for than the case of tree-like networks denoted by cyan and orange chain lines for and . We should remark that the average degree is not constant within a connection density but increasing in the growing onion-like networks. Moreover, is smaller than that in the tree-like networks for as shown in Fig. 10. Smaller means fewer total links, and the network construction is less expensive in lower cost especially in an early stage of growth.


Another important measure is the path distance, which is defined by the sum of Euclidean distances for the links on the shortest path (counted by the minimum number of hops) between two nodes. This measure is corresponding to the load of physical movements for (communication or transportation) flows on a space, instead of the load of routing process (for switching the transfer direction) defined by the number of mediator nodes on the path.
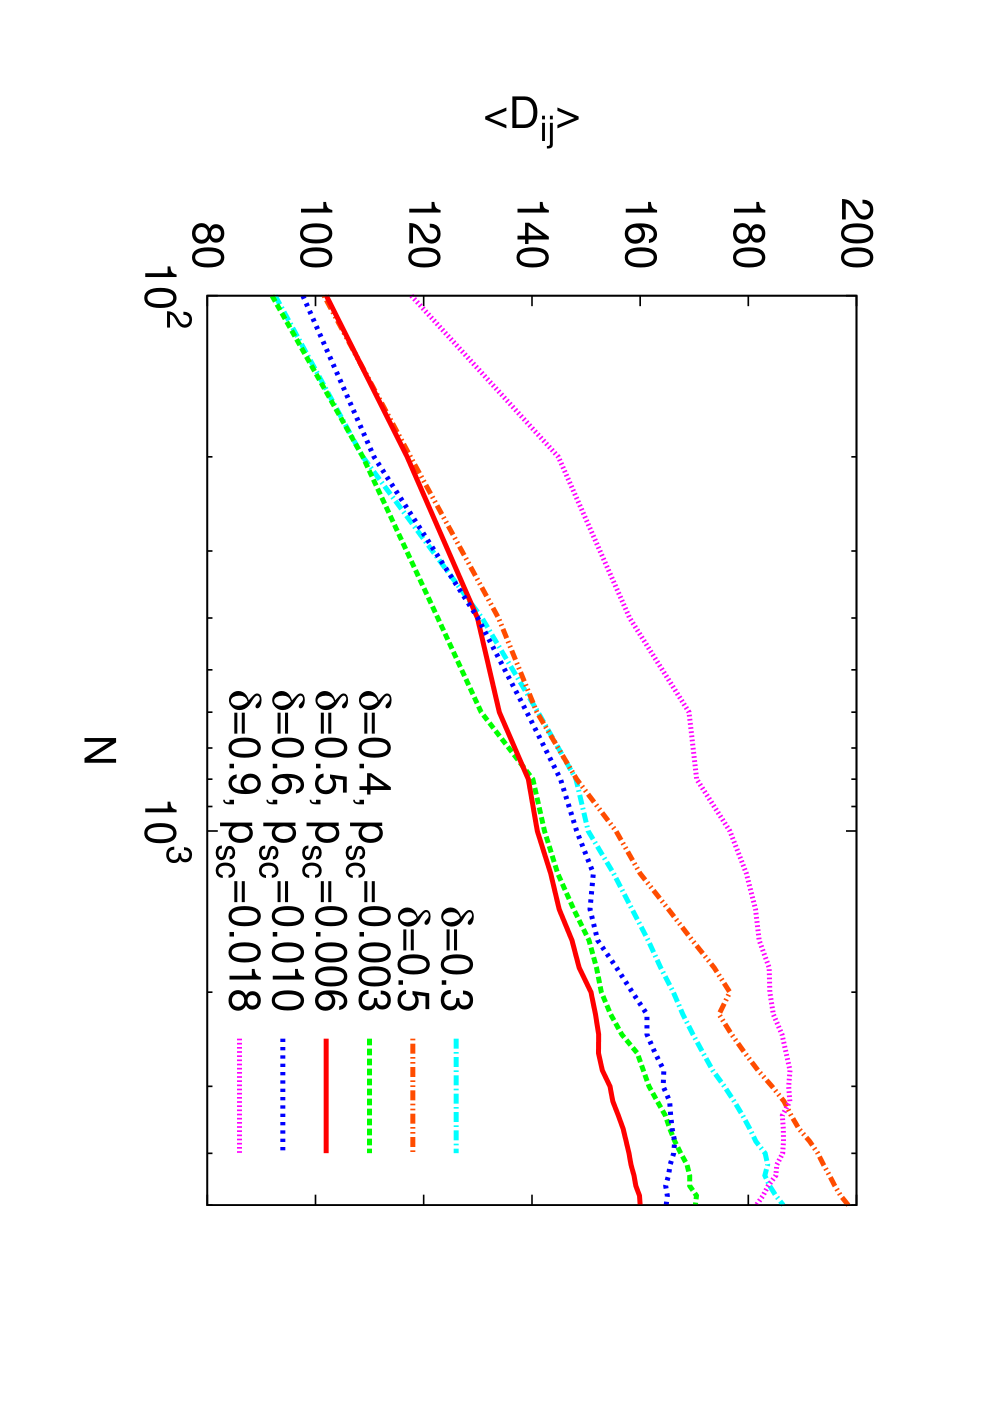
Figure 13 shows the distribution of path distances , in which the majorities are short around the size of outer square. The case of as the tree-like network denoted by cyan chain line has longer distances than other cases, since the distribution is shift to the right. We also confirm the SW property of for the path distance as shown in Fig. 14. The green dashed, red solid, and blue dotted lines for , , and in the onion-like networks are below the cyan and orange chain lines for and in the tree-like networks, except the magenta dotted line for . Thus, the onion-like networks has shorter path distances than the tree-like networks within a same connection density level, although the advantage in the Euclidean distances is weak in comparison with that in the number of hops (see Figs. 12 and 14). Note that we have similar results for the path length and distance , when we chose the shortest distance path instead of the above shortest path defined by the minimum number of hops between two nodes. The difference of shortest (Euclidean) distance path and shortest (minimum hops) path is very small in these spatial networks, in other words, they give similar efficiency for the routing paths in these measures.

V Discussions for applications
In this section, we will discuss the possibilities or issues in our proposed networks for applications of communication or transportation systems. There exist flows which represent movements of one entity relative to another on a network. Thus, we categorize the dynamics in networks into the following types.
- Type 1.
-
Dynamics of network configuration itself
- Type 2.
-
Dynamics of information flows, rumor spreading, opinion formation, synchronization, or logistics on a network
Through this paper, we study the Type 1 of dynamics in order to aim a fundamental mechanism for the self-organized design of efficient and robust networks. Temporal and/or fixed (corresponding to wireless and/or wired) connections are possible depending on the time-scale for changing the connection structure in a network. The quick change results in ad hoc networks, while the slow change is treated as an incremental modification of network. Both cases and the mixed one are not excluded, however we have assumed that each node or link is persisted once it is added unless removed by failures or attacks to simplify the discussion in Sections II-IV. The Type 2 of dynamics is significant for applications, e.g. wireless, sensor, mobile communication systems or autonomous transportation systems. In the Type 2 of dynamics, operation protocols for birth and death of communication or transportation request, routing, avoidance of congestion, task allocation, queuing, awareness of location, monitoring of system’s states or conditions, and so on [49], are necessary. There are many methods for the efficient operations that are independent (generally applicable) or dependent on a special network structure. The detail discussions are strongly related to device technologies, users, and situations of utilization, they are beyond our current scope.
Even when we focus on the Type 1 of dynamics, there are two kinds of interactions among individuals (nodes) and with environment [1] for the operation and control in a self-organized system. In particular, we consider changes of environment and the adaptivity in a network. Here, adaptivity is defined as the capability to work in different or changing environment without intervention and configuration by an administrator [1]. The levels of adaptation are distinguished as shown in Table III.
| Level 1: | The simplest adaptivity is to cope with changes |
|---|---|
| such as failures and mobility. | |
| Level 2: | In order to react to changes and to optimize |
| the system performance, protocols should be | |
| able to adapt their own parameters, e.g. timers | |
| and cluster size. | |
| Level 3: | In case of dramatic changes, the complete change |
| of the employed algorithms can be necessary, e.g. | |
| the exchange of a no longer converging clustering | |
| algorithm. |
At the Level 1, a compensatory growth for removed parts by attacks or failures is related to an adaptivity with healing function in the incrementally growing onion-like networks because of the potential with strong robustness. The function of proxy at a new node locally contributes to make different access paths through the copying process as mentioned in subsection II A. On the other hand, node mobility may give rise to other problems of disconnections in a limited transmission range of wireless beam, handover for high-speed environment, or loss of data and navigational routes. When a communication network is often disconnected but resilient due to node mobility, limited radio power, node or link failure, it is known as a Delay/Disruption Tolerant Network (DTN) where a mobile device or software agent temporary stores and carries local information for forwarding messages until an end-to-end route is re-established or re-generated. It is used in disasters, battlefields, and vehicular communications. There are many protocols in the concept of DTN routing [47, 48]. As a base structure for DTN, it is obviously better to have many short paths and to maintain tolerant path connectivity for temporal changes of nodes or links. Our growing onion-like network becomes one of the candidates of DTN.
At the Level 2, in our growing network, it will be useful to regulate the parameters of , , and in order to repair the damaged parts and to recover the performance for communication or transportation according to a limited resource and the state of network system monitored at a time. The scheduling is a further issue, and it is also important how to detect the damaged parts or malfunctions caused from overload beyond a capacity in a realistic network. At the Level 3, a change of the intrinsic mechanism for generating a network is required. Since the required change depends on the scale or the speed of damages or evolutions, we should develop a proper measure to evaluate them in many complex situations.
Apart from the basic property, only random failures and malicious attacks by removing nodes in decreasing order of their current degrees are insufficient to investigate the robustness in a realistic network. Natural disasters such as earthquake or flood and unremitting armed conflicts with aerial bombing give rise to spatially spreading damages. They probably make complex shapes of removed part in the network according to a geographical map. Although we treat a simple spatially growing method in Section IV, we need more consideration. In addition, how to locate a node on a space should be discussed more carefully e.g. for the geographical allocation of mobile base stations for wireless communication in an emergent case of disaster or poor infrastructural environment. In any cases, incremental repair and reinforced construction will be powerful approaches.
VI Conclusion
We have proposed a self-organized design method for generating efficient and robust networks. It is based on biologically inspired copyings and the complementary adding shortcut links to enhance the robustness. In particular, tanking into account positive degree-degree correlations, we have considered incrementally growing onion-like networks, which emerges from the backbone of tree-like structure generated by copyings and the periphery of shortcut links between low degree nodes. The obtained properties are fine as follows. We emphasize that these properties are not trivially predicted from a combination of copyings and adding shortcuts.
- •
- •
growing with the compensatory function of local proxy as another access point
- •
exponential degree distribution without huge hubs
to avoid the concentration of linking cost and traffic load at a few nodes [39] - •
strong tolerance of connectivity against failures and attacks equivalent to the nearly optimal in the rewired version [33] under a same degree distribution
- •
efficiency with short path lengths and distances (counted by the number of hops and the Euclidean distances, respectively, on the shortest path) for communication or transportation, in addition the path length is superior to the SW property [23] in a sense
Moreover, we have discussed the possibilities and issues for applications in wireless and/or wired communication or transportation systems, and particularly mentioned the adaptivity to heal over and to recover the performance of networking for a change of environment in such disasters or battlefields on a geographical map. In this paper, we have considered a self-configuration of efficient and robust network in an incremental and distributed manner. The proposed method does not require the entirely rewiring processes on a network [33]. Thus, the obtained results will be useful for temporal evolution of a resilient network system. Other capabilities and realistic strategies for self-diagnosis, self-protection, self-healing, self-repair, and self-optimization [1] are further issues. We will study effectively applicable methods to self-organize networks which keep high robustness and efficient paths for communication or transportation in both normal and emergent situations.
Acknowledgment
This research is supported in part by a Grant-in-Aid for Scientific Research in Japan, No. 25330100.
References
- [1] F. Dressler, Self-Organization in Sensor and Actor Networks, Joh Wiley & Sons, 2007.
- [2] A.-L. Babarási, and R. Albert, “Emergence of scaling in random networks,” Science, vol.286, pp.509-512, 1999.
- [3] F.D. Neiman, “Stylistic variation in evolutionary perspective: Inferences from decorative diversity and interassemblage distance in Illinois Woodland ceramic assemblages,” American Antiquity, vol60, no.1, pp.7-36, 1995.
- [4] R.A. Bentley, and S.J. Shennan, “Cultural transmission and stochastic network growth,” American Antiquity, vol.68, no.3, pp.459-485, 2003.
- [5] R.A. Bentley, M.W. Hahn, and S.J. Shennan, “Random drift and culture change,” Proceedings of the Royal Society B, vol.271, pp.1443-1450, 2004.
- [6] R.V. Sole, R. Pastor-Satorras, E.R. Smith, and T.B. Kepler, “A model of large-scale proteome evolution,” Advances in Complex Systems, vol.5, pp.43-54, 2002.
- [7] R. Pastor-Satorras, E.R. Smith, and R.V. Sole, “Evolving protein interaction networks through gene duplication,” Journal of Theoretical Biology, vol.222, pp.199-210, 2003.
- [8] D. Helbing, J. Keltsch, and P. Molnár, “Modeling the evolution of human trail systems,” Nature, vol.388, pp.47-50, 1997.
- [9] A. Tero, S. Takagi, T. Saigusa, K. Ito, D.P. Bebber, M.D. Fricker, K. Yumiki, R. Kobayashi, and T. Nakagaki, “Rules for Biologically Inspired Adaptive Network Design,” Science, vol.327, pp.439-442, 2010.
- [10] Y. Hayashi, and Y. Megumo, “Self-organized network design by link survivals and shortcuts,” Physica A, vol.391, pp.872-879, 2012.
- [11] W. Nagel, J. Mecke, J. Ohser, and V. Weiss, “A tesssellation model for crack patterns on surface,” Image Analysis & Stereology, vol.27, no.2, pp.73-78, 2008.
- [12] P.L. Krapivsky, S. Redner, and E. Ben-Naim, A Kinetic View of Statistical Physics, Cambridge University Press, 2010.
- [13] J.P.K. Doye, and C.P. Massen, “Self-similar disk packings as model spatial scale-free networks,” Physical Review E, vol.71, pp.016128, 2005.
- [14] T. Zhou, G. Yan, and B.-H. Wang, “Maximal planar networks with large clustering coefficient and power-law degree distribution,” Physical Review E vol.71, pp.046141, 2005.
- [15] Y. Hayashi, “Necessary Backbone of Super-highways for Transport on Geographical Complex Networks,” Advances in Complex Systems, vol.12, no.1, pp.73-86, 2009.
- [16] Y. Hayashi, Evolutionary Construction of Geographical Networks with Nearly Optimal Robustness and Efficient Routing Properties, Physica A, vol.388, pp.991-998, 2009. Corrigendum (2011): http://www.sciencedirect.com/science/article/pii/S0378437112002592
- [17] M.J. Alava, and S.N. Dorogovtsev, “Complex networks created by aggregation,” Physical Review E, vol.71, pp.036107, 2005.
- [18] S.N. Dorogovtsev, and J.F.F. Mendes, Evolution of Networks -From Biological Nets to the Internet and WWW-, Oxford University Press, 2004.
- [19] M.E.J Newman, A.-L. Barabási, and D.J. Watts, The Structure and Dynamics of Networks, Princeton University Press, 2006.
- [20] M.E.J Newman, Networks -An Introduction-, Oxford University Press, 2010.
- [21] R. Choen, and S. Havlin, Complex Networks -Structure, Robustness and Function-, Cambridge University Press, 2010.
- [22] R. Albert, and A.-L. Barabási, “Statistical mechanism of complex networks,” Reviews of Modern Physics, vol.74, no.1, pp.47-94, 2002.
- [23] D.J. Watts, and S.H. Strogatz, “Collective dynamics of small-world networks,” Nature, vol.393, pp.440-442, 1998.
- [24] R. Albert, and A.-L. Barabási, Error and attack tolerance of complex networks, Nature, vol.406, pp.378-382, 2000.
- [25] S.V. Buldyrev, R. Parshani, G. Paul, H.E. Stanley, and S. Havlin, “Catastrophic cascade of failures in interdependent networks,” Nature, vol.464, 1025-1028, 2010.
- [26] X. Huang, J. Gao, S.V. Buldyrev, S. Havlin, and H.E. Stanley, “Robustness of interdependent networks under targeted attacks,” Physical Review E, vol.83, pp.065101(R), 2011.
- [27] X. Huang, S. Shao, H. Wang, S.V. Buldyrev, H.E. Stanley, and S. Havlin, “The robustness of interdependent clustered networks,” Europhysics Letters, vol.101, no.1, pp.18002, 2012.
- [28] M. Mitzenmacher, “A Brief History of Generative Models for Power Law and Lognormal Distributions,” Internet Mathematics, vol.1, no.2, pp.226-251, 2004.
- [29] C.M. Schneider, A.A. Moreira, J.S. Andrade, Jr., S. Havlin, and H.J. Herrmann, “Mitigation of malicious attacks on networks,” Proceedings of the National Academy of Sciences, vol.810, no.10, pp.3838-3841, 2011.
- [30] H.J. Herrmann, C.M. Schneider, A.A. Moreira, J.S. Andrade, Jr., and S. Havlin, “Onion-like network topology enhances robustness against malicious attacks,” Journal of Statistical Mechanics, pp.P01027, 2011.
- [31] T. Tanizawa, S. Havlin, and H.E. Stanley, “Robustness of onionlike correlated networks against targeted attacks,” Physical Review E, vol.85, pp.046109, 2012.
- [32] I. Ispolatov, P.L. Krapivsky, and A. Yuryev, “Duplication-divergence model of protein interaction network,” Physical Review Letters, vol.71, pp.061911, 2005.
- [33] Z.-X. Wu, and P. Holme, “Onion structure and network robustness,” Physical Review E, vol.84, pp.026116, 2011.
- [34] T. Tanizawa, “Structural robustness and transport efficiency of complex networks with degree correlation,” IEICE Trans. on Fundamentals, Special Issue on Nonlinear Theory and Its Applications, vol.4, no.2, pp.138-147, 2013.
- [35] X.-H. Yang, S.-L. Lou, G. Chen, S.-Y. Chen, and W. Huang, “Scale-free networks via attachment to random neighbors,” Physica A, vol.392, pp.3531-3536, 2013.
- [36] E.R. Colman, and G.J. Rodgers, “Complex scale-free networks with tunable power-law exponent and clustering,” Physica A, vol.392, pp.5501-5510 (2013).
- [37] M.E.J. Newman, C. Moore, and D.J. Watts, “Mean-Field Solution of the Small-World Network Model,” Physical Review Letters, vol.84, pp.3201, 2000.
- [38] Y. Hayashi, and J. Matsukubo, “Improvement of the robustness on geographical networks by adding shortcuts,” Physica A, vol.380, pp.552-562, 2007.
- [39] K.-I. Goh, B. Kahng, and D. Kim, “Universal Behavior of Load Distribution in Scale-Free Networks,” Physical Review Letters, vol.87, no.27, pp.278701, 2001.
- [40] P. Holme, B.J. Kim, C.N. Yoon, and K. Han, “Attack vulnerability of complex networks,” Physical Review E, vol.65, pp.056109, 2002.
- [41] M.E.J. Newman, “Assortative Mixing in Networks,” Physical Review Letters, vol.89, no.20, pp.208701, 2003.
- [42] R. Pastor-Satorras, and A. Vespignani, Evolution and Structure of the Internet -A Statistical Physics Approach-, Cambridge University Press, 2004.
- [43] R. Xulvi-Brunet, and I.M. Sokolov, “Growing networks under geographical constraints,” Physical Review E, vol.75, pp.46117, 2007.
- [44] L.C. Freeman, “A set of measures of centrality based on betweenness,” Sociometry, vol.40, pp.35-41, 1977.
- [45] Y. Hayashi, “Rethinking of Communication Requests, Routing, and Navigation Hierarchy on Complex Networks -for a Biologically Inspired Efficient Search on a Geographical Space-,” In Networks -Emerging Topics in Computer Science, Chapter 4, pp.67-88, ISBN 978-1-922227-02-7, A. Rezazadeh, L. Momeni, and I. Bilogrevic (Eds), iConcept Press, 2012.
- [46] S. Dolev, Y. Elovicl, and R. Puzis, “Routing Betweenness Centrality,” Journal of the ACM, vol.57, no.4, pp.25:1-27, 2010.
- [47] H. Shah, “Routing Enhancement Specific to Mobile Environment Using DTN,” International Journal of Computer Theory and Engineering, vol.3, no.4, pp.537-542, 2011.
- [48] R.J., D’Souza and J. Jose, “Routing Approaches in Delay Tolerant Networks: A Survey,” International Journal of Computer Applications, vol.1, no.17, pp.8-14, 2010.
- [49] M. Barbeau, and E. Kranakis, Principles of ad hoc networking, Jon Wiely & Sons, 2007.