3 mm spectral line survey of two lines of sight toward two typical cloud complexes in the Galactic Center
Abstract
We present the results of two Mopra 3-mm spectral line surveys of the Lines of Sight (LOS) toward the Galactic Center (GC) molecular complexes Sgr B2 (LOS+0.693) and Sgr A (LOS0.11). The spectra covered the frequency ranges of 77-93 GHz and 105-113 GHz. We have detected 38 molecular species and 25 isotopologues. The isotopic ratios derived from column density ratios are consistent with the canonical values, indicating that chemical isotopic fractionation and/or selective photodissociation can be considered negligible (10%) for the GC physical conditions. The derived abundance and rotational temperatures are very similar for both LOSs, indicating very similar chemical and excitation conditions for the molecular gas in the GC. The excitation conditions are also very similar to those found for the nucleus of the starburst galaxy NGC 253. We report for the first time the detection of HCO and HOC+ emission in LOS+0.693. Our comparison of the abundance ratios between CS, HCO, HOC+ and HCO+ found in the two LOSs with those in typical Galactic photodissociation regions (PDRs) and starbursts galaxies does not show any clear trend to distinguish between UV and X-ray induced chemistries. We propose that the CS/HOC+ ratio could be used as a tracer of the PDR components in the molecular clouds in the nuclei of galaxies.
Keywords:
Galaxy: centre – ISM: clouds – ISM: molecules.1 Introduction
In this paper we study the physical conditions and chemical complexity of the quiescent molecular gas along two Lines of Sight (LOS), one toward the Sgr B2 complex (LOS+0.693) and the other one toward the Sgr A complex (LOS0.11), both complexes located in the Galactic Center (GC). Molecular cloud complexes inside the Central Molecular Zone (CMZ, Morris & Serabyn (1996)) in the GC show very different characteristics that the clouds in the Galactic disc. GC clouds are characterized by high gas-kinetic temperatures of 100 K (Hüttemeister et al., 1993; Rodríguez-Fernández et al., 2001) and cold dust temperatures (Tdust) of 30 K (Rodríguez-Fernández et al., 2004).
The Sgr B2 complex contains one of the most outstanding massive star formation sites in the Galaxy and consists of several star-forming cores embedded in a lower density envelope (Gordon et al., 1993). Sgr B2 hosts many dozens of compact and hypercompact HII regions, e.g., De Pree et al. (1996); De Pree et al. (1998) concentrated in two regions, Sgr B2N and Sgr B2M. LOS+0.693 toward the Sgr B2 molecular complex studied in this paper, shown in Fig. 1 (upper and middle panels), is outside the HII region L (Mehringer et al., 1995) and the main massive star forming regions Sgr B2M and Sgr B2N (Martín-Pintado et al., 1990). Therefore, LOS+0.693 does not appear to be affected strongly by UV radiation, but otherwise this LOS may be subjected to significant X-ray irradiation since the Sgr B2 cloud is a well established X-ray reflection nebula due to its strong Fe K line emission at 6.4 keV (Koyama et al., 1996).
The Sgr A molecular complex contains two massive molecular clouds at 20 km s-1 and 50 km s-1 believed to be interacting with the Circumnuclear Disk (CND) surrounding the central supermassive black hole Sgr A∗ and two supernova remnants, Sgr A East and G3590.09 (Coil & Ho, 2000; Herrnstein & Ho, 2002; Ferrière, 2012). LOS0.11 toward the 20 km s-1 molecular cloud, shown in Fig. 1 (bottom panels), is located in projection 216 (8.6 pc) south of the black hole Sgr A∗. LOS0.11, lies near the elongated non-thermal features Sgr A-F and Sgr A-E (Yusef-Zadeh & Morris, 1987; Lu et al., 2003; Yusef-Zadeh et al., 2005) indicated in Fig. 1. Recent star formation (compact HII regions G0.02-0.007) around Sgr A∗ is mainly concentrated toward the 50 km s-1 molecular cloud (Mills et at., 2011).
Unlike the star forming regions of Sgr B2M and Sgr B2N, the selected lines of sight toward the cloud positions in the Sgr B2 and Sgr A complexes studied in this paper do not show any signposts of massive star formation like H2O masers, ultracompact HII regions, hot cores or recombination line emission (Hüttemeister et al., 1993; Martín-Pintado et al., 1997).

Several unbiased spectral line surveys have been carried out toward the Sgr B2 star forming cores, positions N (Nummelin et al., 1998; Nummelin et al., 2000; Friedel et al., 2004; Belloche et al., 2013), M (Sutton et al., 1991; Belloche et al., 2013), S and OH (Friedel et al., 2004). Nummelin et al. (1998); Nummelin et al. (2000) also carried out a spectral survey toward a quiescent region in Sgr B2. They detected 26 species and showed the large difference in chemical complexity and excitation between the quiescent and the star forming clouds. Our line survey of two quiescent lines of sight were selected from the systematic study of the HNCO/CS ratios carried out by Martín et al. (2008). In this study both locations were among the objects which showed the highest ratios indicating that the chemistry and likely the heating of both GC LOSs are mainly dominated by low velocity shocks. This is also supported by Requena-Torres et al. (2008), who also studied several GC sources, including our two LOSs, finding that the abundances of complex organic molecules like CH2OHCHO, (CH3)2O, CH3CHO, among others, are larger in these GC LOSs than those in hot cores of the Galactic disk, suggesting ejection of molecules from dust grains by low velocity C-type shocks. Previous surveys of the Sgr B2 quiescent clouds by Nummelin et al. (1998); Nummelin et al. (2000) at high frequencies did not have the sensitivity to detect weak molecular lines from these species.
In this paper, we present a 3 mm spectral line survey of the quiescent molecular gas along LOS+0.693 and LOS0.11 toward the Sgr B2 and Sgr A complexes, respectively. Both complexes, inside the CMZ, are outstanding regions affected by high energy phenomena (Koyama et al., 1996; Terrier et al., 2010; Ponti et al., 2010) and large scale shocks (Martín-Pintado et al., 2001). Our sensitivity allowed us to detect, for the first time, the emission of the HCO and HOC+ molecules, which are considered to be tracers of UV radiation and X-ray chemistry in molecular clouds. In Sec. 2, we present our observations and data reduction. In Sec. 3, the details of the line identification (Sec. 3.1), line profiles (Sec. 3.2) and analysis (Sec. 3.3) are reported. In Sec. 3.4 we derive six isotopic ratios and discuss their implications. In Sec. 4, we discuss the molecular abundance and excitation conditions found in the GC and compare them with those in galactic nuclei (Sec. 4.1), and the implication of our detection of HCO and HOC+ in the UV and X-ray induced chemistry in galactic nuclei (Sec. 4.2). Finally, the conclusions are summarized in Sec. 5.
2 Observations and data reduction
The observations were carried out with the 22-m Mopra radio telescope11 1 Mopra is operated by the Australia Telescope National Facility, CSIRO and the University of New South Wales. on November of 2007. We used the the dual 3 mm Monolithic Microwave Integrated Circuit (MMIC) receiver connected to the 8 GHz Spectrometer, which provided a velocity resolution of 0.9 km s-1 at 90 GHz. Spectra in two polarizations were observed simultaneously. Two frequency ranges in the 3 mm window were covered, from 77 to 93 GHz and from 105 to 113 GHz. The beam size of the telescope was 38′′ at 90 GHz and 30′′ at 115 GHz. We used position switching as observing mode with the emission free reference positions selected from the CS maps obtained by Bally et al. (1987). The nominal positions used for the observation of LOS+0.693 and LOS0.11 were , and , , respectively. Fig. 1 shows the two observed positions superimposed on the SiO(2-1) (Martín-Pintado & Amo-Baladrón, priv. communication) and the 20 cm radio continuum maps (Yusef-Zadeh et al., 2004) of the Sgr B2 and Sgr A complexes. The reference positions were , and , for LOS+0.693 and LOS0.11, respectively.
The raw data were reduced by using the ATNF Spectral Analysis Package (ASAP) at Mopra telescope to create the fits files for further processing with the MASSAIJ package22 2 This package have been developed at the Centro de Astrobiología. More information about this package in http://damir.iem.csic.es/mediawiki-1.12.0/index.php/Portada., where baseline subtraction were applied. In several regions of the spectra there were baseline ripples, which were partially corrected by editing the data in the Fourier transformed plane. The two polarizations of the spectra were averaged to improve the signal to noise ratio. The spectra were then smoothed to a velocity resolution of 3.5 km s-1, appropriate for the linewidths of 20 km s-1 observed toward molecular clouds in the GC. Our line intensities in T units are affected by 20%-30% uncertainties in the calibration procedure based on a noise diode and an ambient temperature load.


3 Results
3.1 Line identification
The 3 mm spectra observed toward both LOSs are shown in Fig. 2, where the identified molecules and the unidentified lines are indicated. A representative sample of line profiles for several molecular transitions and their isotopologues for LOS+0.693 and LOS0.11 are shown in Fig. 4 and 6, respectively. The molecular identification and analysis were carried out using the frequencies and the spectroscopic information from the JPL (Pickett et al., 1998) and CDMS (Müller et al., 2001; Müller et al., 2005) catalogs contained in the MASSAIJ package. For LOS+0.693, we found 38 molecular species and 25 isotopologues, as well as 18 unidentified lines. In contrast, for LOS0.11, we only found 34 molecular species and 18 isotopologues, as well as 8 unidentified lines.
In our survey, we have detected, for the first time, the HCO and HOC+ emission toward the quiescent gas of LOS+0.693 in the GC outside the hot cores of Sgr B2N and Sgr B2M. We have detected four HCO hyperfine lines (F=2-1, 1-0, 1-1 and 0-1) and one HOC+(1-0) line toward LOS+0.693 (see Fig. 2 and 4). HCO, HOC+, HC2NC and HCOCH2OH are not detected toward LOS0.11 (see Fig. 2 and 6). HCO and HOC+ molecules have been proposed to be tracers of PDRs (Apponi et al., 1999; Goicoechea et al., 2009; Martín et al., 2009b) and XDRs (Usero et al., 2004). Tables 1 and 4 show the line parameters derived by Gaussian fitting to almost all observed molecular lines for both LOSs. The tables also include, for both LOSs, upper limits to the emission of several molecular species, like HOC+ and HCO, which are relevant for the discussion. These upper limits (4 for LOS+0.693 and 16 for LOS0.11) correspond to 3 of the peak and velocity-integrated intensities (see Tables 1 and 4).
3.2 Line profiles
Most of line profiles from each cloud trace just their kinematic structure, i.e. three velocity components (17, 68 and 85 km s-1) in LOS+0.693 and one velocity component (20 km s-1) in LOS0.11. Additional double-peaked line profiles of certain strong molecular species like HCO+, HNC and HCN are likely a result of optical depth effects, as this double-peaked structure is not present in the line profiles of their optically-thin isotopologues. In this paper, we will concentrate on the emission from the 68 and 85 km s-1 clouds along LOS+0.693 and the 20 km s-1 cloud along LOS0.11.
To compare molecular abundances derived from optically-thick lines (e.g. CN, HNC, HCN, HCO+ and CH3OH) with those showing simpler profiles we have calculated, in Tables 1 and 4, their velocity-integrated intensities over the selected velocity ranges given in column 4 of these tables. For LOS+0.693 we have considered two velocity ranges of 4080 km s-1 and 80110 km s-1 corresponding to the emission of the 68 km s-1 and 85 km s-1 clouds, respectively. For LOS0.11, we have derived velocity-integrated intensities only for HCO+(1-0) and HCN(1-0) lines and their corresponding isotopologues.
Fig. 4 and 6 present the line profiles of all detected methanol transitions for LOS+0.693 and LOS0.11, respectively. Interestingly the CH3OH(31,3-40,4) line is the only methanol line observed in absorption in our survey, while the CH3OH(00,0-1-1,1) line appears to be optically thick in both LOSs. Furthermore, the CH3OH(5-1,5-40,4) line at 84.5 GHz is intense and it has been reported to be masing in some sources (Zuckerman et al., 1972; Batrla & Menten, 1988).
3.3 Analysis
Assuming optically thin emission and excitation in Local Thermodynamic Equilibrium (LTE), the relation between the LTE total molecular column density and the measured integrated line intensity, in K km s-1, of a transition is given by:
| (1) |
where is the molecular column density in the upper energy level, and / are the degeneracy and the energy (in K) of the upper level of the transition with a frequency in GHz, a dipole moment in Debye and a line strength . Trot is the LTE rotational temperature in K, is the rotational partition function. Taking the natural logarithm in (1) we obtain that the main equation of the rotational diagrams (RDs) is given by:
| (2) |


By observing more than one transition from the same molecule, we can estimate the excitation temperature of the rotational levels, Trot, and the LTE total column densities (by using the for Trot) from a linear regression fit to equation (2). Since the typical uncertainties of assuming the Rayleigh-Jeans approximation are less than the calibration uncertainties, they are ignored.
3.3.1 Rotational temperatures and molecular column densities
We have used the MASSAIJ package with the spectroscopic information (, , , , , etc) from the JPL and CDMS catalogs to generate the RDs for all molecules with more than one observed transition. Fig. 8 shows RDs (for both GC sources) for selected molecules, and the derived Trot from RDs are listed in Table 7. All RDs are fitted with a single Trot. The uncertainties in the Trot are derived from the 1 uncertainties in the integrated line intensities and also take into account the uncertainty due to the linear regression fit in the RDs. In our survey, the derived Trot ranges from 5 K to 73 K (see Table 7), however, most of the derived Trot are rather low compared with the estimated mean kinetic temperature of 100 K found in the GC (Güsten et al., 1985; Hüttemeister et al., 1993), indicating subthermal excitation due to relatively low H2 densities (see Sec. 3.3.4).
Molecular lines contaminated by the emission from unidentified molecular species (see notes in Tables 1 and 4) were not included in the RDs. When required, we have also properly taken into account the hyperfine structure (see notes in Tables 1 and 4) to estimate the total column densities given in Table 7. We have used equation (1) to estimate the total column densities for molecules with only one detected transition by assuming a Trot of 10 K, the average value of the low Trot derived from other molecules (see Table 7). We have also used a Trot of 10 K to derive the column densities of molecular species with several observed transitions but with insufficient dynamical range in (2 K) to derive a reliable Trot.
To avoid the uncertainties introduced by optical depth effects in the estimated column densities of molecules like HCN, HNC, HCO+, in Table 7, when possible, we have derived them from the optically thin lines (see note b in Table 7) of their rarer isotopologues, assuming the typical GC isotopic ratios (Wilson & Rood (1994), hereafter W&R94). The LTE approximation used in our analysis provides beam-averaged abundances which are relatively similar to those obtained by using non-LTE statistical equilibrium methods. The difference in the estimated HC3N column densities using the LTE and non-LTE analysis is less than a factor of 2 for both GC sources (see Sec. 3.3.4).
To derive the CH3OH column density for LOS+0.693 we have used the 72,6-81,7 transition and the Trot of 14 K derived by Requena-Torres et al. (2008). This transition is selected since it shows thermal emission, is likely optically thin, and is observed in emission toward LOS+0.693 (see Sec. 3.2). For LOS0.11 this methanol transition is not detected, so we have derived only an upper limit to the methanol column density by assuming the Trot of 13 K derived by Requena-Torres et al. (2008).
3.3.2 H2 column densities and molecular abundances
To estimate the molecular fractional abundances relative to H2 we need to estimate the H2 column density (N) toward both LOSs. We have used the C18O lines to estimate the H2 column densities by assuming a 16O/18O isotopic ratio of 250 (W&R94) and a relative abundance of CO to H2 of 10-4 (Frerking et al., 1982). We found N of 5.9 (0.2)1022 cm-2 and 2.4 (0.2)1022 cm-2 for LOS+0.693 and LOS0.11, respectively. The estimated relative abundances obtained by dividing the molecular column densities by their respective N are shown in Table 7 for the molecules and velocity components identified in our spectral line survey. Fig. 10 summarizes the derived fractional abundances from Table 7 for all species except for 13C15N (its 1-0 transition is contaminated by emission from an unknown molecular species), O13C34S (there is no lower limit for LOS0.11) and HCO+, HCN, HNC and their 13C isotopologues, whose abundances are obtained from their less abundant isotopologues.
It is remarkable, that two LOSs separated by more than 120 pc in the GC show very similar abundances, within a factor of 2, of 80% of the detected molecular species, including the most complex organic molecules like C2H5OH, C2H5CN and (CH3)2O (see Fig. 10). This finding will be discussed in detail in section 4.1.1.
3.3.3 Kinetic temperatures
Symmetric rotors are usually used to estimate the kinetic temperature, Tkin, of the molecular clouds because the radiative transitions between levels of ladders with K0 are forbidden (Turner, 1991), and their excitation is dominated by collisions with H2. In our survey we have detected transitions from CH3CN, 13CH3CN, CH313CN, CH3CCH and CH313CCH. We have derived the Trot for both LOSs from the RDs of the 6K-5K (K=0, 1, 2, 3 and 4) transitions of CH3CN and the 6K-5K (K=0, 1, 2 and 3) transitions of CH3CCH. In addition for LOS+0.693 we have also used the 6K-5K (K=0, 1 and 3) transitions of 13CH3CN (the K=2 line is not used because it is blended with the K=0 and 1 lines).
As expected, the symmetric rotors CH3CN, CH3CCH and 13CH3CN show the highest Trot of 55-73 K for both GC sources (see Table 7), indicating that the Tkin must be larger than 73 K. For a Tkin of 100 K, statistical equilibrium calculations reveal that Trot derived from CH3CN transitions with K0 (K4) approach the Tkin only at H2 densities of 106 cm-3. For H2 densities of 105 cm-3 and a Tkin of 100 K, these CH3CN transitions show Trot of 70 K (Churchwell et al., 1992). Our results are consistent with the mean Tkin of 100 K derived by Güsten et al. (1985), Hüttemeister et al. (1993) and Rodríguez-Fernández et al. (2001) toward molecular clouds distributed over the central 500 pc of the GC. Thus, for the low H2 densities (104 cm-3, see Sec. 3.3.4) found in both GC sources we will consider in the following discussions a Tkin of 100 K.


3.3.4 H2 densities
We have used the non-LTE excitation and radiative transfer code RADEX with the Large Velocity Gradient (LVG) approximation (van der Tak et al., 2007) to estimate the H2 densities by using three HC3N lines (see Tables 1 and 4). For a Tkin of 100 K, a linewidth of 21 km s-1, a background temperature of 2.73 K and a beam filling factor of 1 (since the cloud size is much larger than the telescope beam size, see Fig. 1), we have estimated H2 densities of 2.3 (0.3)104 cm-3 for both GC sources.
The HC3N column densities and H2 densities were considered free parameters for the modelling. Our non-LTE analysis provided estimates of the HC3N column densities of 6.01014 cm-2 for LOS+0.693 and 4.91014 cm-2 for LOS0.11, in good agreement within a factor of 2 with the LTE calculations of the HC3N column densities (see Table 7). Our estimated line optical depths are 0.5 for the three HC3N lines. The predicted excitation temperatures of 14 K are also consistent with the LTE analysis and our assumption of subthermal excitation. Changes in the Tkin to lower values of 50 K, will increase the H2 densities by only a factor of 2, to 5104 cm-3. The derived excitation temperatures are very sensitive to the H2 density. Changes in a factor of 2 in the H2 densities increase the excitation temperature from 14 K to 24 K. The latter predicted temperature is inconsistent with our measured Trot for HC3N, ruling out higher H2 densities in both GC sources.
| Molecule | Frequency | Transition | Area () | VLSR () | () | T∗ A () | Notes |
|---|---|---|---|---|---|---|---|
| (MHz) | (K km s-1) | (km s-1) | (km s-1) | (mK) | |||
| C2H3CN | 77633.8 | 81,7-71,6 | 2.6 (0.5) | 63.9 (1.4) | 19.6 (3.2) | 125.8 (15.6) | |
| Unidentified | 77935.5 | 2.9 (1.1) | 65.0 (5.0) | 25.0 (5.0) | 88.1 (18.2) | ||
| C2H5CN | 78183.6 | 91,9-81,8 | 3.6 (0.6) | 64.2 (1.5) | 30.5 (3.5) | 111.0 (11.9) | |
| CH3OCHOc | 78481.3 | 71,7-61,6 A+E | 1.7 (0.4) | 71.7 (1.4) | 24.8 (2.7) | 129.5 (7.6) | bl |
| CH3CHO | 79099.3 | 41,3-31,2 E | 5.6 (0.4) | 70.5 (0.4) | 20.7 (1.0) | 0.3 (11.6) | |
| CH3CHO | 79150.2 | 41,3-31,2 A | 10.0 (0.6) | 70.9 (0.4) | 22.5 (1.0) | 418.0a(16.1) | |
| H13CCCN | 79350.4 | 9K-8K, K=8-7, 9-8, 10-9 | 4.9 (0.3) | 70.5 (0.5) | 22.8 (1.3) | 202.6 (8.8) | hf |
| NH2CN | 79449.7 | 41,4-31,3 | 10.9 (0.5) | 68.4 (0.3) | 19.2 (0.7) | 534.9 (14.2) | |
| C2H5CN | 79677.5 | 90,9-80,8 | 2.6 (0.5) | 64.3 (1.9) | 29.2 (4.5) | 83.8 (11.5) | |
| H2C2N | 79759.4 | 41,4-31,3, J=9/2-7/2 | 2.1 (0.5) | 65.9a(1.7) | 19.1a(3.9) | 103.7 (7.3) | hfa |
| CH3OCHOc | 79783.8 | 70,7-60,6 A+E | 1.6 (0.3) | 75.7 (0.7) | 25.4 (1.7) | 115.9 (6.1) | bl |
| HC5N | 79876.9 | 30-29 | 2.8 (0.2) | 67.4 (0.6) | 22.4 (1.4) | 115.5 (6.4) | |
| NH2CN | 79915.1 | 40,4-30,3 | 1.8 (0.2) | 72.9 (0.8) | 24.0 (2.0) | 68.2 (5.1) | |
| NH2CN | 79963.2 | 42,3-32,2 | 1.1 (0.1) | 63.7 (0.7) | 19.0 (1.5) | 109.9 (7.8) | m |
| NH2CN | 79979.5 | 40,4-30,3 | 4.1 (0.3) | 65.1 (0.4) | 19.0 (1.0) | 200.9 (7.4) | |
| CH2CO | 80076.7 | 41,4-31,3 | 4.2 (0.3) | 68.2 (0.6) | 20.7 (1.3) | 190.8 (9.0) | |
| Unidentified | 80193.2 | 1.6 (0.4) | 65.6 (1.5) | 19.0 (3.5) | 77.8 (10.4) | ||
| Unidentified | 80373.6 | 2.6 (1.0) | 63.6 (3.2) | 25.0 (7.8) | 86.7 (20.3) | ||
| C2H5CN | 80404.9 | 92,8-82,7 | 3.2 (0.4) | 68.8 (1.5) | 35.0 (3.5) | 84.9 (8.2) | |
| H2C2N | 80480.9 | 40,4-30,3, J=9/2-7/2 | 3.9 (0.5) | 61.1a(1.1) | 21.4a(2.2) | 170.7 (10.9) | hfa |
| H2C2N | 80489.9 | 40,4-30,3, J=7/2-5/2 | 2.4 (1.6) | 68.5a(9.2) | 18.9a(10.4) | 119.0a(45.5) | hfa |
| NH2CN | 80504.6 | 41,3-31,2 | 9.1 (0.3) | 65.7 (0.2) | 18.9 (0.4) | 451.4 (7.4) | |
| (CH3)2Ob | 80538.5 | 52,3-51,4 | 2.6 (0.4) | 75.5a(2.4) | 28.4a(4.1) | 86.0 (6.7) | |
| CH2CO | 80832.1 | 40,4-30,3 | 2.0 (0.2) | 65.6 (0.8) | 23.8 (1.8) | 80.1 (4.9) | |
| CH3OH | 80993.2 | 72,6-81,7 A- | 1.0 (0.2) | 62.5 (1.5) | 19.0 (3.4) | 49.0 (7.0) | cd |
| H2C2N | 81207.3 | 41,3-31,2, J=7/2-5/2 | 1.2 (0.2) | 67.2 (0.8) | 18.7 (1.9) | 60.4 (4.8) | hfa |
| H2C2N | 81232.5 | 41,3-31,2, J=9/2-7/2 | 1.3 (0.2) | 70.4 (0.7) | 18.7 (1.7) | 64.2 (4.6) | hfa, cd |
| C2H5CN | 81261.3 | 92,7-82,6 | 2.4 (0.5) | 65.1 (1.8) | 29.2 (4.3) | 76.0a(9.2) | |
| Unidentified | 81337.8 | 1.7 (0.3) | 68.3 (1.5) | 28.1 (3.4) | 57.0 (5.7) | ||
| HNO | 81477.4 | 10,1-00,0 | 1.5 (0.2) | 67.5a(0.8) | 18.7a(2.0) | 77.0 (6.1) | hf |
| CCS | 81505.1 | 67-56 | 4.8 (0.3) | 68.5 (0.4) | 19.6a(0.8) | 232.1 (7.8) | |
| HC13CCN | 81534.1 | 9K-8K, K=8-7, 9-8, 10-9 | 4.1 (0.4) | 64.5a(1.0) | 28.0 (2.0) | 137.3 (8.7) | hf |
| HCC13CN | 81541.9 | 9K-8K, K=8-7, 9-8, 10-9 | 3.8 (0.3) | 67.8 (0.6) | 23.3 (1.6) | 154.2 (5.6) | hf |
| CH2CO | 81586.2 | 41,3-31,2 | 3.5 (0.2) | 66.7 (0.4) | 21.7 (0.8) | 151.1 (4.4) | |
| NH2CHO | 81693.5 | 41,4-31,3 | 6.3 (0.3) | 68.0 (0.4) | 24.3 (1.0) | 245.4 (8.1) | hf |
| HC3N | 81881.4 | 9-8 | 67.2 (1.8) | 66.7 (0.2) | 24.9 (0.5) | 2534.8 (43.0) | |
| c-C3H2 | 82093.5 | 20,2-11,1 | 3.8 (0.4) | 71.0 (0.6) | 18.5 (1.5) | 194.8 (12.1) | |
| HNCS, a-type | 82101.8 | 70,7-60,6 | 1.8 (0.4) | 67.8 (1.6) | 23.9 (3.9) | 70.1 (8.5) | |
| C2H5OH | 82115.7 | 32,2-31,3 | 1.2 (0.3) | 71.8 (1.3) | 18.7 (3.0) | 60.6 (8.4) | |
| Unidentified | 82198.8 | 2.7 (0.2) | 67.9 (0.9) | 27.8 (2.0) | 90.0 (5.0) | ||
| C2H5CN | 82458.5 | 91,8-81,7 | 3.7 (0.3) | 67.6 (0.7) | 29.2 (1.8) | 20.4 (4.7) | |
| HCOCH2OH | 82470.6 | 80,8-71,7 | 1.0 (0.2) | 73.8 (0.9) | 19.6 (2.3) | 47.3 (4.6) | |
| HC5N | 82539.2 | 31-30 | 4.0 (0.6) | 64.0 (1.4) | 27.7 (3.3) | 141.5 (14.0) | |
| NH2CHO | 82549.5 | 11,1-00,0 | 2.9 (0.2) | 67.0 (0.7) | 25.6 (1.8) | 108.9 (4.6) | hf, cl |
| (CH3)2Ob | 82650.1 | 31,3-20,2 | 3.6 (0.2) | 65.6 (0.6) | 27.6 (1.4) | 123.0a(4.3) | |
| O13C34S | 82762.5 | 7-6 | 0.3 | … | … | 33 | |
| c-C3H2 | 82966.2 | 31,2-30,3 | 4.2 (0.2) | 67.4 (0.3) | 18.4 (0.8) | 212.5 (7.5) | |
| OC34S | 83057.9 | 7-6 | 2.1 (0.3) | 65.0 (1.3) | 27.5 (3.0) | 72.4 (6.6) | |
| HNC18O | 83191.5 | 40,4-30,3 | 0.1 | … | … | 39 | hf |
| C2H3CN | 83207.5 | 91,9-81,8 | 2.2 (0.1) | 70.1 (0.5) | 20.4 (1.1) | 98.7 (3.9) | |
| Unidentified | 83404.9 | 2.0 (0.3) | 68.7 (1.2) | 27.4 (2.7) | 69.0 (5.4) | ||
| CH3CHO | 83584.2 | 2-1,2-10,1 E | 2.1 (0.4) | 68.9 (1.2) | 18.2 (3.1) | 0.1a(10.6) | |
| SO2 | 83688.0 | 81,7-80,8 | 4.2 (0.2) | 65.0 (0.4) | 25.9 (0.8) | 153.0 (4.1) | |
| Unidentified | 83900.3 | 5.2 (0.4) | 65.4 (0.6) | 24.2 (1.4) | 202.7 (9.3) | ||
| 13CCH | 84119.3 | N=1-0, F1=2-1, F=5/2-3/2 | 1.2 (0.3) | 67.6 (2.4) | 36.2 (5.7) | 32.0 (4.1) | hf, cd |
| Unidentified | 84139.0 | 0.7 (0.3) | 67.6 (2.4) | 18.1 (5.8) | 37.3 (8.2) | ||
| 13CCH | 84153.3 | N=1-0, F1=1-0, F=3/2-1/2 | 2.1 (0.5) | 84.5 (2.6) | 36.2 (6.1) | 55.1 (7.2) | hf |
| Unidentified | 84183.9 | 1.2 (0.3) | 65.2 (1.4) | 18.1 (3.3) | 60.0 (8.9) | ||
| CH3CHO | 84219.7 | 21,2-10,1 A | 2.7 (0.5) | 74.8 (1.5) | 29.0 (3.6) | 88.6 (10.1) | |
| CH3OCHO | 84449.1 | 72,6-62,5 E | 0.9 (0.3) | 69.5a(1.7) | 18.0 (4.0) | 48.0 (8.4) | |
| CH3OCHO | 84454.7 | 72,6-62,5 A | 1.3 (0.3) | 66.0 (1.3) | 18.0 (3.3) | 69.0 (6.4) | |
| CH3OH | 84521.1 | 5-1,5-40,4 E | 128.0 (5.1) | 68.5 (0.2) | 18.0 (0.6) | 6678.0a(164.6) | |
| NH2CHO | 84542.4 | 40,4-30,3 | 7.3 (0.5) | 71.4 (0.6) | 24.4 (1.3) | 280.2 (11.8) | hf |
| c-C3H2 | 84727.6 | 32,2-31,3 | 0.8 (0.2) | 67.3 (1.4) | 19.8 (3.2) | 38.8 (4.8) | |
| 30SiO | 84745.9 | 2-1 | 2.2 (0.2) | 71.8 (0.6) | 18.0 (1.4) | 116.0a(6.0) | |
| NH2CHO | 84807.9 | 42,3-32,2 | 2.6 (0.2) | 69.0 (0.4) | 20.9 (1.0) | 116.7 (4.3) | hf |
| O13CS | 84865.1 | 7-6 | 0.9 (0.1) | 65.8 (0.9) | 17.9 (2.1) | 45.0a(3.8) | |
| NH2CHO | 84888.9 | 43,2-33,1 | 1.1 (0.1) | 67.5 (0.8) | 17.9 (1.9) | 56.3 (4.6) | hf, bl |
| C2H3CN | 84946.0 | 90,9-80,8 | 2.6 (0.2) | 67.6 (0.7) | 25.8 (1.7) | 93.7 (4.6) | |
| 13CH3OH | 84970.2 | 80,8-71,7 A+ | 1.5 (0.3) | 70.4 (1.9) | 26.9 (4.3) | 52.1 (4.6) | |
| Unidentified | 84980.0 | 1.0 (0.2) | 67.9 (2.5) | 23.7 (5.0) | 37.0 (6.0) | ||
| NH2CHO | 85093.3 | 42,2-32,1 | 3.3 (0.3) | 67.6 (0.7) | 23.0 (1.5) | 136(7.6) | hf |
| OCS | 85139.1 | 7-6 | 20.7 (0.5) | 64.6 (0.2) | 22.2(0.4) | 876.7(12.7) | |
| HC18O+ | 85162.1 | 1-0 | 2.0 (0.8) | 74.5 (2.8) | 17.9 (7.1) | 104.0 (7.6) | |
| HC5N | 85201.6 | 32-31 | 2.4 (0.4) | 67.3 (1.1) | 21.7 (2.6) | 105.3 (10.0) | |
| C13CH | 85229.3 | N=1-0, F1=2-1 F=5/2-3/2 | 2.0 (0.3) | 60.6 (1.5) | 26.8 (3.6) | 68.9 (7.3) | hf |
| C2H5OH | 85265.5 | 60,6-51,5 | 7.2 (0.3) | 64.5 (0.3) | 23.9 (0.8) | 282.9 (7.3) | cl |
| H15NCO | 85292.1 | 40,4-30,3 | 0.3 | … | … | 36 |
| Molecule | Frequency | Transition | Area () | VLSR () | () | T∗ A () | Notes |
|---|---|---|---|---|---|---|---|
| (MHz) | (K km s-1) | (km s-1) | (km s-1) | (mK) | |||
| C2H3CN | 85302.6 | 92,8-82,7 | 1.4 (0.3) | 68.5a(1.8) | 17.8 (3.6) | 72.1 (5.6) | |
| c-C3H2 | 85338.8 | 21,2-10,1 | 8.9 (0.4) | [40, 80] | … | … | |
| 1.6 (0.4) | [80, 110] | … | … | ||||
| HCS+ | 85347.9 | 2-1 | 5.2 (0.6) | 70.4 (0.7) | 17.8 (1.8) | 275.0a(10.4) | bl |
| CHCCH | 85407.2 | 53-43 | 0.4 (0.2) | 65.8 (1.7) | 8.9 (4.1) | 41.8 (9.0) | |
| CHCCH | 85421.8 | 5K-4K, K=0, 1 | 0.7 (0.2) | 80.9 (2.2) | 17.8 (5.2) | 36.6 (6.9) | m, cd |
| CH3CCH | 85442.5 | 53-43 | 2.6 (0.5) | 68.5a(1.1) | 17.8 (2.7) | 137.3 (13.7) | |
| CH3CCH | 85450.7 | 52-42 | 3.5 (0.6) | 69.5a(1.0) | 17.8 (2.7) | 183.0a(16.1) | bl |
| CH3CCH | 85457.2 | 5K-4K, K=0, 1 | 11.2 (0.9) | 66.5 (0.5) | 20.8 (1.4) | 508.6 (25.1) | m |
| HOCO+ | 85531.5 | 40,4-30,3 | 17.3 (0.4) | 64.8 (0.2) | 22.1 (0.4) | 737.4 (10.4) | |
| C2H3CN | 85715.4 | 92,7-82,6 | 1.0 (0.2) | 67.4 (1.5) | 15.7 (3.6) | 56.4 (6.1) | |
| 29SiO | 85759.0 | 2-1 | 2.4 (0.2) | 65.6 (0.6) | 17.8 (1.3) | 129.0a(6.9) | |
| HC15N | 86054.9 | 1-0 | 1.8 (0.2) | [40, 80] | … | … | |
| 1.0 (0.2) | [80, 110] | … | … | ||||
| SO | 86093.9 | 22-11 | 8.0 (0.4) | 67.6 (0.5) | 26.6 (1.1) | 288.0 (10.1) | |
| CCS | 86181.3 | 76-65 | 1.1 (0.2) | 71.9 (1.4) | 19.6a(3.3) | 54.0a(5.7) | |
| (CH3)2Ob | 86226.7 | 22,0-21,1 | 1.7 (0.3) | 76.7 (1.2) | 26.5 (3.5) | 60.6 (5.1) | bl |
| CH3OCHOc | 86265.8 | 73,5-63,4 A+E | 0.8 (0.2) | 62.9 (1.0) | 17.6 (2.2) | 84.0a(7.2) | bl |
| H13CN | 86340.1 | 1-0, F=1-1, 2-1, 0-1 | 9.1 (0.1) | [40,80] | … | … | hf |
| 6.3 (0.1) | [80,110] | … | … | ||||
| HCOOH | 86546.1 | 41,4-31,3 | 1.9 (0.3) | 68.5a(0.8) | 17.6 (2.0) | 102.9 (7.4) | |
| HCO | 86670.7 | 10,1-00,0, J=3/2-1/2, F=2-1 | 2.0 (0.3) | 69.4 (0.9) | 17.6a(2.2) | 108.4 (9.8) | hfa |
| HCO | 86708.3 | 10,1-00,0, J=3/2-1/2, F=1-0 | 1.7 (0.3) | 68.5a(1.3) | 17.6a(3.0) | 89.0a(10.0) | hfa, cd |
| H13CO+ | 86754.2 | 1-0 | 7.3 (0.1) | [40, 80] | … | … | |
| 3.5 (0.1) | [80, 110] | … | … | ||||
| HCO | 86777.4 | 10,1-00,0, J=1/2-1/2, F=1-1 | 1.0 (0.3) | 75.0 (1.6) | 17.5 (3.8) | 54.7 (9.5) | hfa |
| HCO | 86805.7 | 10,1-00,0, J=1/2-1/2, F=0-1 | 0.7 (0.2) | 67.9 (1.4) | 14.9 (3.7) | 45.5 (7.0) | hfa |
| SiO | 86846.9 | 2-1 | 13.9 (0.4) | [40,80] | … | … | |
| 6.4 (0.4) | [80,110] | … | … | ||||
| HN13C | 87090.8 | 1-0 | 11.1 (0.2) | [40, 80] | … | … | |
| 0.1 (0.2) | [80, 110] | … | … | ||||
| CCH | 87284.1 | N=1-0, J=3/2-1/2, F=1-1 | 3.4 (0.5) | 67.2 (0.9) | 17.8 (2.1) | 181.4 (18.1) | hfa |
| CCH | 87316.9 | N=1-0, J=3/2-1/2, F=2-1 | 19.1 (0.8) | 69.1 (0.4) | 26.0 (0.9) | 689.0a(14.9) | hfa |
| CCH | 87328.6 | N=1-0, J=3/2-1/2, F=1-0 | 6.8 (0.8) | 70.3 (0.8) | 17.4a(2.0) | 367.3 (15.0) | hfa |
| CCH | 87402.0 | N=1-0, J=1/2-1/2, F=1-1 | 7.8 (0.5) | 69.5 (0.5) | 16.1 (0.9) | 455.2 (19.4) | hfa, bl |
| CCH | 87407.1 | N=1-0, J=1/2-1/2, F=0-1 | 6.6 (0.5) | 66.8 (0.7) | 23.2 (1.5) | 266.5 (9.2) | hfa, bl |
| CCH | 87446.5 | N=1-0, J=1/2-1/2, F=1-0 | 4.5 (0.3) | 65.4 (0.4) | 20.1 (0.9) | 211.0 (8.3) | hfa, cd |
| HNCO | 87597.3 | 41,4-31,3 | 2.1 (0.4) | 66.6 (1.0) | 17.4 (2.4) | 113.0a(10.9) | hf |
| C2H5OH | 87716.1 | 52,4-51,5 | 1.1 (0.2) | 66.6 (1.2) | 18.8 (2.9) | 53.7 (7.1) | |
| NH2CHO | 87848.9 | 41,3-31,2 | 11.5 (1.1) | 67.8 (0.8) | 26.7 (1.9) | 405.4 (26.2) | hf |
| HC5N | 87863.9 | 33-32 | 2.6 (0.3) | 69.5 (1.0) | 22.2 (2.3) | 109.0 (8.2) | |
| HNCO | 87925.2 | 40,4-30,3 | 140.2 (3.2) | 66.1 (0.2) | 24.6 (0.4) | 5355.9 (78.9) | hf |
| H13CCCN | 88166.8 | 10K-9K, K=10-9, 11-10, 9-8 | 4.1 (0.3) | 67.5 (0.5) | 23.6 (1.1) | 162.8 (6.3) | hf |
| HNCO | 88239.0 | 41,3-31,2 | 3.1 (0.4) | 65.9 (1.2) | 25.9 (3.1) | 113.6 (8.5) | hf |
| C2H5CN | 88323.7 | 100,10-90,9 | 1.7 (0.3) | 68.7 (1.1) | 22.9 (2.6) | 69.0a(7.1) | |
| HCN | 88631.8 | 1-0, F=0-1, 1-1, 2-1 | 53.9 (0.2) | [40,80] | … | … | hf |
| 34.2 (0.2) | [80,110] | … | … | ||||
| CH3OCHO | 88843.2 | 71,6-61,5 E | 0.6 (0.2) | 70.1 (2.5) | 17.1 (6.1) | 30.0a(7.7) | |
| CH3OCHO | 88851.6 | 71,6-61,5 A | 1.0 (0.4) | 67.7 (2.6) | 17.1 (5.9) | 56.8 (14.0) | |
| H15NC | 88865.7 | 1-0 | 1.7 (0.2) | [40, 80] | … | … | |
| HCO+ | 89188.5 | 1-0 | 34.6 (0.2) | [40, 80] | … | … | |
| 24.6 (0.2) | [80, 110] | … | … | ||||
| CH3OCHOc | 89316.6 | 81,8-71,7 A+E | 1.4 (0.2) | 66.6 (0.6) | 25.7 (1.6) | 101.4 (5.1) | bl |
| 13CH3CN | 89331.3 | 5K-4K K=0, 1 | 2.0 (0.2) | 69.7 (1.0) | 25.6 (2.5) | 74.9 (4.9) | hf, bl |
| HCCNC | 89419.3 | 9-8 | 0.7 (0.3) | 70.1 (3.1) | 21.5 (8.1) | 28.8 (6.9) | hf |
| HOC+ | 89487.4 | 1-0 | 1.1 (0.1) | 68.0 (0.8) | 19.4 (2.0) | 51.8 (4.3) | |
| HCOOH | 89579.1 | 40,4-30,3 | 2.4 (0.2) | 66.5a(0.8) | 20.0 (1.9) | 91.0a(6.6) | |
| HCOOH | 89861.4 | 42,3-32,2 | 1.0 (0.3) | 60.3 (2.7) | 25.4 (7.1) | 36.8 (4.6) | |
| C2H5OH | 90117.6 | 41,4-30,3 | 6.7 (0.3) | 65.0 (0.3) | 21.6 (0.8) | 290.8 (7.9) | |
| CH3OCHO | 90145.6 | 72,5-62,4 E | 1.1 (0.4) | 64.7 (2.5) | 16.9 (6.3) | 58.3 (9.7) | |
| CH3OCHO | 90156.4 | 72,5-62,4 A | 1.1 (0.3) | 66.0 (1.5) | 18.1 (3.9) | 57.4 (7.5) | |
| HCOOH | 90164.6 | 42,2-32,1 | 1.5 (0.5) | 65.8 (1.9) | 17.3 (4.6) | 81.0 (14.6) | cl |
| CH3COOH | 90203.3 | 8∗,8-7∗,7 E | 0.3 | … | … | 33 | |
| CH3OCHOc | 90229.6 | 80,8-70,7 A+E | 1.1 (0.3) | 69.9 (0.9) | 18.8 (2.1) | 88.9 (9.0) | bl |
| C2H5CN | 90453.2 | 102,8-92,7 | 1.6 (0.3) | 70.2 (1.4) | 25.2 (3.4) | 58.6 (5.3) | |
| HC5N | 90526.2 | 34-33 | 2.0 (0.2) | 67.1 (0.9) | 23.6 (2.2) | 78.3 (6.2) | |
| HC13CCN | 90593.0 | 10K-9K, K=9-8, 10-9, 11-10 | 5.5 (0.5) | 65.7 (1.1) | 25.2 (2.1) | 203.6 (9.2) | hf |
| HCC13CN | 90601.7 | 10K-9K, K=9-8, 10-9, 11-10 | 3.8 (0.4) | 68.8 (0.9) | 22.6 (1.9) | 158.3 (6.6) | hf |
| HNC | 90663.5 | 1-0 | 39.4 (0.3) | [40, 80] | … | … | |
| 17.1 (0.3) | [80, 110] | … | … | ||||
| SiS | 90771.5 | 5-4 | 3.6 (1.0) | 69.5a(3.7) | 25.2 (6.6) | 136.1 (12.3) | |
| (CH3)2Ob | 90938.0 | 60,6-51,5 | 4.2 (0.4) | 66.9 (0.6) | 21.9 (1.4) | 179.1 (11.1) | |
| HC3N | 90979.0 | 10-9 | 64.3 (1.8) | 67.4 (0.2) | 23.6 (0.5) | 2557.7 (46.4) | |
| C2H5CN | 91549.1 | 101,9-91,8 | 2.2 (0.5) | 64.1 (2.1) | 27.1 (4.5) | 75.4 (7.4) | |
| Unidentified | 91750.0 | 1.6 (0.2) | 70.3 (0.8) | 18.6 (2.0) | 78.5 (7.8) | ||
| Unidentified | 91848.0 | 3.7 (0.3) | 67.4 (0.7) | 21.4 (1.6) | 160.3 (8.3) |
| Molecule | Frequency | Transition | Area () | VLSR () | () | T∗ A () | Notes |
|---|---|---|---|---|---|---|---|
| (MHz) | (K km s-1) | (km s-1) | (km s-1) | (mK) | |||
| CHCN | 91941.5 | 5K-4K, K=0, 1 | 1.7 (0.4) | 67.7 (1.6) | 24.8 (3.9) | 64.9 (8.5) | hf, m |
| CH3CN, v8=0,1 | 91959.2 | 54-44 | 1.9 (0.6) | 71.7 (1.7) | 17.4 (3.9) | 102.2 (19.2) | hf |
| CH3CN, v8=0,1 | 91971.3 | 53-43 | 6.4 (0.8) | 70.4 (0.8) | 21.8 (2.0) | 275.2 (19.4) | hf |
| CH3CN, v8=0,1 | 91980.0 | 52-42 | 6.5 (1.3) | 69.3 (1.4) | 16.6a(2.7) | 370.0a(44.0) | hf |
| CH3CN, v8=0,1 | 91987.0 | 5K-4K, K=0, 1 | 19.1 (0.8) | 73.6 (0.4) | 24.8 (0.9) | 722.4 (15.8) | hf, m |
| C2H3CN | 92426.2 | 101,10-91,9 | 1.2 (0.2) | 67.9 (0.8) | 18.3 (1.8) | 62.0 (4.6) | |
| 13CS | 92494.3 | 2-1 | 4.7 (0.5) | [45,80] | … | … | |
| Unidentified | 92724.8 | 2.5 (0.3) | 66.3 (1.0) | 29.0 (2.3) | 81.0 (6.0) | ||
| NH2CHO | 105464.2 | 50,5-40,4 | 7.7 (0.3) | 64.6 (0.3) | 24.1 (0.8) | 299.6 (8.9) | hf |
| HNCS, a-type | 105558.0 | 90,9-80,8 | 1.6 (0.2) | 64.4 (0.8) | 21.6 (1.8) | 68.3 (4.6) | |
| 13C15N | 105747.7 | 12,1-01,0 | 1.9 (0.2) | 67.9 (1.0) | 23.7 (2.3) | 73.5 (6.2) | hf, cl |
| CH2NH | 105793.9 | 40,4-31,3 | 2.4 (0.4) | 71.5a(1.0) | 14.4 (1.7) | 157.0 (18.8) | hf, bl |
| H13CCCN | 105799.0 | 12K-11K, K=12-11, 13-12, 11-10 | 2.7 (0.4) | 70.5 (1.0) | 14.4 (1.9) | 173.2 (7.7) | hf, bl |
| NH2CHO | 105972.6 | 52,4-42,3 | 2.5 (0.2) | 67 (0.6) | 21.9 (1.4) | 105.4 (6.0) | hf |
| Unidentified | 106302.5 | 2.8 (0.8) | 68.5 (3.0) | 21.5 (5.6) | 124.1 (9.1) | ||
| Unidentified | 106311.8 | 4.9 (0.5) | 70.0 (0.8) | 21.5 (1.9) | 214.0 (12.0) | ||
| CCS | 106347.7 | 89-78 | 2.2 (0.1) | 66.9 (0.4) | 19.6a(0.9) | 104.8 (4.6) | |
| HC5N | 106499.4 | 40-39 | 1.3 (0.4) | 64.5a(3.0) | 21.4 (5.3) | 56.5 (9.0) | |
| NH2CHO | 106541.7 | 52,3-42,2 | 2.2 (0.2) | 68.6 (0.8) | 21.4 (1.8) | 95.6 (6.6) | hf |
| C2H3CN | 106641.3 | 111,10-101,9 | 1.0 (0.2) | 74.2 (0.9) | 16.7 (2.2) | 56.0 (6.9) | |
| (CH3)2Ob | 106777.3 | 91,8-82,7 | 0.9 (0.3) | 72.2 (1.9) | 14.3 (4.3) | 60.0 (11.2) | |
| OC34S | 106787.3 | 9-8 | 1.6 (0.2) | 67.5a(0.9) | 21.4 (2.3) | 69.3 (4.9) | |
| HOCO+ | 106913.5 | 50,5-40,4 | 13.6 (0.4) | 68.0 (0.2) | 21.1 (0.5) | 606.0 (11.8) | |
| CH3OH | 107013.8 | 31,3-40,4 A+ | -2.7 (…) | 66.1 (3.1) | 40.0 (7.0) | -64.1 (…) | al |
| C2H5CN | 107043.5 | 122,11-112,10 | 1.8 (0.3) | 68.7 (1.3) | 21.3 (3.2) | 77.8 (9.1) | |
| Unidentified | 107100.0 | 0.9 (0.2) | 68.5 (1.3) | 18.6 (3.1) | 47.2 (6.5) | ||
| Unidentified | 107134.6 | 3.2 (0.2) | 70.6 (0.5) | 21.4 (1.1) | 139.6 (6.2) | ||
| 13CH3CN | 107178.5 | 63-53 | 0.5 (0.2) | 72.4 (1.8) | 16.4 (4.2) | 28.7 (7.2) | hf |
| 13CH3CN | 107196.5 | 6K-5K, K=0, 1 | 1.5 (0.2) | 74.6 (1.0) | 21.3 (2.23) | 66.1 (5.68) | hf, bl |
| HCOOH | 108126.7 | 51,5-41,4 | 2.2 (0.3) | 67.5a(1.0) | 21.1a(2.5) | 97.8 (5.2) | |
| 13CN | 108636.9 | N=1-0, F1=0, F2=1-0, F=1-1 | 2.5 (0.6) | 57.6 (4.1) | 35.0 (7.3) | 67.2 (6.3) | hf |
| 13CN | 108651.2 | N=1-0, F1=0, F2=1-0, F=2-1 | 2.0 (0.4) | 56.8 (2.3) | 32.6 (4.8) | 56.7 (5.6) | hf |
| HC13CCN | 108710.5 | 12K-11K, K=12-11, 13-12, 11-10 | 2.3 (0.4) | 69.0 (1.9) | 25.4 (3.8) | 86.1 (6.5) | hf |
| HCC13CN | 108721.0 | 12K-11K, K=12-11, 13-12, 11-10 | 1.6 (0.3) | 68.7 (1.7) | 22.0 (3.8) | 68.7 (6.4) | hf |
| 13CN | 108780.2 | N=1-0, F1=1, F2=2-1, F=3-2 | 1.6 (0.2) | 69.4 (0.9) | 21.0 (2.1) | 71.8 (5.9) | hf |
| 13CN | 108786.9 | N=1-0, F1=1, F2=2-1, F=1-0 | 0.7 (0.2) | 69.8 (1.0) | 13.3 (2.7) | 51.2 (6.1) | hfa |
| 13CN | 108796.4 | N=1-0, F1=1, F2=2-1, F=2-2 | 0.9 (0.2) | 71.3 (1.0) | 17.8 (2.4) | 48.9 (5.9) | hf, cd |
| CH3OH | 108893.9 | 00,0-1-1,1 E | 12.1 (0.3) | [40,80] | … | … | |
| 2.4 (0.3) | [80,110] | … | … | ||||
| O13CS | 109110.8 | 9-8 | 0.6 (0.2) | 66.4 (1.7) | 17.1 (3.9) | 32.4 (7.8) | |
| HC3N | 109173.6 | 12-11 | 47.3 (1.2) | 66.9 (0.2) | 23.0 (0.4) | 1932.8 (31.5) | |
| SO | 109252.2 | 32-21 | 8.2 (0.3) | 67.6 (0.2) | 20.3 (0.5) | 380.4 (7.9) | |
| OCS | 109463.0 | 9-8 | 19.5 (0.5) | 65.8 (0.2) | 22.4 (0.4) | 819.0 (13.4) | |
| HNCO | 109496.0 | 51,5-41,4 | 2.8 (0.4) | 64.3 (1.0) | 20.7 (2.4) | 127.1 (12.5) | hf |
| C2H5CN | 109650.2 | 121,11-111,10 | 2.0 (0.3) | 64.6 (1.4) | 27.9 (3.3) | 67.3 (7.7) | |
| NH2CHO | 109753.5 | 51,4-41,3 | 5.0 (0.4) | 66.9 (0.5) | 21.5 (1.2) | 220.2 (10.4) | hf |
| C18O | 109782.1 | 1-0 | 23.4 (0.9) | 66.8 (0.3) | 25.7 (0.8) | 855.2 (21.5) | |
| HNCO | 109905.7 | 50,5-40,4 | 111.9 (2.7) | 67.6 (0.2) | 23.8 (0.4) | 4420.4 (68.9) | hf |
| 13CO | 110201.3 | 1-0 | 148.6 (5.5) | 67.5a(0.3) | 27.6 (0.9) | 5052.1 (95.0) | |
| HNCO | 110298.0 | 51,4-41,3 | 3.5 (0.6) | 63.1 (1.3) | 20.7 (3.1) | 157.0a(13.9) | hf |
| CHCN | 110328.8 | 6K-5K, K=0, 1 | 2.0 (0.3) | 69.7 (0.8) | 20.7 (2.0) | 89.3 (7.8) | hf, m, cd |
| CH3CN, v8=0,1 | 110349.7 | 64-54 | 1.4 (0.6) | 70.0 (2.2) | 15.6 (5.3) | 82.0 (23.0) | hf |
| CH3CN, v8=0,1 | 110364.4 | 63-53 | 7.5 (0.8) | 68.5 (0.7) | 20.7 (1.8) | 338.1 (18.4) | hf |
| CH3CN, v8=0,1 | 110374.9 | 62-52 | 8.6 (2.6) | 70.5a(1.8) | 20.7 (6.1) | 390.0a(26.9) | hf |
| CH3CN, v8=0,1 | 110383.4 | 6K-5K, K=0, 1 | 25.1 (0.9) | 74.2 (0.3) | 27.6 (0.8) | 853.4 (16.4) | hf, m |
| CH3OCHOc | 110790.5 | 101,10-91,9 A+E | 0.8 (0.2) | 70.7 (0.7) | 20.6 (1.8) | 71.7 (5.4) | bl |
| CH3OCHOc | 111682.1 | 91,8-81,7 A+E | 1.4 (0.6) | 76.6 (2.1) | 27.3 (5.0) | 96.0a(7.1) | bl |
| HCOOH | 111746.7 | 50,5-40,4 | 2.9 (0.5) | 70.4a(1.6) | 20.4a(3.3) | 134.5 (8.4) | |
| (CH3)2Ob | 111783.0 | 70,7-61,6 | 3.5 (0.4) | 65.3 (0.8) | 20.4 (1.9) | 159.4 (11.5) | |
| CH3CHO | 112248.7 | 61,6-51,5 A | 3.8 (0.6) | 61.8 (0.8) | 31.7 (1.8) | 226.9 (12.2) | bl |
| CH3CHO | 112254.5 | 6-1,6-5-1,5 E | 3.8 (0.5) | 77.3 (0.7) | 31.7 (1.6) | 0.2 (10.4) | bl |
| C17O | 112358.9 | 1-0 | 5.0 (0.5) | 65.7 (0.7) | 23.6 (1.7) | 200.7 (11.8) | |
| Unidentified | 112464.0 | 1.9 (1.0) | 68.6 (4.0) | 26.2 (8.0) | 68.8 (20.0) | ||
| C2H5OH | 112807.1 | 22,1-11,0 | 4.2 (0.4) | 67.2 (0.9) | 30.3 (2.4) | 130.9 (6.2) | |
| CN | 113123.3 | N=1-0, J=1/2-1/2, F=1/2-1/2 | 3.8 (0.4) | 70.5a(0.5) | 13.5 (1.1) | 264.0a(14.6) | hfa, ot, cd |
| CN | 113144.1 | N=1-0, J=1/2-1/2, F=1/2-3/2 | 0.8 (0.2) | [49.5, 79.5] | … | … | hfa |
| CN | 113170.5 | N=1-0, J=1/2-1/2, F=3/2-1/2 | 2.5 (0.2) | [49.5, 79.5] | … | … | hfa |
| CN | 113191.3 | N=1-0, J=1/2-1/2, F=3/2-3/2 | 1.9 (0.2) | [49.5, 79.5] | … | … | hfa |
| CN | 113490.9 | N=1-0, J=3/2-1/2, F=5/2-3/2 | 7.0 (0.2) | [49.5, 79.5] | … | … | hf |
| CN | 113508.9 | N=1-0, J=3/2-1/2, F=3/2-3/2 | 2.3 (0.2) | [49.5, 79.5] | … | … | hfa |
- •
Notes: (bl) blended line; (m) multitransition line (frequency refers to the main component of the group); (hf) hyperfine structure (frequency refers to the main component of the group); (hfa) hyperfine component, it is possible to resolve this hyperfine component since its frequency is sufficiently far from the frequencies of the other hyperfine components; (ot) transition less affected by opacity; (cl) this line is contaminated by the emission from an unknown molecular species; (al) absorption line; (cd) this transition is used to derive the column density (although several transitions of this molecule are detected, there is an insufficient dynamical range in to derive the column density by using a RD).
- •
a Parameter fixed in the Gaussian fit.
- •
b Substates EE, AA, EA, AE blended, we show just the most intense transition.
- •
c Frequency refers to species A.
| Molecule | Frequency | Transition | Area () | VLSR () | () | T () | Notes |
|---|---|---|---|---|---|---|---|
| (MHz) | (K km s-1) | (km s-1) | (km s-1) | (mK) | |||
| C2H3CN | 77633.8 | 81,7-71,6 | 1.8 (0.4) | 21.9 (1.2) | 19.6 (2.9) | 88.0 (12.0) | |
| CH3CHO | 79099.3 | 41,3-31,2 E | 4.8 (0.5) | 20.3 (0.7) | 20.2 (1.6) | 222.1 (15.6) | |
| CH3CHO | 79150.2 | 41,3-31,2 A | 4.5 (0.8) | 17.5 (1.2) | 19.2 (2.7) | 220.0a(23.9) | |
| H13CCCN | 79350.4 | 9K-8K, K=8-7, 9-8, 10-9 | 2.7 (0.5) | 16.7 (1.1) | 19.2 (2.8) | 131.0a(11.7) | hf |
| NH2CN | 79449.7 | 41,4-31,3 | 5.9 (0.4) | 20.1 (0.4) | 19.2 (1.0) | 290.0a(11.7) | |
| C2H5CN | 79677.5 | 90,9-80,8 | 1.8 (0.3) | 16.2 (1.2) | 19.1 (2.9) | 87.0a(9.4) | |
| HC5N | 79876.9 | 30-29 | 2.4 (0.3) | 18.2 (0.8) | 19.6 (1.8) | 115.8 (9.4) | |
| NH2CN | 79963.2 | 42,3-32,2 | 1.3 (0.3) | 17.6 (1.5) | 19.0 (3.6) | 65.0a(9.3) | m |
| NH2CN | 79979.5 | 40,4-30,3 | 2.5 (0.4) | 21.2 (1.0) | 19.0 (2.4) | 124.0a(13.1) | |
| CH2CO | 80076.7 | 41,4-31,3 | 2.2 (0.2) | 20.7 (0.5) | 17.2 (1.1) | 119.6 (6.2) | |
| Unidentified | 80282.8 | 0.9 (0.2) | 18.5 (1.0) | 15.8 (2.3) | 51.3 (6.2) | ||
| Unidentified | 80373.6 | 1.5 (0.4) | 20.0 (2.5) | 29.1 (5.5) | 48.2 (8.3) | ||
| C2H5CN | 80404.9 | 92,8-82,7 | 1.0 (0.3) | 17.2 (2.3) | 24.7a(5.5) | 39.2 (8.1) | |
| H2C2N | 80480.9 | 40,4-30,3, J=9/2-7/2 | 2.1 (0.4) | 17.6 (1.2) | 19.7 (2.9) | 100.3 (8.1) | hfa, cd |
| H2C2N | 80489.9 | 40,4-30,3, J=7/2-5/2 | 2.2 (0.4) | 20.6 (1.0) | 18.9 (2.5) | 105.3 (8.6) | hfa |
| NH2CN | 80504.6 | 41,3-31,2 | 5.1 (0.6) | 21.2 (0.6) | 18.9 (1.5) | 260.9 (17.7) | |
| (CH3)2Ob | 80538.5 | 52,3-51,4 | 1.9 (0.4) | 20.2 (1.9) | 28.4 (4.4) | 61.8 (8.0) | |
| CH2CO | 80832.1 | 40,4-30,3 | 1.3 (0.3) | 21.2 (1.6) | 18.8 (3.8) | 53.0a(7.1) | |
| CH3OH | 80993.2 | 72,6-81,7 A- | 0.3 | … | … | 33 | cd |
| HNO | 81477.4 | 10,1-00,0 | 1.2 (0.2) | 17.2a(1.2) | 20.6 (2.7) | 53.4 (6.4) | hf |
| CCS | 81505.1 | 76-65 | 3.4 (0.5) | 20.8 (1.0) | 19.9 (2.3) | 159.2 (13.4) | |
| HC13CCN | 81534.1 | 9K-8K, K=8-7, 9-8, 10-9 | 1.8 (0.2) | 19.0 (0.6) | 17.5 (1.5) | 96.3 (4.8) | hf |
| HCC13CN | 81541.9 | 9K-8K, K=8-7, 9-8, 10-9 | 2.1 (0.2) | 18.4 (0.5) | 18.4 (1.2) | 108.5 (5.0) | hf |
| CH2CO | 81586.2 | 41,3-31,2 | 2.4 (0.2) | 15.9 (0.4) | 18.7(0.9) | 120.0a(4.52) | |
| NH2CHO | 81693.5 | 41,4-31,3 | 3.0 (0.3) | 11.0 (0.7) | 18.1 (1.7) | 157.3 (10.0) | hf |
| HC3N | 81881.4 | 9-8 | 50.0 (0.6) | 17.4 (0.1) | 18.6 (0.2) | 2527.7 (19.7) | |
| c-C3H2 | 82093.5 | 20,2-11,1 | 4.7 (0.3) | 19.9 (0.3) | 17.8 (0.8) | 246.3 (9.1) | |
| HNCS, a-type | 82101.8 | 70,7-60,6 | 0.9 (0.3) | 21.2a(2.0) | 18.5 (4.7) | 45.0a(8.3) | |
| Unidentified | 82198.8 | 0.6 (0.2) | 17.2 (1.8) | 18.5 (4.3) | 30.2 (5.5) | ||
| C2H5CN | 82458.5 | 91,8-81,7 | 1.4 (0.4) | 23.9 (1.8) | 18.5 (4.2) | 69.0a(10.3) | |
| HCOCH2OH | 82470.6 | 80,8-71,7 | 0.7 | … | … | 60) | |
| HC5N | 82539.2 | 31-30 | 1.9 (0.4) | 18.0 (0.6) | 21.0 (1.6) | 76.3 (3.7) | |
| NH2CHO | 82549.5 | 11,1-00,0 | 0.4 (0.1) | 17.2 (1.4) | 18.4 (3.4) | 25.1 (4.0) | hf, cl |
| c-C3H2 | 82966.2 | 31,2-30,3 | 2.1 (0.1) | 18.1 (0.4) | 18.4 (1.0) | 108.3 (4.8) | |
| OC34S | 83057.9 | 7-6 | 0.3 | … | … | 39 | |
| HNC18O | 83191.5 | 40,4-30,3 | 0.1 | … | … | 30 | hf |
| C2H3CN | 83207.5 | 91,9-81,8 | 0.7 (0.2) | 18.2a(1.2) | 17.2 (2.8) | 37.7 (5.2) | |
| SO2 | 83688.0 | 81,7-80,8 | 1.0 (0.2) | 18.6 (1.0) | 17.5 (2.4) | 55.6 (6.5) | |
| Unidentified | 83900.3 | 2.0 (0.2) | 14.6 (0.5) | 16.7 (1.1) | 111.0 (6.2) | ||
| 13CCH | 84153.3 | N=1-0, F1=1-0, F=3/2-1/2 | 1.0 (0.3) | 27.9 (2.3) | 27.1 (5.4) | 34.1 (5.9) | hf |
| CH3CHO | 84219.7 | 21,2-10,1 A | 0.9 (0.6) | 22.2a(3.4) | 18.1 (…) | 47.0a(6.1) | |
| CH3OH | 84521.1 | 5-1,5-40,4 E | 50.0 (2.0) | 19.0 (0.2) | 15.0 (0.5) | 3140.3 (80.2) | |
| NH2CHO | 84542.4 | 40,4-30,3 | 3.9 (0.3) | 19.3 (0.4) | 16.4 (1.0) | 223.7 (8.2) | hf |
| 30SiO | 84745.9 | 2-1 | 1.8 (0.2) | 19.7 (0.5) | 17.8 (1.1) | 95.0 (5.2) | |
| NH2CHO | 84807.9 | 42,3-32,2 | 0.5 (0.1) | 21.2 (0.6) | 10.4 (1.3) | 41.2 (4.7) | hf |
| O13CS | 84865.1 | 7-6 | 0.3 | … | … | 36 | |
| C2H3CN | 84946.0 | 90,9-80,8 | 1.0 (0.1) | 18.8 (0.6) | 15.4 (1.3) | 60.3 (4.3) | |
| 13CH3OH | 84970.2 | 80,8-71,7 A+ | 0.2 | … | … | 24 | |
| NH2CHO | 85093.3 | 42,2-32,1 | 1.1 (0.3) | 21.8 (1.5) | 20.0 (3.5) | 53.1 (7.6) | hf |
| OCS | 85139.1 | 7-6 | 10.3 (0.4) | 17.9 (0.2) | 18.2 (0.6) | 534.9 (12.9) | |
| HC18O+ | 85162.1 | 1-0 | 1.2 (0.2) | 23.4 (1.2) | 20.9 (2.8) | 55.6 (6.4) | |
| HC5N | 85201.6 | 32-31 | 2.0 (0.4) | 22.8 (1.2) | 17.9 (2.9) | 104.1 (13.2) | |
| C13CH | 85229.3 | N=1-0, F1=2-1 F=5/2-3/2 | 0.7 | … | … | 81 | hf |
| C2H5OH | 85265.5 | 60,6-51,5 | 3.3 (0.2) | 21.2 (0.3) | 18.7a(0.7) | 163.8 (5.7) | cl |
| H15NCO | 85292.1 | 40,4-30,3 | 0.3 | … | … | 27 | |
| c-C3H2 | 85338.8 | 21,2-10,1 | 0.8 (0.2) | 19.2a(2.1) | 18.0 (5.0) | 40.0a(6.0) | |
| HCS+ | 85347.9 | 2-1 | 2.5 (0.6) | 21.8 (1.7) | 17.8 (4.2) | 133.4 (13.3) | |
| CHCCH | 85421.8 | 5K-4K, K=0, 1 | 0.3 | … | … | 39 | m |
| CH3CCH | 85442.5 | 53-43 | 0.8 (0.1) | 21.2a(7.4) | 17.8 (…) | 42.1 (…) | |
| CH3CCH | 85450.7 | 52-42 | 0.9 (0.2) | 22.2a(1.1) | 17.8 (2.9) | 47.8 (5.1) | bl |
| CH3CCH | 85457.2 | 5K-4K, K=0, 1 | 3.7 (0.3) | 18.5 (0.5) | 17.8 (1.1) | 196.7 (9.5) | m |
| HOCO+ | 85531.5 | 40,4-30,3 | 6.7 (0.2) | 18.5 (0.2) | 18.4 (0.5) | 341.1 (8.3) | |
| 29SiO | 85759.0 | 2-1 | 4.1 (0.6) | 21.8 (1.0) | 21.8 (2.4) | 177.0a(16.2) | |
| HC15N | 86054.9 | 1-0 | 3.6 (0.4) | [-0.8 47.2] | … | … | |
| SO | 86093.9 | 22-11 | 3.3 (0.9) | 19.9 (1.7) | 18.9 (4.0) | 162.0a(29.0) | |
| H13CN | 86340.1 | 1-0, F=1-1, 2-1, 0-1 | 27.1 (0.3) | [-0.8 47.2] | … | … | hf |
| HCO | 86708.3 | 10,1-00,0, J=3/2-1/2, F=1-0 | 0.8 | … | … | 96 | hfa |
| H13CO+ | 86754.2 | 1-0 | 10.1 (0.3) | [0.2 36.2] | … | … | |
| SiO | 86846.9 | 2-1 | 33.2 (0.9) | 18.2a(0.2) | 20.3 (0.4) | 1537.8 (27.4) | |
| HN13C | 87090.8 | 1-0 | 14.4 (0.6) | 16.8 (0.3) | 19.3 (0.6) | 697.2 (18.2) | |
| CCH | 87284.1 | N=1-0, J=3/2-1/2, F=1-1 | 3.9 (0.4) | 19.8 (0.6) | 21.3 (1.5) | 173.8 (11.6) | hfa, cd |
| CCH | 87316.9 | N=1-0, J=3/2-1/2, F=2-1 | 19.3 (0.7) | 18.5 (0.2) | 18.6 (0.5) | 971.7 (22.3) | hfa |
| CCH | 87328.6 | N=1-0, J=3/2-1/2, F=1-0 | 7.0 (0.6) | 18.3 (0.5) | 15.7 (1.1) | 419.0 (24.3) | hfa |
| CCH | 87402.0 | N=1-0, J=1/2-1/2, F=1-1 | 16.4 (0.7) | 15.6 (0.4) | 26.1 (0.9) | 590.0a(14.4) | hfa, bl |
| CCH | 87407.1 | N=1-0, J=1/2-1/2, F=0-1 | 4.0 (1.9) | 20.8 (5.8) | 22.5 (7.5) | 164.8 (58.9) | hfa, bl |
| CCH | 87446.5 | N=1-0, J=1/2-1/2, F=1-0 | 2.9 (0.6) | 18.1 (1.1) | 17.5 (2.5) | 157.4 (19.1) | hfa |
| Molecule | Frequency | Transition | Area () | VLSR () | () | T () | Notes |
|---|---|---|---|---|---|---|---|
| (MHz) | (K km s-1) | (km s-1) | (km s-1) | (mK) | |||
| HNCO | 87597.3 | 41,4-31,3 | 1.4 (0.5) | 19.2a(2.1) | 17.4 (5.1) | 75.0a(13.4) | hf |
| NH2CHO | 87848.9 | 41,3-31,2 | 4.1 (0.5) | 17.9 (0.7) | 18.4 (1.8) | 211.3 (17.5) | hf |
| HC5N | 87863.9 | 33-32 | 2.3 (0.4) | 20.0 (0.9) | 17.3 (2.2) | 126.6 (12.5) | |
| HNCO | 87925.2 | 40,4-30,3 | 62.4 (1.1) | 17.7 (0.1) | 17.5 (0.2) | 3358.4 (39.0) | hf |
| H13CCCN | 88166.8 | 10K-9K, K=10-9, 11-10, 9-8 | 2.1 (0.4) | 23.6 (1.0) | 17.3 (2.4) | 113.3 (11.0) | hf |
| HCN | 88631.8 | 1-0, F=0-1, 1-1, 2-1 | 123.8 (0.2) | [-0.8 47.2] | … | … | hf |
| CH3OCHO | 88843.2 | 71,6-61,5 E | 1.2 (0.4) | 17.7 (2.1) | 17.1 (5.1) | 65.0a(11.3) | |
| H15NC | 88865.7 | 1-0 | 1.1 (0.2) | 21.5 (1.3) | 20.2 (3.2) | 52.1 (7.8) | |
| HCO+ | 89188.5 | 1-0 | 74.2 (0.2) | [0.2 36.2] | … | … | |
| HCCNC | 89419.3 | 9-8 | 0.3 | … | … | 39 | hf |
| HOC+ | 89487.4 | 1-0 | 0.3 | … | … | 39 | |
| HCOOH | 89579.1 | 40,4-30,3 | 1.2 (0.2) | 18.6 (0.9) | 18.4 (2.1) | 60.6 (6.2) | cd |
| HCOOH | 89861.4 | 42,3-32,2 | 1.7 (0.3) | 20.3 (2.3) | 30.0 (4.1) | 46.1 (6.7) | |
| C2H5OH | 90117.6 | 41,4-30,3 | 2.5 (0.2) | 18.6 (0.5) | 16.9 (1.1) | 138.4 (7.8) | cd |
| CH3COOH | 90203.3 | 8∗,8-7∗,7 E | 0.3 | … | … | 36 | |
| HC5N | 90526.2 | 34-33 | 2.0 (0.2) | 19.1 (0.7) | 18.4 (1.6) | 102.0 (8.1) | |
| HC13CCN | 90593.0 | 10K-9K, K=9-8, 10-9, 11-10 | 1.9 (0.2) | 20.5 (0.6) | 16.8 (1.5) | 103.3 (7.6) | hf |
| HCC13CN | 90601.7 | 10K-9K, K=9-8, 10-9, 11-10 | 0.8 (0.2) | 18.7 (1.3) | 15.1 (3.2) | 52.2 (8.6) | hf |
| HNC | 90663.5 | 1-0 | 101.3 (3.6) | 19.1 (0.3) | 25.7 (0.7) | 3709.2 (85.1) | |
| SiS | 90771.5 | 5-4 | 1.4 (0.3) | 21.2a(1.1) | 16.8 (2.6) | 78.5 (11.0) | |
| (CH3)2Ob | 90938.0 | 60,6-51,5 | 2.5 (0.5) | 17.8 (2.0) | 27.7 (4.7) | 84.0a(8.8) | |
| HC3N | 90979.0 | 10-9 | 47.4 (0.8) | 18.3 (0.1) | 18.2 (0.2) | 2441.8 (26.1) | |
| C2H5CN | 91549.1 | 101,9-91,8 | 1.1 (0.5) | 20.3 (2.3) | 16.6 (6.1) | 64.0a(13.1) | |
| Unidentified | 91848.0 | 3.1 (0.4) | 23.0 (1.3) | 24.9 (2.9) | 115.9 (8.0) | ||
| CH3CN, v8=0,1 | 91959.2 | 54-44 | 1.0 (0.3) | 21.6 (1.3) | 12.3 (3.2) | 75.9 (16.6) | hf |
| CH3CN, v8=0,1 | 91971.3 | 53-43 | 4.5 (0.4) | 20.8 (0.4) | 15.2 (1.0) | 277.2 (14.6) | hf |
| CH3CN, v8=0,1 | 91980.0 | 52-42 | 4.6 (0.5) | 20.2a(0.5) | 16.6 (1.2) | 259.0a(16.4) | hf |
| CH3CN, v8=0,1 | 91987.0 | 5K-4K, K=0, 1 | 17.9 (0.5) | 17.2a(0.2) | 21.1 (0.5) | 793.5 (13.0) | hf, m |
| 13CS | 92494.3 | 2-1 | 5.7 (0.2) | 18.7 (0.2) | 21.3 (0.6) | 251.8 (5.6) | |
| Unidentified | 92724.8 | 0.8 (0.2) | 17.2 (1.4) | 16.4 (3.3) | 46.5 (7.7) | ||
| NH2CHO | 105464.2 | 50,5-40,4 | 2.0 (0.4) | 22.5 (0.8) | 14.4 (2.0) | 127.3 (14.5) | hf |
| CH2NH | 105793.9 | 40,4-31,3 | 1.9 (0.6) | 17.8 (2.6) | 20.5 (5.9) | 90.2 (12.7) | hf, bl |
| H13CCCN | 105799.0 | 12K-11K, K=12-11, 13-12, 11-10 | 1.0 (0.5) | 13.2a(3.3) | 14.4 (6.7) | 66.0a(18.8) | hf, bl |
| Unidentified | 106273.2 | 6.4 (0.6) | 17.4 (0.7) | 24.3 (1.6) | 247.0 (14.2) | ||
| CCS | 106347.7 | 89-78 | 1.9 (0.5) | 20.1 (1.6) | 18.7 (4.1) | 93.5 (12.5) | |
| HOCO+ | 106913.5 | 50,5-40,4 | 4.7 (0.4) | 20.7 (0.4) | 15.3 (1.0) | 290.4 (17.5) | |
| CH3OH | 107013.8 | 31,3-40,4 A+ | -2.7 (…) | 19.4 (2.3) | 33.8 (5.0) | -76.0 (…) | al |
| 13CH3CN | 107196.5 | 6K-5K, K=0, 1 | 0.5 | … | … | 69 | hf, m |
| 13CN | 108636.9 | N=1-0, F1=0, F2=1-0, F=1-1 | 2.6 (0.6) | 21.0a(4.0) | 35.0 (8.0) | 69.0a(5.8) | hf, cd |
| 13CN | 108651.2 | N=1-0, F1=0, F2=1-0, F=2-1 | 1.6 (0.4) | 15.4a(1.7) | 21.0 (4.0) | 73.0 (10.0) | hf |
| HC13CCN | 108710.5 | 12K-11K, K=12-11, 13-12, 11-10 | 1.5 (0.3) | 19.1 (1.5) | 18.2 (3.5) | 77.9 (9.4) | hf |
| HCC13CN | 108721.0 | 12K-11K, K=12-11, 13-12, 11-10 | 1.3 (0.3) | 19.1 (1.2) | 14.0a(2.8) | 86.0a(10.5) | hf |
| 13CN | 108780.2 | N=1-0, F1=1, F2=2-1, F=3-2 | 2.1 (0.4) | 14.7 (1.0) | 20.9 (2.3) | 98.5 (11.7) | hf |
| 13CN | 108786.9 | N=1-0, F1=1, F2=2-1, F=1-0 | 0.7 (0.3) | 22.2a(0.8) | 7.0 (2.0) | 98.0 (20.5) | hfa |
| CH3OH | 108893.9 | 00,0-1-1,1 E | 10.3 (0.3) | 17.5 (0.2) | 20.6 (0.5) | 471.5 (10.0) | |
| HC3N | 109173.6 | 12-11 | 24.3 (0.5) | 17.5 (0.1) | 16.5 (0.3) | 1389.9 (19.0) | |
| SO | 109252.2 | 32-21 | 3.7 (1.2) | 21.2 (2.5) | 17.7 (4.9) | 196.0a(30.9) | |
| Unidentified | 109353.8 | 1.9 (0.3) | 20.4 (0.9) | 20.1 (2.2) | 83.3 (7.2) | ||
| OCS | 109463.0 | 9-8 | 8.9 (0.4) | 20.0 (0.3) | 19.1 (0.7) | 440.5 (12.9) | |
| HNCO | 109496.0 | 51,5-41,4 | 0.8 (0.5) | 14.2a(2.7) | 13.9 (7.4) | 55.0a(13.9) | hf |
| NH2CHO | 109753.5 | 51,4-41,3 | 2.2 (0.6) | 22.0 (1.2) | 13.9 (2.8) | 148.7 (26.1) | hf |
| C18O | 109782.1 | 1-0 | 9.5 (0.8) | 15.1 (0.6) | 21.7 (1.4) | 441.8 (22.7) | bl |
| 2.5 (0.8) | 55.2 (2.1) | 21.7 (5.1) | 108.0 (22.6) | ||||
| HNCO | 109905.7 | 50,5-40,4 | 58.3 (1.1) | 18.2 (0.1) | 18.4 (0.3) | 2980.2 (36.1) | hf |
| 13CO | 110201.3 | 1-0 | 83.6 (3.1) | 16.0 (0.3) | 21.2 (0.6) | 3701.9 (87.0) | |
| 27.2 (3.2) | 50.2a(0.8) | 20.7 (2.0) | 1231.5 (82.9) | ||||
| CHCN | 110328.8 | 6K-5K, K=0, 1 | 0.7 | … | … | 87 | hf, m |
| CH3CN, v8=0,1 | 110349.7 | 64-54 | 1.0 (0.5) | 18.7 (2.5) | 15.6 (5.9) | 57.6 (21.7) | hf |
| CH3CN, v8=0,1 | 110364.4 | 63-53 | 3.8 (0.6) | 19.2 (0.8) | 16.9 (1.9) | 212.7 (20.87) | hf |
| CH3CN, v8=0,1 | 110374.9 | 62-52 | 3.14 (0.6) | 19.2a(0.9) | 13.8 (2.2) | 214.0a(21.3) | hf |
| CH3CN, v8=0,1 | 110383.4 | 6K-5K, K=0, 1 | 13.1 (0.7) | 16.7 (0.4) | 21.3 (1.0) | 576.8 (18.3) | hf, m |
| (CH3)2Ob | 111783.0 | 70,7-61,6 | 3.0 (0.9) | 19.1 (2.8) | 27.2 (6.6) | 103.1 (20.4) | |
| CH3CHO | 112248.7 | 61,6-51,5 A | 1.2 (0.6) | 17.2a(2.4) | 13.6 (4.8) | 84.0a(28.1) | bl |
| CH3CHO | 112254.5 | 6-1,6-5-1,5 E | 2.0 (0.6) | 21.2a(1.6) | 13.6 (3.7) | 139.0a(9.3) | bl |
| C17O | 112359.2 | 1-0 | 3.9 (1.1) | 15.2a(3.7) | 27.1 (6.3) | 134.0a(20.2) | bl |
| 2.9 (0.5) | 42.9 (1.4) | 20.3 (2.7) | 135.8 (11.5) | ||||
| C2H5OH | 112807.1 | 22,1-11,0 | 1.6 (0.4) | 17.5 (1.1) | 13.5 (2.5) | 114.3 (14.6) | |
| C2H3CN | 112840.6 | 120,12-110,11 | 0.7 (0.3) | 19.7 (1.0) | 7.5a(2.4) | 91.0a(25.1) | |
| CN | 113123.3 | N=1-0, J=1/2-1/2, F=1/2-1/2 | 5.5 (0.5) | 13.9 (0.6) | 20.6 (1.4) | 248.8 (15.2) | hfa, ot, cd |
| CN | 113144.1 | N=1-0, J=1/2-1/2, F=1/2-3/2 | 6.2 (0.5) | 15.51 (0.6) | 23.7 (1.5) | 247.7 (14.6) | hfa |
| CN | 113170.5 | N=1-0, J=1/2-1/2, F=3/2-1/2 | 11.4 (0.2) | [-0.2, 32.2] | … | … | hfa |
| Molecule | Frequency | Transition | Area () | VLSR () | () | T () | Notes |
|---|---|---|---|---|---|---|---|
| (MHz) | (K km s-1) | (km s-1) | (km s-1) | (mK) | |||
| CN | 113191.3 | N=1-0, J=1/2-1/2, F=3/2-3/2 | 6.5 (0.2) | [-0.2, 32.2] | … | … | hfa |
| CN | 113490.9 | N=1-0, J=3/2-1/2, F=5/2-3/2 | 22.4 (0.4) | [-0.2, 32.2] | … | … | hf |
| CN | 113508.9 | N=1-0, J=3/2-1/2, F=3/2-3/2 | 7.9 (0.4) | [-0.2, 32.2] | … | … | hfa |
- •
Notes: (bl) blended line; (m) multitransition line (frequency refers to the main component of the group); (hf) hyperfine structure (frequency refers to the main component of the group); (hfa) hyperfine component, it is possible to resolve this hyperfine component since its frequency is sufficiently far from the frequencies of the other hyperfine components; (ot) transition less affected by opacity; (cl) this line is contaminated by the emission from an unknown molecular species; (al) absorption line; (cd) this transition is used to derive the column density (although several transitions of this molecule are detected, there is an insufficient dynamical range in to derive the column density by using a RD).
- •
a Parameter fixed in the Gaussian fit.
- •
b Substates EE, AA, EA, AE blended, we show just the most intense transition.
- •
c Frequency refers to species A.
| Molecule | LOS+0.693 | LOS0.11 | ||||||
| VLSR () | T () | N () | N/N () | VLSR () | T () | N () | N/N () | |
| (km s-1) | (K) | (1013 cm-2) | (10-9) | (km s-1) | (K) | (1013 cm-2) | (10-9) | |
| 13CO | … | … | 28100.0 (644.0)b | 4810.0 (112.0) | … | … | 11500.0 (953.0)b | 4790.0 (566.0) |
| … | … | … | … | … | … | 3010.0 (931.0)b | 1260.0 (404.0) | |
| C18O | 66.8 (0.3) | … | 2344.2 (91.2)c | 400.7 (22.0) | 15.1 (0.6) | … | 955.0 (79.4)c | 400.0 (47.0) |
| … | … | … | … | 55.2 (2.1) | … | 251.2 (77.6)c | 105.2 (33.6) | |
| C17O | 65.7 (0.7) | … | 489.8 (45.7)c | 83.6 (8.5) | 15.2 (3.7) | … | 371.5 (102.3)c | 155.6 (44.7) |
| … | … | … | … | 42.9 (1.4) | … | 281.8 (44.7)c | 118.1 (21.1) | |
| CN | 70.5 (0.5) | … | 169.8 (17.4)d | 29.0 (3.2) | 13.9 (0.6) | … | 173.8 (19.5)d | 72.5 (10.1) |
| 13CN | 71.3 (1.0) | … | 7.4 (1.3)d | 1.1 (0.2) | 21.0 (4.0) | … | 7.9 (2.0)d | 3.3 (0.8) |
| 13C15Ne | 67.9 (1.0) | … | 67.6 (5.6)c | 11.5 (1.1) | … | … | … | … |
| 13CS | [45,80]g | … | 2.3 (0.2)c | 0.4 (0.04) | 18.7 (0.2) | … | 2.8 (0.1)c | 1.2 (0.1) |
| SiO | … | … | 9.0 (1.8)b | 1.4 (0.2) | 18.2 (0.2) | … | 7.2 (0.2)c | 3.0 (0.3) |
| 29SiO | 65.6 (0.6) | … | 0.5 (0.1)c | 0.09 (0.009) | 21.8 (1.0) | … | 0.9 (0.1)c | 0.4 (0.1) |
| 30SiO | 71.8 (0.6) | … | 0.5 (0.1)c | 0.08 (0.009) | 19.7 (0.5) | … | 0.4 (0.03)c | 0.2 (0.02) |
| SiS | 69.5 (3.7) | … | 4.5 (1.2)c | 0.8 (0.2) | 21.2 (1.1) | … | 1.7 (0.4)c | 0.7 (0.2) |
| SO | 68f | 8.1 (2.4) | 61.0 (51.3) | 10.4 (8.8) | 21f | 14.2 (8) | 18.6 (3.7) | 7.8 (2.0) |
| CCH | 65.4 (0.4) | … | 316.2 (18.6)d | 54.1 (3.8) | 19.8 (0.6) | … | 251.2 (24)d | 105.0 (13.3) |
| 13CCH | 67.6 (2.4) | … | 16.6 (3.5)d | 2.8 (0.6) | 27.9 (2.3) | … | 11.1 (3.0)c | 4.8 (1.3) |
| C13CH | 60.6 (1.5) | … | 14.8 (2.6)c | 2.5 (0.5) | … | … | 8.7 | 3.6 |
| CCS | 67f | 7.3 (0.5) | 5.6 (1.1) | 1.0 (0.2) | 21f | 8.6 (2.3) | 3.6 (2.3) | 1.5 (1.0) |
| HCN | … | … | 240b | 36 | … | … | 480b | 180 |
| … | … | 120b | 12 | … | … | … | … | |
| H13CN | … | … | 11b | 2 | … | … | 23b | 9 |
| … | … | 6b | 1 | … | … | … | … | |
| HC15N | [40, 80]g | … | 0.4 (0.04)c | 0.06 (0.01) | [-0.8, 47.2]g | … | 0.8 (0.1)c | 0.3 (0.04) |
| [80, 110]g | … | 0.2 (0.02)c | 0.02 (0.01) | … | … | … | … | |
| HCO | 68.5 (1.3) | … | 6.9 (1.4)d | 1.2 (0.3) | … | … | 3.3 | 1.4 |
| HCS+ | 70.4 (0.7) | … | 2.9 (0.3)c | 0.5 (0.1) | 21.8 (1.7) | … | 1.4 (0.4)c | 0.6 (0.2) |
| HNC | … | … | 240b | 42 | … | … | 180b | 60 |
| HN13C | … | … | 11b | 2 | … | … | 9b | 3 |
| H15NC | [40, 80]g | … | 0.4 (0.05)c | 0.07 (0.01) | 21.5 (1.3) | … | 0.3 (0.1)c | 0.1 (0.01) |
| HNO | 67.5 (0.8) | … | 3.2 (0.4)c | 0.6 (0.08) | 17.2 (1.2) | … | 2.5 (0.5)c | 1.0 (0.2) |
| HOC+ | 68.0 (0.8) | … | 0.1 (0.01)c | 0.02 (0.003) | … | … | 0.03 | 0.01 |
| HCO+, v=0,1,2 | … | … | 57.0 (1.3)b | 9.6 (2.2) | … | … | 36.0 (0.8)b | 15.5 (3.0) |
| H13CO+ | … | … | 2.7 (0.1)b | 0.5 (0.1) | … | … | 1.7 (0.04)b | 0.7 (0.1) |
| HC18O+ | 74.5 (2.8) | … | 0.2 (0.1)c | 0.04 (0.01) | 23.4 (1.2) | … | 0.2 (0.03)c | 0.06 (0.01) |
| OCS | 65f | 17.6 (1.1) | 186.2 (4.6) | 31.8 (1.5) | 19f | 15.3 (1.4) | 87.1 (14.1) | 36.4 (6.5) |
| OC34S | 66f | 12.1 (2.9) | 21.4 (3.1) | 3.7 (0.6) | … | … | 4.0 | 1.7 |
| O13CS | 66f | 11.3 (4.7) | 7.8 (1.2) | 1.3 (0.2) | … | … | 3.5 | 1.5 |
| O13C34S | … | … | 3.0 | 0.5 | … | … | … | … |
| SO2 | 65.0 (0.4) | … | 83.2 (3.4)c | 14.2 (1.0) | 18.6 (1.0) | … | 20.4 (3.7)c | 8.6 (1.7) |
| HNCO | 66f | 11.2 (0.2) | 144.5 (5.6) | 24.7 (1.4) | 18f | 11.5 (0.5) | 67.6 (4.5) | 28.3 (3.0) |
| H15NCO | … | … | 0.4 | 0.1 | … | … | 0.3 | 0.1 |
| HNC18O | … | … | 1.1 | 0.2 | … | … | 0.9 | 0.4 |
| HNCS, a-type | 66f | 15.2 (5.6) | 3.1 (2.2) | 0.5 (0.4) | 21.2 (2.0) | … | 2.0 (0.6)c | 0.8 (0.3) |
| HOCO+ | 66f | 7.5 (0.4) | 12.0 (1.4) | 2.1 (0.3) | 20f | 6.5 (0.8) | 4.8 (1.2) | 2.0 (0.6) |
| CH2CO | 66f | 29.2 (6.8) | 22.9 (6.8) | 3.9 (1.2) | 19f | 30.6 (14.8) | 14.8 (12.3) | 6.2 (5.2) |
| CH2NH | 71.5 (1.0) | … | 29.5 (4.8)c | 5.0 (0.8) | 17.8 (2.6) | … | 24.0 (7.8)c | 10.1 (3.4) |
| HC3N | 70f | 15.4 (0.6) | 54.9 (3.3)b | 9.4 (1.0) | 18f | 11.2 (0.2) | 26.8 (0.6) | 11.2 (1.0) |
| H13CCCN | 70f | 14.4 (1.6) | 2.6 (0.2) | 0.5 (0.03) | 18f | 9.0 (3.0) | 1.9 (0.3) | 0.8 (0.2) |
| HC13CCN | 66f | 12.0 (1.9) | 2.0 (0.2) | 0.4 (0.04) | 20f | 19.5 (6.1) | 1.3 (0.4) | 0.5 (0.2) |
| HCC13CN | 68f | 9.4 (1.2) | 2.7 (0.5) | 0.5 (0.10) | 19f | 11.5 (2.2) | 1.4 (0.3) | 0.6 (0.1) |
| HCCNC | 70.1 (3.1) | … | 0.7 (0.3)c | 0.1 (0.05) | … | … | 0.9 | 0.4 |
| HCOOH | 67f | 18.9 (4.8) | 14.4 (6.2) | 2.5 (1.1) | 18.6 (0.9) | … | 15.9 (4.2)d | 6.6 (1.8) |
| H2C2N | 70.4 (0.7) | … | 11.0 (1.4)d | 1.9 (0.3) | 17.6 (1.2) | … | 4.8 (1.2)d | 2.0 (0.5) |
| NH2CN | 67f | 47.6 (3.1) | 11.9 (1.5) | 2.0 (0.3) | 20f | 53.6 (10.3) | 8.3 (3.0) | 3.5 (1.3) |
| c-C3H2 | 69f | 13.1 (1.9) | 9.4 (2.5) | 1.6 (0.4) | 20f | 6.6 (0.4) | 6.0 (0.7) | 2.5 (0.4) |
| CH3CN, v8=0,1 | 69.7 (0.8) | 65.2 (6.5) | 28.0 (3.0)b | 4.8 (0.6) | 20f | 63.5 (8.7) | 7.4 (1.6) | 3.1 (0.7) |
| 13CH3CN | 74f | 73.3 (32.2) | 1.1 (0.7) | 0.2 (0.1) | … | 63.5 | 1.5 | 0.6 |
| CHCN | 69.7 (0.8) | 73.3 | 1.4 (0.2)d | 0.2 (0.03) | … | 63.5 | 1.9 | 0.8 |
| CH3OH | … | … | 12700.0 (1420.0)b | 2160.0 (257.0) | … | 13.0 | 3981.0 | 1670.0 |
| 13CH3OH | 70.4 (1.9) | 14.0 | 602.6 (67.6)c | 103.0 (12.2) | … | 13.0 | 758.6 | 317.7 |
| NH2CHO | 68f | 12.3 (0.6) | 5.9 (0.6) | 1.0 (0.1) | 19f | 8.7 (0.8) | 2.5 (0.5) | 1.0 (0.2) |
| C2H3CN | 70f | 9.1 (0.9) | 5.1 (1.6) | 0.9 (0.3) | 20f | 11.5 (3.2) | 2.0 (1.3) | 0.8 (0.5) |
| CH3CCH | 68f | 61.1 (10.9) | 262.4 (16.9) | 44.9 (3.4) | 21f | 54.8 (5.5) | 74.1 (12.3) | 31.0 (5.8) |
| CHCCH | 80.9 (2.2) | 61.1 | 12.6 (3.9)d | 2.2 (0.7) | … | 54.8 | 12.8 | 5.4 |
| CH3CHO-A | 69f | 5.4 (0.4) | 49.0 (10.2) | 8.4 (1.8) | 17f | 4.5 (1.0) | 12.0 (9.1) | 5.0 (3.8) |
| CH3CHO-E | 72f | 6.5 (0.6) | 15.9 (5.0) | 2.7 (0.9) | 21f | 6.2 (1.0) | 20.9 (8.5) | 8.8 (3.6) |
| HC5N | 66f | 32.1 (4.7) | 3.5 (1.2) | 0.6 (0.2) | 20f | 44.5 (19.1) | 2.2 (1.8) | 0.9 (0.8) |
| CH3COOH-E | … | … | 4.0 | 0.7 | … | … | 4.3 | 1.8 |
| CH3OCHO-A | 69f | 11.5 (1.0) | 34.7 (7.4) | 5.9 (1.3) | … | … | 19.8 | 8.3 |
| CH3OCHO-E | 70f | 11.9 (1.1) | 36.3 (7.4) | 6.2 (1.3) | 17.7 (2.1) | … | 23.4 (10)c | 9.8 (4.2) |
| Molecule | LOS+0.693 | LOS0.11 | ||||||
| VLSR () | T () | N () | N/N () | VLSR () | T () | N () | N/N () | |
| (km s-1) | (K) | (1013 cm-2) | (10-9) | (km s-1) | (K) | (1013 cm-2) | (10-9) | |
| HCOCH2OH | 73.8 (0.9) | … | 6.5 (5.6)c | 1.1 (1.0) | … | … | 4.8 | 2.0 |
| C2H5CN | 67f | 13.0 (1.0) | 8.1 (1.6) | 1.4 (0.3) | 18f | 8.7 (3.6) | 4.8 (3.2) | 2.0 (1.4) |
| (CH3)2O | 72f | 20.3 (1.2) | 91.2 (10.0) | 15.5 (1.6) | 19f | 15.8 (7.6) | 63.1 (50.1) | 26.4 (21.1) |
| C2H5OH | 68f | 5.3 (0.4) | 44.7 (8.7) | 7.6 (1.5) | 18.6 (0.5) | … | 25.1 (2.5)d | 10.5 (1.4) |
- •
a Trot derived from RDs or assumed for deriving molecular column densities. The assumed Trot for the 13C isotopologues of CH3CCH and CH3CN are taken from their other isotopologues. The assumed Trot for the CH3OH and its 13C isotopologue are taken from Requena-Torres et al. (2008). The Trot quoted with uncertainties are determined from RDs. When the Trot is not listed means that a Trot of 10 K is assumed, which corresponds to an average value of the low Trot component derived from other molecules by using RDs.
- •
b We have inferred from the 12C/13C15, 14N/15N280 and 16O/18O186 isotopic ratios given in Table 8 that the column density of the most abundant isotopologues of this molecule are biased by opacity/self-absorption. Thus here we have derived the column density by using either its 18O, 15N or 13C isotopologue for its respective velocity component and assuming the 16O/18O=250 or 14N/15N600 ratios (W&R94) and if necessary our 12C/13C=21 ratio. For LOS+0.693 the SiO column density is derived from the 28SiO isotopologue assuming a 28Si/30Si ratio of 18 derived in LOS0.11.
- •
c Only one line of this molecule is detected.
- •
- •
e The observed transition is contaminated by the emission from an unknown molecular species.
- •
f This velocity is an average of different detected transitions.
- •
g These velocity ranges are chosen for deriving velocity-integrated intensities used in the molecular column density estimate. For LOS+0.693 we have used a velocity range for the 13CS(2-1) line as it is affected by opacity/self-absorption. For the 15N isotopologues of HNC and HCN the velocity ranges are suitable for deriving 14N/15N ratios (see text).
| Isotope | molecular | MC+0.693 | MC-0.11 | Bibliographic | |
| column density ratio | VLSR(km s-1) | VLSR(km s-1) | Dataa | ||
| 68 | 85 | 20 | |||
| Ratios/limits unbiased by opacity/self-absorption in both GC sources | |||||
| 12C/13C | CN:13CN | 22.9 (4.7) | … | 21.2 (5.7) | 20 |
| CCH:13CCH | 19.1 (4.1) | … | 22.6 (6.5) | ||
| CCH:C13CH | 21.4 (3.9) | … | 29 | ||
| OCS:O13CS | 22.8 (3.8) | … | 25 | ||
| CH3CCH:CHCCH | 20.8 (6.6) | … | 6 | ||
| 14N/15N | HNCO:H15NCO | 380 | … | 214 | 600 |
| 18O/17O | C18O:C17O | 4.8 (0.5) | … | 2.6 (0.9) | 3.2 (0.2) |
| 16O/18O | HNCO:HNC18O | 129 | … | 78 | 250 |
| 29Si/30Si | 29SiO:30SiO | 1.1 (0.2) | … | 2.2 (0.4) | 1.5 |
| Ratios/limits biased by opacity/self-absorption/ripples in one/both GC sources | |||||
| 12C/13C | HCN:H13CN | 4.5 (0.7)b | 5.1 (0.7) | 4.4 (0.1)c | 20 |
| HNC:HN13C | 3.0 (0.4)b | … | 5.1 (0.3) | ||
| HCO+:H13CO+ | 5.0 (0.7)b | 6.8 (1.0) | 7.1 (0.2)c | ||
| HC3N:H13CCCN | 11.6 (0.8) | … | 13.9 (2.4) | ||
| HC3N:HC13CCN | 14.8 (1.5) | … | 21.1 (6.1) | ||
| HC3N:HCC13CN | 11.0 (2.1) | … | 20.0 (4.7) | ||
| CH3OH:13CH3OH | 15.1 (3.8) | … | … | ||
| CH3CN:13CH3CN | 13.6 (9.1) | … | 5 | ||
| CH3CN:CHCN | 10.9 (1.6) | … | 4 | ||
| 14N/15N | 12C:13CHN13C:H15NC | 148.7 (23.4)d,e | … | 280.8 (25.2)e | 600 |
| 12C:13CH13CN:HC15N | 100.5 (14.7)d,e | 163.0 (23.1)d | 141.8 (17.3)e | ||
| 16O/18O | 12C:13CCO:C18O | 136.3 (7.2)e | … | 185.5 (17.0)e | 250 |
| 32S/34S | OCS:OC34S | 8.7 (1.3)f | … | 22 | 22 |
| 12C:13CO13CS:OC34S | 7.7 (1.6)e,f | … | … | ||
| O13CS:O13C34S | 3 | … | … | ||
- •
a Isotopic ratios from W&R94.
- •
b The 12C and 13C isotopologues are affected by opacity/self-absorption.
- •
c The 12C isotopologue is affected by opacity/self-absorption.
- •
d The 13C isotopologue is affected by opacity/self-absorption.
- •
e We have averaged the 12C/13C isotopic ratios unbiased by opacity/self-absorption, then we have obtained the average 12C/13C21 ratio over both GC sources. In these ratios we have used the 12C/13C=21 ratio.
- •
f The OC34S lines are affected by ripples.
3.4 Isotopic ratios
We have used the large number of detected isotopologues to derive from their column densities the isotopic ratios of 12C/13C, 14N/15N, 16O/18O, 18O/17O, 29Si/30Si and 32S/34S for both GC sources. Table 8 summarizes all the derived isotopic ratios based on optically thin (unbiased group) and optically thick (biased group) emission. When possible, we have also used column densities of isotopologues with double isotopic substitution to guarantee optically thin emission. The canonical isotopic ratios derived for the GC by W&R94 are also shown in Table 8. As expected, the isotopic ratios of 3-15 derived from the biased group are always smaller than the canonical isotopic ratios due to the opacity effects on the most abundant isotopic substitution. The unbiased 12C/13C isotopic ratios derived for both GC sources are similar, within uncertainties, and its average, 12C/13C=21.3 (1.7), is similar to the canonical value.
We also found a 18O/17O ratio of 3.7 (0.5) and a 29Si/30Si ratio of 1.7 (0.2) averaged over both GC sources, which are also within the uncertainties similar to the canonical values. Our lower limits to the 16O/18O and 14N/15N ratios are also consistent with the canonical values. The 32S/34S isotopic ratios derived in LOS+0.693 are lower than that found in W&R94, because the OC34S lines are affected by ripples (see Fig. 2) and likely the OC34S column density is overestimated. However, in LOS0.11 the lower limit of 22 to the OCS/OC34S ratio is close to the canonical value. Our averaged 12C/13C, 18O/17O, 29Si/30Si isotopic ratios are similar to the canonical values (W&R94) within 1, which represents 10% in the derived isotopic ratios. This indicates that chemical isotopic fractionation and selective photodissociation are negligible, less than 10%, for most of the molecules and the physical conditions in the GC, consistent with the results obtained by Riquelme et al. (2010).
The 12C isotope is a primary product of nucleosynthesis in stellar cores, while the 13C isotope is thought to be formed from 12C present in stars of later generations (Wilson & Matteucci, 1992). Thus, the 12C/13C ratio can be considered a measure of the degree of gas processing in the ISM. Using CCH and their 13C isotopologues, Martín et al. (2010) derived very large 12C/13C ratios of 138 and 81 toward the starburst galaxies M 82 and NGC 253, respectively. Based on the hyperfine fits to the CCH line profiles, they ruled out opacity effects in the CCH lines. The 12C/13C ratio in the GC is at least a factor of 4 lower than in both starburst galaxies, suggesting that the degree of gas processing is quite different between them.
4 Discussion
4.1 Uniform molecular abundances and excitation conditions in the nuclei of galaxies
4.1.1 Galactic center
Early studies of the distribution of the kinetic temperature in the molecular material in the GC using both ammonia and H2 have shown that molecular clouds are warm with a mean Tkin of 100 K (Hüttemeister et al., 1993; Rodríguez-Fernández et al., 2001). More recently, Requena-Torres et al. (2006) have found that the abundance of complex organic molecules is also relatively uniform in the molecular clouds in the GC. In agreement with the findings of Requena-Torres et al. (2006), we also found that the molecular clouds toward two lines of sight, LOS+0.693 and LOS0.11, separated by more than 120 pc within the Galactic Center, show a rather uniform chemistry. 80% of molecular species detected in both lines of sight show similar abundances within a factor of 2, even for the most complex organic molecules like C2H5OH, C2H5CN and (CH3)2O.
Our (CH3)2O, CH3OH, HCOOH, HNCO, 13CS and C18O abundances are also consistent with those derived in previous studies toward both GC sources from 2 and 3 mm line data (Requena-Torres et al., 2006; Martín et al., 2008). The “uniform” chemistry in the GC was explained for complex molecules as due to grain surface chemistry followed by the sputtering of the icy mantles by shocks. Our database allows now a detailed comparison of the excitation conditions found along the two LOSs. Fig. 11 represents the Trot derived for LOS+0.693 versus the Trot derived for LOS0.11. It is remarkable that the excitation of the molecular gas is very similar for both GC sources. In fact, 86% of the molecules show the same Trot within 1. Another two molecules (c-C3H2 and NH2CHO) show Trot which are consistent within 3. HC3N is the only molecule that shows a significant difference in its excitation between both GC sources above a 3 level. However, the difference in the Trot by a factor of 1.4 corresponds to a change of only a factor of 1.8 in the derived H2 densities of the molecular gas (see section 3.3.4). The similar excitation conditions and molecular complexity found in the molecular gas in the two LOSs indicate that physical processes operating in the GC are widespread, driving the chemistry and affecting the physical conditions over large scales.
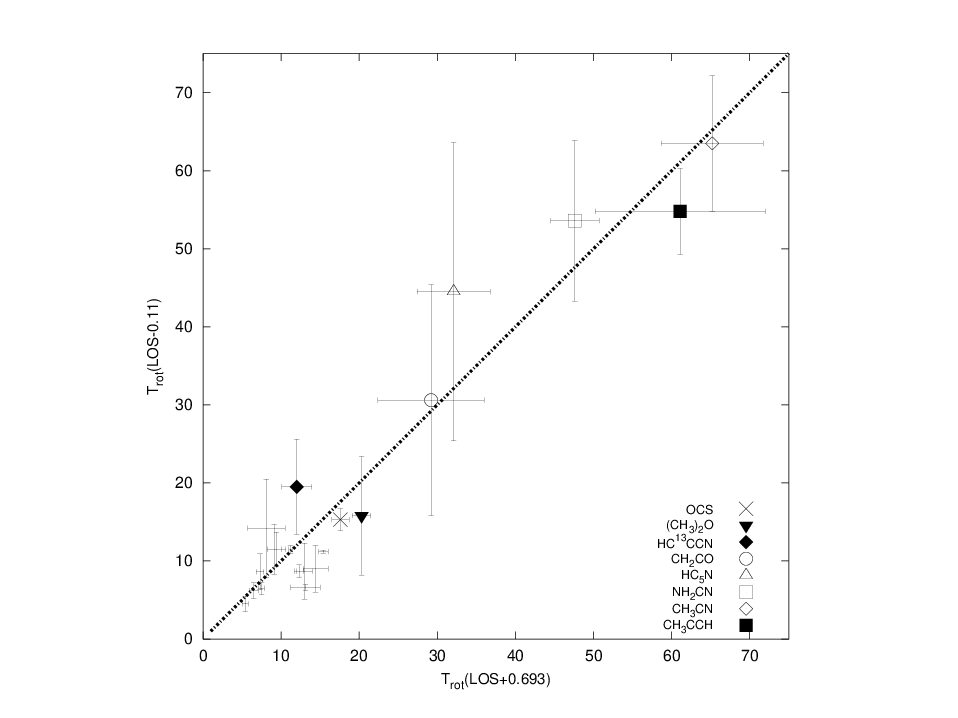
It is remarkable that the complex organic molecules like CH2CO, HC5N, NH2CN, CH3CCH and CH3CN show the largest Trot in our survey. We do not believe the high temperatures derived from CH2CO and NH2CN are biased by the range of the energy levels of the observed transitions. Although the HNCO RDs (see Fig. 8) cover the same range of energies than that of the NH2CN, the derived Trot for both molecules are very different. The wide range of derived Trot for the different molecules does not seem to be due to difference in collisional cross sections, level structure and/or dipole moments. For NH2CN and CH2CO, which have virtually identical geometrical cross sections and level structure, but very different dipole moments (=4.32D for NH2CN and =1.414 D for CH2CO) one would expect to observe a larger Trot for CH2CO. In contrast, NH2CN shows a higher Trot than CH2CO.
Fig. 12 shows the molecular excitation (Trot) derived for LOS+0.693 as a function of the dipole moment of the molecule. We found that there is not any clear dependence of Trot with the dipole moment as expected if the emission from all molecules were arising from the same region. Although the origin of the difference in Trot is uncertain, we postulate that it may be related to the formation of the molecular species. In the shock scenario proposed by Requena-Torres et al. (2006) and Martín et al. (2008), the molecular species showing higher Trot will be those produced at early times or just ejected from grain and those with lower Trot should be located in the post shocked regions.

4.1.2 Starburst galaxies
The bulk of the quiescent molecular clouds in the GC seem to show rather uniform physical conditions and chemical composition. In this section we compare our results obtained for the GC clouds with those derived for nearby extragalactic nuclei with different type of activity. Table 9 summarizes the Trot and molecular abundances of selected species derived for both GC sources and four extragalactic nuclei, NGC 253, M 82, IC 342 and Maffei 2. The molecular species selected in Table 9 and their corresponding Trot has been successfully used by Martín et al. (2009a) and Aladro et al. (2011a) to study the evolution of the nuclei of starburst galaxies. Based on the excitation and the molecular abundances, Martín et al. (2009a) and Aladro et al. (2011a) have classified Maffei 2 as a young starburst galaxy, IC 342 and NGC 253 as intermediate-age starburst galaxies and M 82 as an evolved starburst galaxy (Aladro et al., 2011a).
In column 8 of Table 9, we show the ratio between the molecular abundance of LOS0.11 and those of LOS0.63 and the nuclei of nearby galaxies. While the molecular abundances in the two GC LOSs clouds are within a factor of 3, those in galactic nuclei are, for most molecules, at least one order of magnitude smaller than those measured in the GC. This is expected since the volume sampled in external galaxies is, at least, four orders of magnitude larger than in the GC. Then the ratio between diffuse molecular gas measured by the H2 column densities to dense gas traced by other species is smaller in the GC than in external galaxies. However, some molecular species show changes in their abundances by more than one order of magnitude relative to high density tracers like CS. In particular, CH3OH shows the lowest abundances in galaxies like M 82, IC 342 and Maffei 2 by factors of (1-6)102 relative to LOS0.11. NGC 253 is the galaxy that shows the highest methanol abundance between the starburst galaxies in our sample. The radiation field in NGC 253 seems to be higher than in M 82, IC 342 and Maffei 2 (Carral et at., 1994; Israel & Baas, 2003). However, differences in the evolutionary stage of the starbursts and molecular clouds (Aladro et al., 2011a), the distribution of star forming regions and/or the strength of large-scale shocks could be responsible for the high methanol abundance in NGC 253 as compared to those of the other galaxies in our sample. Similar lower methanol abundances, by nearly two orders of magnitude, are also observed toward a sample of molecular clouds in the GC (Requena-Torres et al., 2006) that are affected by the UV photodissociation from HII regions. This suggests that this molecule is likely photodissociated by the strong UV radiation field of G0102.5-4.0 (Carral et at., 1994; Israel & Baas, 2003) present in these nearby galaxies considered in this comparison.
Another molecule which also shows large abundance differences between our sample of galaxies and LOS0.11 is HNCO. It is expected that gas-phase HNCO survives in well-shielded dense molecular clouds, while it is photodissociated in unshielded regions affected by UV radiation (Martín et al., 2008). The high HNCO abundances derived in both GC sources compared to those found in the starburst galaxies NGC 253 and M 82 support the idea that HNCO is a suitable tracer of dense molecular gas (106 cm-3) in clouds unaffected by strong UV radiation (Martín et al., 2008). This agrees with the finding of Amo-Baladrón et al. (2011), who found that the HNCO abundance in the 20 km s-1 cloud dominated by shocks is a factor of 20 higher than in the CND surrounding Sgr A∗ which is affected by both shocks and photodissociation.
The photodissociation rate of HNCO is a factor of 1.5 larger than that of CH3OH. Both molecules have photodissociation rates higher (a factor 3) and lower (a factor 4) than those of CCH and HC3N, respectively. The smaller differences found in the CCH abundances compared to those of CH3OH and HNCO between LOS0.11 and the starburst galaxies M 82 and NGC 253 is likely due to the differences in the photodissociation rates of these molecules. Additionally, CCH could increase its abundance efficiently in PDRs (Mul & McGowan, 1980). One expects that HC3N would show larger abundance variations than CH3OH and HNCO between LOS0.11 and both starburst galaxies due to their differences in the photodissociation rates. However, this is not observed in Table 9. Efficient formation of HC3N through ion-molecule chemistry (Knight et al., 1986) could be responsible for the high HC3N abundance found in both starburst galaxies. The largest differences shown by CH3OH and HNCO in our comparison is likely due to their photodissociation and that both molecules are not expected to form efficiently in gas phase. CH3OH shows higher differences in its abundance than HNCO between LOS0.11 and the starburst galaxies in our sample. This is probably due to the higher extinction of the dense clouds, cores where HNCO arises (106 cm-3, Martín et al. (2008)) as compared with the more diffuse conditions where CH3OH is found (5104 cm-3, Martín et al. (2006a)).
Overall, complex molecules in the molecular clouds of this sample of starburst galaxies reveal smaller abundances than those measured in the GC sources by nearly 2 orders of magnitude, suggesting that a substantial fraction of the molecular gas in the nearby galaxies in our sample is affected by photodissociation by the UV radiation from the starburst.
| Source name and | Type | Molecule | Trot () | N () | N () | X=N/N | (X1/X)A | |
|---|---|---|---|---|---|---|---|---|
| Nominal positions | (K) | (cm-2) | (1013 cm-2) | 10-9 | ||||
| J2000 () | ||||||||
| LOS+0.693 | Molecular cloud | CS | 10.0 | 5.9 (0.2)1022 | 48.3 (4.2)B | 8.2 (1.0) | 3.0 (0.4) | |
| , | SO | 8.1 (2.4) | 61.0 (51.3) | 10.3 (8.7) | 0.8 (0.6) | |||
| SiO | 10.0 | 9.0 (1.8) | 1.4 (0.2) | 2.1 (0.3) | ||||
| OCS | 17.6 (1.1) | 186.2 (4.6) | 31.6 (1.5) | 1.2 (0.2) | ||||
| CCH | 10.0 | 316.2 (18.6) | 53.6 (3.8) | 2.0 (0.3) | ||||
| HCO+ | 10.0 | 57.0 (1.3) | 9.6 (2.2) | 1.6 (0.5) | ||||
| HNCO | 11.2 (0.2) | 144.5 (5.6) | 24.5 (1.3) | 1.2 (0.1) | ||||
| HC3N | 15.4 (0.6) | 54.9 (3.3) | 9.4 (1.0) | 1.2 (0.1) | ||||
| CH3OH | 14.0 (1.3)a | 12700.0 (1420.3) | 2160.0 (255.0) | 0.5 (0.1) | ||||
| CH3CCH | 61.1 (10.9) | 262.4 (16.9) | 44.5 (3.3) | 0.7 (0.1) | ||||
| LOS0.11 | Molecular cloud | CS | 10.0 | 2.4 (0.2)1022 | 58.8 (2.1)B | 24.5 (2.2) | 1 | |
| , | SO | 14.2 | 18.6 (3.7) | 7.8 (2.0) | 1 | |||
| SiO | 10.0 | 7.2 (0.2) | 3.0 (0.3) | 1 | ||||
| OCS | 15.3 (1.4) | 87.1 (14.1) | 36.3 (6.6) | 1 | ||||
| CCH | 10.0 | 251.2 (24.0) | 104.7 (13.2) | 1 | ||||
| HCO+ | 10.0 | 36.0 (0.8) | 15.5 (3.0) | 1 | ||||
| HNCO | 11.5 (0.5) | 67.6 (4.5) | 28.2 (3.0) | 1 | ||||
| HC3N | 11.2 (0.2) | 26.8 (0.6) | 11.2 (1.0) | 1 | ||||
| CH3OH | 13.0 (1.0)a | … | 1100.0 (220)a,C | 1 | ||||
| CH3CCH | 54.8 (5.5) | 74.1 (12.3) | 30.9 (5.7) | 1 | ||||
| NGC 253 | Intermediate-age | CS | 12.0 (3)b | 6.2 (0.5)1022b | 15.0 (6.0)b | 2.4 (1.0) | 10.2 (4.2) | |
| , | starburst | SO | 40 (24)c | 4.5 (3.3)c | 0.73 (0.5) | 10.7 (7.9) | ||
| SiO | 7.4 (0.7)c | 0.5 (0.1)c | 0.081 (0.02) | 37.0 (8.7) | ||||
| OCS | 17 (2)c | 25.0 (3.0)c | 4.0 (0.6) | 9.1 (2.0) | ||||
| CCH | 10.0d | 73.0 (1.0)d | 11.8 (1.0) | 8.9 (1.3) | ||||
| HNCO | 23.0 (6.0)c | 5.7 (2.7)c | 0.9 (0.4) | 31.3 (15.0) | ||||
| HC3N | 11.6 (1.8)b | 8.1 (2.9)b | 1.3 (0.5) | 8.6 (3.2) | ||||
| CH3OH | 11.6 (0.2)c | 83 (3)c | 13.4 (1.2) | 82.1 (18.0) | ||||
| CH3CCH | 44.4 (7.7)b | 32.0 (10.0)b | 5.2 (1.7) | 5.9 (2.2) | ||||
| M 82 | Evolved starburst | CS | 15.1 (0.9)b | 7.9 (0.4)1022b | 3.6 (0.5)b | 0.5 (0.1) | 49.0 (9.3) | |
| , | CCH | 10.0e,D | 55.0 (1.0)e,D | 6.5 (0.4)D | 16.1 (2.2) | |||
| HNCO | 10.0f,D | 0.7f,D | 0.1D | 282 | ||||
| HC3N | 24.7 (3.9)b | 2.5 (1.1)b | 0.3 (0.1) | 37.3 (16.0) | ||||
| CH3OH | 4.5f | 15.0f | 1.9 | 579.0 | ||||
| CH3CCH | 28.1 (1.2)b | 85.0 (9.0)b | 10.8 (1.3) | 2.9 (0.6) | ||||
| IC 342 | Intermediate-age | CS | 10.6 (0.2)b | 5.8 (0.4)1022b | 6.0 (0.1)b | 1.0 (0.1) | 24.5 (2.6) | |
| , | starburst | SO | … | … | 0.08g,E | 1.1 | ||
| CCH | … | … | 0.3g,E | 3.5 | ||||
| HNCO | 10.2 (0.4)e | 12.0 (1.0)e | 2.1 (0.2) | 13.4 (2.0) | ||||
| HC3N | 13.1 (2.3)b | 2.7 (1.1)b | 0.5 (0.2) | 22.4 (10.0) | ||||
| CH3OH | … | … | 5g,E | 220 | ||||
| CH3CCH | 70.0b | 45.0b | 7.8 | 4.0 | ||||
| Maffei 2 | Young starburst | CS | 9.7 (8.1)b | 4.4 (0.8)1022b | 6.9 (5.7)b | 1.6 (1.3) | 15.3 (13.3) | |
| , | SiO | … | … | 0.08h,E | 36.2 | |||
| CCH | … | … | 9.6h,E | 10.9 | ||||
| HCO+ | … | … | 3.5h,E | 4.4 | ||||
| HNCO | 11.5 (0.6)e | 10 (2)e | 2.3 (0.6) | 12.3 (3.6) | ||||
| HC3N | 11.6 (0.8)b | 4.3 (0.6)b | 1.0 (0.2) | 11.2 (2.8) | ||||
| CH3OH | 10.0f | 33.0f | 7.5 | 147.0 | ||||
| CH3CCH | 46.9b | 11b | 2.5 | 12.4 |
- •
A-Ratio between the molecular abundances for LOS0.11 and those for the other sources in this table; B-The CS abundances for both GC sources are derived from the 13CS abundances by using our 12C/13C=21 ratio; C-An uncertainty of 20% in the methanol abundance is assumed; D-Offset position of , relative to , (J2000) with N=8.51022 cm-2 (Martín et al., 2006a). E-This abundance corresponds to the cloud A in IC 342 or cloud F in Maffei 2, both clouds are located in projection close to the nuclear star clusters. Uncertainties in the abundances are at least a factor of 3.
- •
- •
- •
- •
- •
- •
- •
- •
Fig. 13 shows the Trot of selected molecules derived in NGC 253 (Martín et al., 2006b; Aladro et al., 2011a) and M 82 (Aladro et al., 2011b) versus the Trot derived for LOS0.11. In contrast to the large abundance difference found between the GC clouds and starburst galaxies, the excitation of complex molecules like c-C3H2, HC3N and CH3OH derived for both starburst galaxies, NGC 253 and M 82, is similar within 3 to the excitation of the molecular cloud found for LOS0.11. Like in the two LOSs in the GC, NH2CN and CH3CCH in NGC 253 also show high Trot of 67 K and 44 K, respectively. Interestingly these Trot are within a factor of 1.2 of those of NGC 253. In M 82, the Trot derived from CH3CCH and CH3CN show the same trend than in NGC 253 but in this case they are a factor of 2 lower than those observed in LOS0.11. It is remarkable that the excitation of molecular clouds in the nuclei of galaxies with different activity and evolutionary stage appears relatively uniform, suggesting that the physical conditions, H2 densities and kinetic temperatures, must be very similar. If, as suggested in the previous section, the excitation of the molecules is related to the formation mechanism, there must be a common processes driving the chemistry in the nuclei of galaxies. However, to explain the underabundance of CS, HC3N, CH3OH, HNCO and other molecules (see Table 9) found in our sample of galactic nuclei with respect to the GC, the shock scenario proposed by Requena-Torres et al. (2006) and Martín et al. (2008) for the GC must be combined with the effects of the photodissociation as proposed by Aladro et al. (2011b).


4.2 Tracing the UV and X-ray induced chemistry in galactic nuclei
The scenario proposed in the previous section to explain the difference in abundance ratios between these quiescent Galactic center LOSs and our sample of galactic nuclei would indicate that the clouds in the two LOSs are only marginally affected by the UV radiation. However, in our survey we have detected, for the first time, HCO and HOC+ emission toward LOS+0.693 in the GC. Emission from these molecules are considered to be tracers of UV and X-ray induced chemistry in the associated PDRs (Apponi et al., 1999; Goicoechea et al., 2009; Martín et al., 2009b) and XDRs (Usero et al., 2004; Spaans & Meijerink, 2007). It has been proposed that abundance and abundance ratios between key molecules like HCO, HOC+ and HCO+ can be used to trace the XDR and PDR chemistries and even to differentiate between them (Meijerink et al., 2007; Spaans & Meijerink, 2007). The high spatial resolution of our data offers an unique opportunity to study the PDR/XDR component in nuclei of galaxies using molecular tracers.
4.2.1 Constrains on the X-ray radiation in the molecular clouds along the GC LOS
Fig. 14 illustrates the key difference in the X-ray emission observed toward the two LOSs (shown as open circles) in the GC. While LOS0.11 only shows continuum emission in the 0.1-10 keV band, LOS+0.693 shows, in addition to the continuum emission, one of the strongest Fe K (6.4 keV) lines observed in our Galaxy (Koyama et al., 1996). The presence of the strong Fe K line emission is considered as an excellent tracer of XDRs (Martín-Pintado et al., 2000), showing that X-rays are directly interacting with large column densities of matter. As a consequence of this interaction one would expect a chemistry driven by X-rays. In contrast, LOS0.11 does not show any emission of the Fe K line (Ponti et al., 2010), indicating the lack of any relevant XDR.
4.2.2 Constrains on the UV radiation in the molecular clouds along the GC LOS
As shown in Fig. 1, the two LOSs do not show any prominent HII region which would produce associated PDRs. However, LOS+0.693 is relatively close to the HII regions of Sgr B2N and L, whereas LOS0.11 is located near the non-thermal sources Sgr A-E and Sgr-F (Lu et al., 2003; Yusef-Zadeh et al., 2005). We can use the upper limit to the H recombination line emission in our survey to constrain the Lyman photons in the beam. None of the four H, H39 to H43, recombination lines that fall in the frequency range of our spectral line survey are detected toward both LOSs. From the 3 upper limit to their intensities and assuming a linewidth of 35 km s-1, we have set the upper limits to the thermal continuum fluxes given in Table 10. For optically thin emission and the average LTE electron temperature of 6500 K estimated toward the GC (Goss et al., 1985), we have derived the upper limits to the Lyman continuum photons (Mezger & Henderson, 1967) given in Table 10. These upper limits of 1048.4 and 1048.7 s-1 for LOS+0.693 and LOS0.11, respectively, would constrain the spectral type of any ionizing star to be later than O8-O9.
Low angular resolution observations of fine structure lines of CII and OI toward Sgr B2 have shown the presence of an extended FUV radiation field of G0103-104, which should produce important PDRs. However, this FUV radiation field would be characterized by a Lyman continuum photon flux of 1050.4 s-1 (Goicoechea et al., 2004). This flux is 50 times larger than that derived from the recombination lines in LOS+0.693. Given the large difference in beam size between our observations and those of the fine structure lines, it is possible that inhomogeneities in the FUV radiation field could partially explain this discrepancy. In any case, the UV radiation field strength of the PDR component in LOS+0.693 is rather uncertain. The situation for LOS0.11 seems to be simpler since there is not nearby massive star formation, like Sgr B2N, which could provide a large FUV radiation field. In this LOS one expects a negligible PDR component.
| Recombination | LOS+0.693 | LOS0.11 | |||||
|---|---|---|---|---|---|---|---|
| line | Continuum Flux | Electron | Flux of Lyman | Continuum Flux | Electron | Flux of Lyman | |
| Density | Continuum Photons (NLyc) | Density | Continuum Photons (NLyc) | ||||
| (GHz) | (Jy) | (cm-3) | Log(NLyc) (s-1) | (Jy) | (cm-3) | Log(NLyc) (s-1) | |
| H43 | 79.912 | … | … | … | 1.2 | 473.2 | 48.6 |
| H42 | 85.688 | 1.4 | 513.0 | 48.7 | 2.6 | 715.9 | 49.0 |
| H41 | 92.034 | 1.5 | 531.2 | 48.7 | 1.2 | 480.5 | 48.6 |
| H39 | 106.737 | 0.8 | 391.2 | 48.4 | 1.3 | 501.5 | 48.7 |
4.2.3 The HCO, HOC+, HCO+ and CS abundance as tracers of the PDR and XDR components in galactic nuclei
Table 11 shows the HCO+/HOC+, HCO+/HCO and HCO/HOC+ ratios measured for our two LOSs, the extragalactic sources (NGC 253, M 82 and NGC 1068) and typical galactic PDRs. The HCO+ column densities were calculated from the HC18O+ line by assuming 16O/18O=250 (W&R94). We also have included abundances of CS relative to HOC+ and HCO since the CS abundance does not seem to change substantially in PDRs and shocked environments in the GC (Requena-Torres et al., 2006; Martín et al., 2008).
| HCO+/HOC+ | HCO+/HCO | HCO/HOC+ | CS/HCO | CS/HOC+ | ||
|---|---|---|---|---|---|---|
| Velocity | ||||||
| Source | (km s-1) | |||||
| LOS+0.693 | 68 | 546 (175)a | 9 (3)a | 62.9 (30.1) | 6 (1) | 378 (43) |
| LOS0.11 | 20 | 1134b | 11b | … | 18 | 1960 |
| NGC 253 | 180 | 80 (30)c | 5.2 (1.8)c | 15.4 (7.9) | 2 (1)d | 25 (10)d |
| 280 | 63 (17)c | 5.4 (1.3)c | 11.7 (4.2) | 1.1 (0.5)d | 13 (5)d | |
| M 82 | 310 | 60 (28)c | 9.6 (2.8)c | 6.3 (3.4) | 1e | 1f |
| NGC 1068 | 1100 | 128 (28)c | 3.2 (1.2)c | 40.0 (17.4) | 0.3 (0.2)g | 6 (4)g |
| Horsehead | … | 75-200h | 1.1i | 68.2-181.8 | … | … |
| Orion Bar (PDR peak) | 9.5 | 166j | 2.4k | 69.2 | 3l | 100m |
| Molecular peak | 10.4 | 400j | … | … | … | 4286m |
| NGC 7023 (PDR peak) | 2.7 | 50-120j | 31k | 1.6-3.9 | 2n | 66o |
| Molecular peak | … | 200j | … | … | … | 61o |
| NGC 2023 | 10.0 | 1913p | 12k | 159.4 | … | … |
| Diffuse clouds | … | 70-120q | … | … | … | … |
- •
a We have derived the N=5.7 (1.3)1014 cm-2 from the N assuming the 16O/18O=250 ratio (W&R94). We also have found the N=1.1 (0.1)1012 cm-2 and NHCO=6.9 (1.4)1013 cm-2 in LOS+0.693.
- •
b We have derived the N=3.6 (0.8)1014 cm-2 from the N assuming the 16O/18O=250 ratio (W&R94). We also have found the N0.31012 cm-2 and NHCO3.31013 cm-2 in LOS0.11.
- •
- •
d Estimated from Martín et al. (2006b); Martín et al. (2009b).
- •
e Estimated from García-Burillo et al. (2002) and Aladro et al. (2011a).
- •
f Estimated from Fuente et al. (2006) and Aladro et al. (2011a).
- •
g Estimated from Martín et al. (2009a) and Aladro et al. (2013).
- •
- •
- •
- •
- •
l Estimated from Jansen et al. (1995) and Schilke et al. (2001).
- •
m Estimated from Jansen et al. (1995) and Fuente et al. (2003).
- •
n Estimated from Fuente et al. (1993) and Schilke et al. (2001).
- •
o Estimated from Fuente et al. (1993); Fuente et al. (2003).
- •
- •
4.2.4 The CS/HOC+ and CS/HCO ratios
Both LOSs in the GC show CS/HOC+ ratios which are larger than those measured in Galactic PDRs and galaxies by factors of 4 and 15, respectively, except for that of the molecular peak of the Orion Bar, which is completely shielded from UV radiation. Although the CS/HCO ratios also show the same trend as CS/HOC+, the CS/HCO ratios are less conclusive since these ratios are within a factor of 3 for all kinds of objects. This suggests that the PDR/XDR component, traced by HOC+ and to a lesser extent by HCO in both LOSs of the GC is smaller than those in starburst galaxies and typical unshielded galactic PDRs. The larger CS/HOC+ ratio found in LOS0.11 than in LOS+0.693 suggests a very small (basically negligible) XDR/PDR component along LOS-0.11. This is consistent with the measurements of UV and X-ray emission toward these LOSs shown in Fig. 1 and 14, respectively. The CS/HOC+ ratios measured in external galaxies are also consistent with this ratio being a good tracer of the PDR/XDR component relative to the total gas (see Table 11). The most evolved starburst M 82, has the lowest CS/HOC+ ratio (1), consistent with its classification as a PDR dominated galaxy while NGC 253 an intermediate-age starburst has a larger CS/HOC+ ratio of 25. The intermediate CS/HOC+ ratio of 6 found in NGC 1068, which is considered to be dominated by X-ray chemistry, is much smaller than the ratio found in LOS+0.693 which also shows X-rays, suggesting that the CS/HOC+ ratio could be also a good tracer of strong XDR components since the X-ray luminosity in NGC 1068 (Iwasawa et al., 1997) is nearly four orders of magnitude higher than in Sgr B2 (Koyama et al., 1996).
4.2.5 The HCO+/HOC+ and HCO+/HCO ratios
The abundance ratios HCO+/HOC+ and HCO+/HCO have also been used to estimate the contribution of the UV radiation to the chemistry of molecular clouds. HCO+/HOC+ ratios of 166 and 75-200 are measured in the Orion Bar (Fuente et al., 2003) and the Horsehead (Goicoechea et al., 2009), respectively, considered prototypical galactic PDRs. We found much larger HCO+/HOC+ ratios of 546 (175) and 1134 for LOS+0.693 and LOS0.11, respectively. These HCO+/HOC+ ratios derived in both GC sources are also higher than those measured in extragalactic sources. Like for the CS/HOC+ ratio we find that the HCO+/HOC+ ratio of the molecular peak in the Orion Bar, as well as that of NGC 2023 are close to the values observed in the GC. We consider NGC 2023 to represent the conditions in a prototypical giant molecular cloud, as Savage & Ziurys (2004) have claimed that the PDR position observed is probably embedded in the molecular cloud, therefore the HCO+/HOC+ ratio would be biased toward the typical cloud unaffected by UV radiation.
The HCO+/HCO ratios show the same trend than the HCO+/HOC+ ratios. The HCO+/HCO ratios are factors of 4-8 (LOS+0.693) and 5-10 (LOS0.11) higher than the HCO+/HCO ratio of 1-2 in typical Galactic PDRs. However, it is not clear why the HCO+/HCO ratios show smaller differences between both GC sources and galaxies. In our comparison, the PDRs NGC 7023 and NGC 2023 show the highest HCO+/HCO ratios, which are biased because both sources were observed toward positions where the HCO+ emission arises from the shielded molecular clouds (Schilke et al., 2001; Savage & Ziurys, 2004).
The difference found in the HCO+/HOC+ and HCO+/HCO ratios between our sample of typical PDRs and LOS+0.693 could be due to X-ray induced chemistry in the giant XDR observed toward Sgr B2 in the Fe K (6.4 keV) line. It has been claimed that the HOC+ and HCO abundances might increase in regions illuminated by X-rays. Usero et al. (2004) argued that XDR chemistry could provide an explanation for the different abundances of HCO+ and HOC+ measured in the Circumnuclear Disk of the AGN NGC 1068, which also shows strong Fe K (6.4 keV) line like in LOS+0.693. However they found HCO+/HOC+ ratios of 40-100 and the HCO+/HCO ratio of 3 in the CND of NGC 1068 which are similar to those found in our sample of typical PDRs. Therefore XDR chemistry seems unlikely to explain the large HCO+/HOC+ and HCO+/HCO ratios observed in the GC LOS.
Meijerink et al. (2007) modeled the chemistry induced by PDRs and XDRs in clouds with different Hydrogen column densities and incident FUV/X-ray radiation fields. By using these models they predicted column density ratios for several molecules, including the HCO+/HOC+ and HCO+/HCO ratios. For the Hydrogen column density of 21021 cm-2 and G0 of 103, the PDR model predicts HCO+/HOC+ ratios of 100, which agree with those derived in NGC 7023 and the Orion Bar (Fuente et al., 2003). For an X-ray flux of 1.6 erg cm-2 s-1, and a density of 104 cm-3, appropriate to LOS+0.693, the XDR models of (Meijerink et al., 2007) predict an HCO+/HOC+ ratio of 10 in the cloud interior. The predicted ratio is at least a factor of 55 lower than those inferred in both GC sources (see Table 11), indicating that XDR models cannot reproduce the observed HCO+/HOC+ ratios found in both GC sources. This result is consistent with the lack of X-ray emission in LOS0.11 (see Fig. 14). The derived HCO/HOC+ ratio of 63 derived in LOS+0.693 cannot be used to distinguish between the XDR or PDR scenario since this ratio is close to those of both the Horsehead, a typical PDR, and the claimed XDR NGC 1068. Finally, the HCO+/HCO ratio of 1 predicted by Meijerink et al. (2007) for PDRs with G0 of 103 is consistent with those in the Horsehead and the Orion Bar (Gerin et al., 2009; Schilke et al., 2001).
In summary, as discussed throughout this section the large HCO+/HOC+, CS/HOC+, HCO+/HCO ratios suggest that the molecular gas affected by X-ray/UV radiation fields in the two GC LOSs represent a small fraction of the total column density of molecular gas. Assuming that the observed HCO+/HCO ratio of 1.1 in the Horsehead represents the actual PDR ratio, we estimated that roughly 12% of the total column density would be affected by the UV radiation in LOS+0.693 and 10% in LOS0.11. These results also support the HNCO/CS diagnostic diagram proposed by Martín et al. (2008); Martín et al. (2009a) to establish the dominant chemistry and the heating mechanism working in molecular clouds since by using this diagram they found that the chemistry and likely the heating of both GC sources are mainly dominated by shocks.
5 Conclusions
We have used the Mopra telescope to carry out a 3 mm spectral line survey in the selected frequency ranges of 77-93 GHz and 105-113 GHz of two lines of sight, LOS+0.693 and LOS0.11, toward the Sgr B2 and Sgr A complexes in the Galactic center. The main conclusions of our study are the following:
- •
We have detected 38 molecular species and 25 isotopologues in LOS+0.693 and 34 molecular species and 18 isotopologues in LOS0.11. We have detected for the first time the PDR/XDR tracers HCO and HOC+ in the quiescent gas in LOS+0.693. These two species and the complex organic molecules HC2NC and HCOCH2OH have not been detected toward LOS0.11.
- •
The molecular excitation, Trot, and the molecular column densities are derived for all detected molecules by using a LTE approximation. The derived Trot varies between 5 and 73 K for both GC sources, but most molecules show Trot20 K, indicating subthermal excitation. The symmetric rotors, CH3CN, 13CH3CN and CH3CCH show the highest Trot of 55-73 K, consistent with a Tkin of 100 K previously derived for the GC clouds.
- •
Although LOS+0.693 and LOS0.11 are separated by more than 120 pc within the GC, 80% of molecular species detected in both GC sources reveal similar abundances within a factor of 2 and similar excitation conditions.
- •
We have used the large number of detected isotopologues to derive isotopic ratios of 12C/13C, 14N/15N, 16O/18O, 18O/17O, 29Si/30Si and 32S/34S for both GC sources. The derived 12C/13C, 18O/17O and 29Si/30Si ratios averaged over both GC sources agree within uncertainties with the “canonical” values for the GC. Our results suggest that isotopic fractionation and/or selective photodissociation do not play any role in the determination of isotopic ratios from molecular column densities.
- •
The comparison of the excitation conditions derived for both LOSs in the center of our Galaxy and those found in the starburst galaxies NGC 253 and M 82 shows that the molecular gas in the nuclei of these galaxies have similar physical conditions.
- •
CH3OH is the molecule which shows the highest abundance difference between both GC LOSs and starburst galaxies by factors of (1-6)102. The large difference is likely due to its photodissociation by UV radiation in starbursts.
- •
We have studied the HCO+/HOC+, HCO+/HCO and CS/HOC+ ratios in both GC LOSs, typical PDR regions, starburst galaxies and the AGN NGC 1068. We find that these abundances ratios cannot be used to distinguish between the effects of the X-ray and UV radiation on the molecular clouds.
- •
We also propose that the CS/HOC+, HCO+/HCO and HCO+/HOC+ ratios could be used as good tracers of PDR/XDR components in the molecular clouds in the nuclei of galaxies. These ratios can be used to estimate the fraction of the molecular gas affected by the UV radiation. For example, the large HCO+/HCO ratio found in LOS+0.693 indicates a PDR component of 12% of the total column density.
Acknowledgments
This work has been partially funded by MICINN grants AYA2010-21697-C05-01 and FIS2012-39162-C06-01, and Astro-Madrid (CAM S2009/ESP-1496). We also thank the Spanish Ministerio de Ciencia e Innovación under project ESP2013-47809-C3-1-R. We are very grateful to the anonymous referee for suggestions and comments, which have greatly improved the paper. S.M. acknowledges the co-funding of this work under the Marie Curie Actions of the European Commission (FP7-COFUND).
References
- Aladro et al. (2011a) Aladro R., Martín-Pintado J., Martín S., Mauersberger R., Bayet E. 2011a, A&A, 525, A89
- Aladro et al. (2011b) Aladro R., Martín S., Martín-Pintado J., Mauersberger R., Henkel C., Ocaña-Flaquer B., Amo-Baladrón M. A. 2011b, A&A, 535, A84
- Aladro et al. (2013) Aladro R. et al., 2013, A&A, 549, A39
- Amo-Baladrón et al. (2011) Amo-Baladrón M. A., Martín-Pintado J., Martín S. 2011, A&A, 526, A54
- Apponi et al. (1999) Apponi A. J., Pesch T. C., Ziurys L. M. 1999, ApJ, 519, L89
- Bally et al. (1987) Bally J., Stark A. A., Wilson R. W. 1987, ApJS, 65, 13
- Batrla & Menten (1988) Batrla W., Menten K. M. 1988, ApJ, 329, L117
- Belloche et al. (2013) Belloche A., Müller H. S. P., Menten K. M., Schilke P., Comito C. 2013, A&A, 559, A47
- Carral et at. (1994) Carral P., Hollenbach D. J., Lord S. D., Colgan S. W. J., Haas M. R., Rubin R. H., Erickson E. F. 1994, ApJ, 423, 223
- Churchwell et al. (1992) Churchwell E., Walmsley C. M., Wood D. O. S. 1992, A&A, 253, 541
- Coil & Ho (2000) Coil A. L., Ho P. T. P. 2000, ApJ, 533, 245
- De Pree et al. (1996) De Pree C. G., Gaume R. A., Goss W. M., Claussen M. J. 1996, ApJ, 464, 788
- De Pree et al. (1998) De Pree C. G., Goss W. M., Gaume R. A. 1998, ApJ, 500, 847
- Ferrière et al. (2007) Ferrière K., Gillard W., Jean P. 2007, A&A, 467, 611
- Ferrière (2012) Ferrière K. 2012, A&A, 540, A50
- Fuente et al. (1993) Fuente A., Martín-Pintado J., Cernicharo J., Bachiller R. 1993, A&A, 276, 473
- Fuente et al. (2003) Fuente A., Rodríguez-Franco A., García-Burillo S., Martín-Pintado J., Black J. H. 2003, A&A, 406, 899
- Fuente et al. (2006) Fuente A., García-Burillo S., Gerin M., Rizzo J. R., Usero A., Teyssier D., Roueff E., Le Bourlot J. 2006, ApJ, 641, L105
- Frerking et al. (1982) Frerking M. A., Langer W. D., Wilson R. W. 1982, ApJ, 262, 590
- Friedel et al. (2004) Friedel D. N., Snyder L. E., Turner B. E., Remijan A. 2004, ApJ, 600, 234
- García-Burillo et al. (2002) García-Burillo S., Martín-Pintado J., Fuente A., Usero A., Neri R. 2002, ApJ, 575, L55
- Gerin et al. (2009) Gerin M., Goicoechea J. R., Pety J., Hily-Blant P. 2009, A&A, 494, 977
- Goicoechea et al. (2004) Goicoechea J. R., Rodríguez-Fernández N. J., Cernicharo J. 2004, ApJ, 600, 214
- Goicoechea et al. (2009) Goicoechea J. R., Pety J., Gerin M., Hily-Blant P., Le Bourlot J. 2009, A&A, 489, 771
- Gordon et al. (1993) Gordon M. A., Berkermann U., Mezger P. G., Zylka R., Haslam C. G. T., Kreysa E., Sievers A., Lemke R. 1993, A&A, 280, 208
- Goss et al. (1985) Goss W. M., Schwarz U. J., van Gorkom J. H., Ekers R. D. 1985, MNRAS, 215, 69
- Güsten et al. (1985) Güsten R., Walmsley C. M., Ungerechts H., Churchwell E. 1985, A&A, 142, 381
- Hasegawa et al. (1994) Hasegawa T., Sato F., Whiteoak J. B., Miyawaki R. 1994, ApJ, 429, L77
- Herrnstein & Ho (2002) Herrnstein R. M., Ho P. T. P. 2002, ApJ, 579, L83
- Hüttemeister et al. (1993) Hüttemeister S., Wilson T. L., Bania T. M., Martín-Pintado J. 1993, A&A, 280, 255
- Israel & Baas (2003) Israel F. P., Baas F. 2003, 404, 495
- Iwasawa et al. (1997) Iwasawa K., Fabian A. C., Matt G. 1997, MNRAS, 289, 443
- Jansen et al. (1995) Jansen D. J., Spaans M., Hogerheijde M. R., van Dishoeck E. F. 1995, A&A, 303, 541
- Knight et al. (1986) Knight J. S., Freeman C. G., McEwan M. J., Smith S. C., Adams N. G., Smith D. 1986, MNRAS, 219, 89
- Koyama et al. (1996) Koyama K., Maeda Y., Sonobe T., Takeshima T., Tanaka Y., Yamauchi S. 1996, PASJ, 48, 249
- Liszt et al. (2004) Liszt H., Lucas R., Black J. H. 2004, A&A, 428, 117
- Lu et al. (2003) Lu F. J., Wang Q. D., Lang C. C. 2003, AJ, 126, 319
- Martín-Pintado et al. (1990) Martín-Pintado J., de Vicente P., Wilson T. L., Johnston K. J. 1990, A&A, 236, 193
- Martín-Pintado et al. (1997) Martín-Pintado J., de Vicente P., Fuente A., Planesas P. 1997, ApJ, 482, L45
- Martín-Pintado et al. (2000) Martín-Pintado J., de Vicente P., Rodríguez-Fernández N. J., Fuente A., Planesas P. 2000, A&A, 356, L5
- Martín-Pintado et al. (2001) Martín-Pintado J., Rizzo J. R., de Vicente P., Rodríguez-Fernández N. J., Fuente A. 2001, ApJ, 548, L65
- Martín et al. (2006a) Martín S., Martín-Pintado J., Mauersberger R. 2006a, A&A, 450, L13
- Martín et al. (2006b) Martín S., Mauersberger R., Martín-Pintado J., Henkel C., García-Burillo S. 2006b, ApJS, 164, 450
- Martín et al. (2008) Martín S., Requena-Torres M. A., Martín-Pintado J., Mauersberger R. 2008, ApJ, 678, 245
- Martín et al. (2009a) Martín S., Martín-Pintado J., Mauersberger R. 2009a, ApJ, 694, 610
- Martín et al. (2009b) Martín S., Martín-Pintado J., Viti S. 2009b, ApJ, 706, 1323
- Martín et al. (2010) Martín S., Aladro R., Martín-Pintado J., Mauersberger R. 2010, A&A, 522, A62
- Mehringer et al. (1995) Mehringer D. M., Palmer P., Goss W. M. 1995, ApJS, 97, 497
- Meier & Turner (2005) Meier D. S., Turner J. L. 2005, ApJ, 618, 259
- Meier & Turner (2012) Meier D. S., Turner J. L. 2012, ApJ, 755, 104
- Meijerink et al. (2007) Meijerink R., Spaans M., Israel F. P. 2007, A&A, 461, 793
- Mezger & Henderson (1967) Mezger P. G. Henderson A. P. 1967, ApJ, 147, 471
- Mills et at. (2011) Mills E., Morris M. R., Lang C. C., Dong H., Wang Q. D., Cotera A., Stolovy S. R. 2011, ApJ, 735, 84
- Morris & Serabyn (1996) Morris M., Serabyn E. 1996, ARA&A, 34, 645
- Mul & McGowan (1980) Mul P. M., McGowan J. W. 1980, ApJ, 237, 749
- Müller et al. (2001) Müller H. S. P., Thorwirth S., Roth D. A., Winnewisser G. 2001, A&A, 370, L49
- Müller et al. (2005) Müller H. S. P., Schlöder F., Stutzki J., Winnewisser G. 2005, J. Molecular Spectroscopy and Structure, 742, 215
- Nummelin et al. (1998) Nummelin A., Bergman P., Hjalmarson Å., Friberg P., Irvine W. M., Millar T. J., Ohishi M., Saito S. 1998, ApJS, 117, 427
- Nummelin et al. (2000) Nummelin A., Bergman P., Hjalmarson Å., Friberg P., Irvine W. M., Millar T. J., Ohishi M., Saito S. 2000, ApJS, 128, 213
- Pickett et al. (1998) Pickett H. M., Poynter R. L., Cohen E. A., Delitsky M. L., Pearson J. C., Müller H. S. P. 1998, J. of Quantitative Spectroscopy and Radiative Transfer, 60, 883
- Ponti et al. (2010) Ponti G., Terrier R., Goldwurm A., Belanger G., Trap G. 2010, ApJ, 714, 732
- Requena-Torres et al. (2006) Requena-Torres M. A., Martín-Pintado J., Rodríguez-Franco A., Martín S., Rodríguez-Fernández N. J., de Vicente P. 2006, A&A, 455, 971
- Requena-Torres et al. (2008) Requena-Torres M. A., Martín-Pintado J., Martín S., Morris M. R. 2008, ApJ, 672, 352
- Rodríguez-Fernández et al. (2001) Rodríguez-Fernández N. J., Martín-Pintado J., Fuente A., de Vicente P., Wilson T. L., Hüttemeister S. 2001, A&A, 365, 174
- Rodríguez-Fernández et al. (2004) Rodríguez-Fernández N. J., Martín-Pintado J., Fuente A., Wilson T. L. 2004, A&A, 427, 217
- Riquelme et al. (2010) Riquelme D., Amo-Baladrón M. A., Martín-Pintado J., Mauersberger R., Martín S., Bronfman L. 2010, A&A, 523, A51
- Savage & Ziurys (2004) Savage C., Ziurys L. M. 2004, ApJ, 616, 966
- Schilke et al. (2001) Schilke P., Pineau des Forêts G., Walmsley C. M., Martín-Pintado J. 2001, A&A, 372, 291
- Spaans & Meijerink (2007) Spaans M., Meijerink R. 2007, ApJ, 664, L23
- Sutton et al. (1991) Sutton E. C., Jaminet P. A., Danchi W. C., Blake G. A. 1991, ApJS, 77, 255
- Terrier et al. (2010) Terrier R., Ponti G., Bélanger G., et al., 2010, ApJ, 719, 143
- Turner (1991) Turner B. E. 1991, ApJS, 76, 617
- Usero et al. (2004) Usero A., García-Burillo S., Fuente A., Martín-Pintado J., Rodríguez-Fernández N. J. 2004, A&A, 419, 897
- van der Tak et al. (2007) van der Tak F. F. S., Black J. H., Schöier F. L., Jansen D. J., van Dishoeck E. F. 2007, A&A, 468, 627
- Wilson & Matteucci (1992) Wilson T. L., Matteucci F. 1992, A&ARv, 4, 1
- Wilson & Rood (1994) Wilson T. L., Rood R. T. 1994, ARA&A, 32, 191
- Yusef-Zadeh & Morris (1987) Yusef-Zadeh F., Morris M. 1987, ApJ, 320, 545
- Yusef-Zadeh et al. (2004) Yusef-Zadeh F., Hewitt J. W., Cotton W. 2004, ApJS, 155, 421
- Yusef-Zadeh et al. (2005) Yusef-Zadeh F., Wardle M., Muno M., Law C., Pound M. 2005, Advances in Space Research, 35, 1074
- Zuckerman et al. (1972) Zuckerman B., Turner B. E., Johnson D. R., Palmer P., Morris M. 1972, ApJ, 177, 601