Breakdown of Benford’s Law for Birth Data
Abstract
Long birth time series for Romania are investigated from Benford’s law point of view, distinguishing between families with a religious (Orthodox and Non-Orthodox) affiliation. The data extend from Jan. 01, 1905 till Dec. 31, 2001, i.e. over 97 years or 35 429 days. The results point to a drastic breakdown of Benford’s law. Some interpretation is proposed, based on the statistical aspects due to population sizes, rather than on human thought constraints when the law breakdown is usually expected. Benford’s law breakdown clearly points to natural causes.
Keywords: births; religious community; Orthodoxes; Non-Orthodoxes; Benford’s laws; time series.
1 Introduction
Newcomb [1] and later Benford [2] observed that the occurrence of significant digits in many data sets is uniform but tends to follow a logarithmic distribution such that the smaller digits appear as the first significant digits more frequently than the larger ones, i.e.,
| (1) |
where is the total number of considered 1-st digits for checking the law, in short, the number of data points, and is the number of the observed integer ( ). Usually, it seems that Benford’s law breaks down when there is human manipulation or control (in various ways) of the data.
The literature on the subject is enormous [3, 4] and not all papers can be quoted here. A few of socio-econo-statistical physics papers of interests are pointed out in Section 2.
In this paper, our goal is to investigate whether Benford’s law holds, on long birth time series, distinguishing between the religious adhesion (Eastern Orthodox or not) of families in Romania for a time interval extending from Jan. 01, 1905 till Dec. 31, 2001, i.e. over 97 years or 35 429 days. The results point to a drastic breakdown of Benford’s law. Some interpretation is proposed, based on the statistical aspects due to population sizes, rather than on human thought constraints.
In Section 3, the data acquisition is recalled. It leads to a set of time series. The data of interest are displayed through histograms and discussed following a statistical analysis in Section 3.2. All Benford law tests are found in Section 4, in particular with a test of Benford’s law for the 1st and 2nd digits of the time series of the daily birth number of babies in Romania, distinguishing between Orthodox and Non-Orthodox families.
Since the results point to a drastic breakdown of Benford’s law, a discussion of the findings, followed by an explanation, is found in Section 5.
Section 6 serves for a conclusion emphasizing (i) the interest of such a data study along Benford’s law concepts, and (ii) the complexity of studying a community, and its religiosity, through its baby birth history.
2 Benford’s law: a short state of the art literature review
The applications of Benford’s law are too numerous to be all quoted here [3, 4]. Nevertheless, for shining some light on the subject, we point to those Benford’s law showing detection of data anomalies in actuarial and financial cases [5] -[10], and also in political cases [11, 12] and surveys [13].
Beside these fields of applications, Benford’s law has been applied in less dwelled subjects, e.g., when discussing the appearance of numbers on the internet [14], or recently, [15] for comparing articles of scientific journals. The law has been suggested to be also useful for optimizing the size of computer files [16] or for enhancing computing speed [17].
In biological sciences, Benford’s law has been utilized to check the veracity of the data on clinical trials [18] and discovery of drugs [19], and in the study of diseases and genes [20]. Similarly, in physics, Benford’s law has been used to detect data anomalies in numerical data on physical constants [21], atomic spectra [22, 23], decay width of hadrons [24], magnitude and depth of earthquakes [25], while in astrophysics [26], for the mantissa distribution of pulsars [27] or the distances of galaxies and stars [28].
In econophysics, the yearly financial reports of the Belgian Antoinist community, income and expenses, were examined along the so-called Benford’s law in order to detect any wrongdoing in the finance of such a sometimes called religious sect. Nothing anomalous was found. Note that an imperfect (”generalized”) Benford’s law-like form, better suited for distributions presenting a minimum at some intermediate digit, was presented in [29].
3 Data

The data were obtained from 1992 and 2002 censuses by the Romanian National Institute of Statistics (NIS). The data of interest pertain to the record of the total number of births in Romania for persons still alive at the 1992 and 2002 census reference points. In this respect, the data might rather be called ”survival occurrence from birth date”. The fact that the true daily birth data are not known to us is irrelevant for the present considerations. Thereafter, we will use, for conciseness, the vocabulary ”born per day” instead of the ”number of births on a given day for persons still alive in 1991 and 2001, respectively, for the 1992 and 2002 census”.
The data census allows to distinguish the population under various criteria, e.g. the religious adhesion. Such data must be taken with caution [30, 31, 37, 38], but the orders of magnitude are usually trustworthy [39]-[41]. The most important community, from the religion point of view, according to the census sources is the Eastern-Orthodox (86.8%). The so called here below ”Non-Orthodox families” (13.2%) are mainly made of Roman-Catholics (4.7%), Reformed Church (3.2%), Pentecostals (1.5%), Greek-Catholics (0.9%), Baptists (0.6%), Seventh Day Adventists (0.4%), Moslems (0.3%), Unitarians (0.3 %), Lutherans (0.3%), Evangelicals (0.2%) and Old Rite Christians (0.2%). Other denominations (0.6%), including atheists, have each a smaller size.
3.1 Time series
Thus, we have some information on births in Romania from Jan. 01, 1905 till Dec. 31, 2001, i.e. 97 years or 35 429 days, see Fig. 1. Note that several data points overlap in the display, because the number of born babies occurs to be the same on various days during the year. It is also observed that several occurrences seem to exist as outliers. We have kept the official data unchanged.
Part of the resulting time series for the number of born babies are shown in Fig. 2 for the case of Non-Orthodox and Orthodox families, for the last 20 years, [1982-2001], of the examined whole time interval. These short time interval examples have been selected in order to show that nothing very drastic seemed to have occurred then at a time of turmoil. Each horizontal bar between two consecutive years refers to the mean of the former year. Nevertheless, a large daily variation, the height of the bar, is seen within each year. However, the orders of magnitude are barely changed. Nevertheless, observe the respective orders of magnitude on the -axes for both types of families: the ratio between Non-Orthodox and Orthodox birth number in such families is about 15%. This is in agreement with the record for the whole population 1992 census. The same ratio was also recorded for the 2002 census. However, the downward jump occurring in 1990, after the Berlin wall fall and communist regime fall in Romania, is well marked in both cases. This is more strongly so for the case of Orthodox families, Fig. 2. This can be interpreted as due to some ”woman liberalization condition”, e.g. to a spontaneous relaxation with respect to Ceausescu Oct. 01, 1966 decree (770) forbidding abortion. In this respect, note the remarkable peak in 1967, on Fig. 1: the cohort born in 1967 doubled compared to that in the previous year.

| Total | Orthodoxes | Non-Orthodoxes | ||
| Minimum | 19 | 14 | 2 | |
| Maximum | 3249 | 2942 | 377 | |
| Total (x 106) | 24.947 | 21.630 | 3.317 | |
| Mean () | 704.14 | 610.51 | 93.631 | |
| Median () | 714 | 617 | 97 | |
| Mode() | 628.3 | 626.2 | 91.05 | |
| RMS | 769.31 | 670.59 | 99.982 | |
| Std. Dev. () | 309.89 | 277.43 | 35.065 | |
| Var. | 96030 | 76967 | 1229.5 | |
| Std. Err. | 1.6464 | 1.4739 | 0.18629 | |
| Skewness | 0.049587 | 0.096844 | -0.17298 | |
| Kurtosis | 1.1619 | 1.1326 | 1.5394 | |
| () | 2.272 | 2.201 | 2.670 |
3.2 Histograms daily range
The number of babies born and still alive depends on the year and the day. The discussion of such a time dependence is outside the scope of the present study.
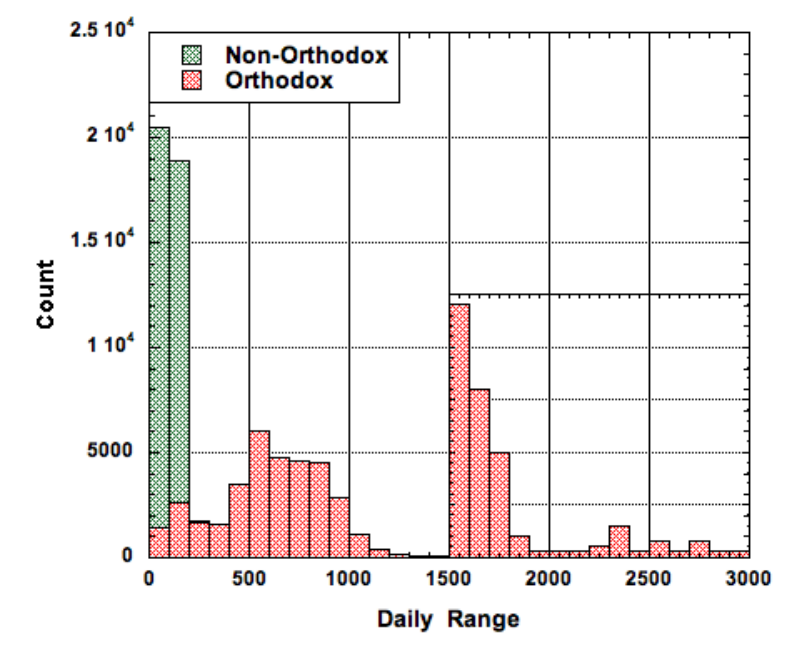
Fig. 3 is a histogram of the number of babies born per day in Orthodox and Non-Orthodox families in the examined time interval. The distribution for Orthodox and Non-Orthodox families, respectively, is given in Fig. 4 and Fig. 5 also under a histogram form.
More statistical considerations are given in Table 1. The minima and the maxima i.e. the daily ranges are [14; 2942] and [2; 377], respectively, for Orthodox and Non-Orthodox families. The range width ratio itself is 7, rather larger than the population census ratio.
Note that for the considered century time interval, the ratio in the number of babies born in Orthodox and in Non-Orthodox families is about 6.5 (). This corresponds well to the population ratio census, reporting a 6.6 ratio between such families. This denotes a lower fertility for Orthodox families [42].
An interesting value is the mean to standard deviation ratio which allows to admit that the mean value is that of a single peak or so distribution. It indicates a more peaky distribution for the Non-Orthodox case. In fact, for this community, the skewness is negative. The kurtosis is positive in all cases.
Therefore a specific comment is in order: from Fig. 6, i.e. the histogram of the number of babies born per day in Orthodox and Non-Orthodox families, one reads that there are usually a few (less than 100) Non-Orthodox babies born per day. Therefore, it can be concluded that they are rather evenly distributed during the year. However, the Orthodox families have babies in short time intervals during the year. Our interpretation points to religious constraints. Indeed, the Orthodox church rules request to have less sexual activity in periods before Easter and Christmas. Due to this restriction on sexual activity, this is implying that the average number of babies per day appears necessarily larger in the Orthodox case.


4 Benford’s laws tests
Due to the range in the number of births, it seems interesting to test Benford’s law, not only for the first reported digits, but also for the second digit. In practice, applications of Benford’s law for fraud detection routinely use more than the first digit [5].
4.1 Benford’s law 2nd digit
Indeed, the above Eq.(1) can be extended to forecast how many times any digit, or also any combination, should be found at some rank in the string of digits [5], requoted by [9]. In the latter case, the ”0” has to be taken into account.
The probability of encountering a number starting a string of digits with the digit is given by
| (2) |
Thus, the probability that ( = 0, 1, …, 9) is encountered as the -th ( 1) digit is
| (3) |
For instance, the probability that a ”0” is encountered, [5], as the second digit is
| (4) |
The variation is very smooth. It is easy to find that the probability that a ”1” or a ”9” is encountered as the second digit is 0.1139 and 0.0850, respectively.


Fig. 7 to 10 allow us to compare the first and second digit frequencies and the expected ones according to Benford’s law for the two cases of interest.
First, it is examined whether the distributions of the first digits match the distribution specified by Benford’s law Eq.(1). Second, it is examined whether the first digits occur as often as expected from Eq.(3) at the second rank. In order to do so a test has been used:
| (5) |
for the first digit and
| (6) |
for the second digit, - where and are the theoretically expected values.
The -distribution () with 8 degrees of freedom has a critical value of 15.507 for the 0.05-level confidence test [43] while the –distribution with 9 degrees of freedom () has a critical value of 16.91 for the 0.05-level confidence test.
4.2 Application to cases when distinguishing religious adhesions
- •
Let us consider whether Benford’s law is respected for the Non-Orthodox families. In this case, the number of births can be only 1 digit long, see Table 1 last column. There are 108 cases (days); thus 35 321 data entries (days) are only studied, instead of 35 429, for the second digit aspect. This corresponds to a total of 809 babies.
It is visually observed from Fig. 7 that Benford’s law is unlikely respected; for the second digit, see Fig. 9. It is easily calculated that and for the first and second digit respectively. Thus, a statistically significant difference is confirmed between the observed distribution and the theoretical Benford distribution.
- •
In the case of Orthodox families, a statistically significant difference is visually expected (Fig 8) and numerically observed when applying the test to the daily number of birthsÕ first digits. One obtains for the first digit, and 3888.9 for the second digit (Fig 10). Thus, there is a major statistically significant difference in the case of Orthodox daily number of births.
5 Discussion
The above analysis shows a large difference between observation and expectation for the first digit. For the second digit, the survey data are in rather close agreement with the theoretical distribution. The former observation needs some interpretation.
It seems that Benford’s law breakdown can be more easily understood starting from the Non-Orthodox number of births cases, when observing the histogram data in Fig. 4. The peak count occurs in the bins 90 to 110. This fact suggests that the most important birth numbers are 90, 91, , 98, 99, 100, 101, 102, ,109, 110. Therefore, it can be understood that the most important first digit is 1; it occurs 11 times. The next most important 1st digit is 9; it occurs 10 times, as seen in Fig 7. Furthermore, the most important second digit is 0; it occurs 11 times also. The other digits are being almost equally possible at the second rank, as seen in Fig. 8.
This being understood, a similar reasoning can be held for the Orthodox number of births cases. The main peak, see Fig. 5, extends from 500 up to 900. Therefore, it is understandable that the most often occurring first digits, in this case, are 5, 6, 7, 8; see Fig. 9. Concerning the second digit, Fig. 10, due to the large range of the main data peak, the second digits are equally likely as observed.
In both cases, the baby per day peak occurs near the mean or median (see Table 1). Thus, Benford’s law about the 1st digit can be expected to apply for Non-Orthodoxes, for which the mean and median are near 100. However, the 1st digit law cannot be valid for Orthodox families, since the mean or median is near 600.
Therefore, the origin of the breakdown seems attributable to the number of couples ”available for” procreating babies during the year. It has been observed in Table 1 that there are approximately 100 and 600 babies produced per day, on average, for Non-Orthodox and Orthodox families respectively. We consider that there are 360 and 300 possible nights, respectively, for sexual activity due to religious conditions, thereby leading to the Table 1 data. Let us assume that procreation occurs for couples with partners who are between 20 and 40 years old. Assuming much constancy in the sexual relations during these 20 years, the respective number of families (or couples) being concerned is about 0.72 106 and 3.6 106 respectively. These values seem indeed to be a good order of magnitude for the sexually active and procreative romanian population, per year, during the last century, and in fine explain the breakdown of the law for the 1st digit.
A logical questioning follows: according to Nigrini and Mittermaier [6], Benford’s law should not (or does not!) apply when human thought is involved (such as supermarket prices and New York Stock Exchange (NYSE) quotation prices) or when there are ”constraints” as in telephone numbers, lottery numbers, car license plates, or street addresses11 1 However, Benford considered that the law works for street addresses, item R in TableIV of [2], for pre-selected persons [32]. From these remarks, we should wonder whether the conception of babies, and their subsequent birth, results more from a Woman-Man thought than from some random (or spontaneous) sexual activity. This interesting question needs further investigation outside the scope of this paper.
6 Conclusions
Benford’s law universal validity has always been questioned. It has been explained and/or justified along various mathematical hypotheses on number occurrences. However, when it is valid in physics and more generally in science is still an open question. Many cases have been discussed as seen in the short list of references given in the bibliography. There are cases, thus data, in which the validity or breakdown can be fully proved. Nevertheless, the causes or origins are debatable. Benford himself examined 20 cases and pointed to some validity, but with large deviations. The death rate case22 2 Alas, in [2], there is no information on the data origin came 10th in the validity order.
We have examined unusually very long data series about birth frequency with survival occurrence up to some census date. To the question: ”Is Benford’s law valid in the case of birth data?”, our answer is obviously ”No”, according to the tests. We have justified the conclusion, finely discussing the survey data.
In conclusion, let us point to three considerations on the puzzling question:
- •
If the numbers under investigation are not entirely random but somehow socially or naturally related, the distribution of the first digit is not uniform, according to the empirical findings and the theories [44].
- •
According to Burns [45], people (largely) follow Benford’s law. Quoting: Understanding whether (or when) people follow BenfordÕs law is important for both practical and theoretical reasons. Practically, the value of BenfordÕs law as a detector of fraud or error is a product of being able to predict when invalid data will nevertheless fit it. Theoretically, it is valuable because it is a precise distribution that every person has had exposure to over their lives. Thus it could be a useful test case for how sensitive people are to a statistical relationship that they are not consciously aware of.
- •
In Dobrow’s recent book [46], it is claimed that There are a huge number of data sets which exhibit BenfordÕs law, including street addresses, populations of cities, stock prices, mathematical constants, birth rates, heights of mountains, and line items on tax returns.
Three comments must follow, one for each previous item, respectively. On one hand, we have considered cases of socially or naturally related data distributions, in which people pertain to a distribution to which they are exposed during the whole life. Such a large set of analyzed data is rather rare. On the other hand, it seems that one should be more restrictive about Benford’s law validity in socially or naturally related data. In fact, Raimi [32] already had seemed to claim the contrary of Dobrow’s (and Benford) about street addresses. The present paper also questions the blind application of Benford’s law to birth rates (or survival) data. Benford claimed to have analyzed, among 20 229 real numbers from 20 sources, one being ”death rates” (item T, in Table 1 of [2]), but without mentioning what data were examined, nor the meaning of rate. It seems that one claims too much concerning Benford’s data analysis and possible applications.
Thus, we have shown not only (i) the interest of such a data study along Benford’s law concepts, but also (ii) the complexity of studying a community, and its religiosity, through its baby birth history.
Whence we emphasize that people are influenced by statistical relationships due to their environment, in particular in socio structural formation, - thereby lowering the reasoning and decision making parameter influence to be introduced in socio-physics models. Therefore, last but not least, we recommend in further work on Benford’s law to examine the data distribution at the start of the investigation, in order to underline so called physical (or more generally, natural) causes at first.
Acknowledgment
This paper is part of MA scientific activities in COST Action TD1210 ”Analyzing the dynamics of information and knowledge landscapes’”.
This work by CH was co-financed from the European Social Fund through the Sectoral Operational Programme Human Resources Development 2007-2013, project number POSDRU/1.5/S/59184 Performance and excellence in postdoctoral research in Romanian economics science domain.
References
- [1] S. Newcomb, Note on the frequency of use of the different digits in natural numbers, Amer. J. Math. 4 (1881) 39-40.
- [2] F. Benford, The law of anomalous numbers, Proc. Amer. Philos. Soc. 78 (1938) 551-572.
- [3] W. Hürlimann, Benford’s law from 1881 to 2006,
- [4] N.H.F. Beebe, A Bibliography of Publications about Benford’s Law, Heaps’ Law, and Zipf’s Law,
- [5] M.J. Nigrini, A Taxpayer Compliance Application of Benford’s Law, J. Amer. Tax Ass. 18 (1996) 72-91.
- [6] M.J. Nigrini, L.J. Mittermaier, The use of Benford’s law as an aid in analytical procedures, Auditing J. Pract. Th. 16 (1997) 52-67.
- [7] M.J. Nigrini, Digital analysis using Benford’s law: tests statistics for auditors, Global Audit Publications, Vancouver, 2000.
- [8] J.R. Rodriguez, Reducing false alarms in the detection of human influence on data, Journal of Accounting, Auditing & Finance 19 (2) (2004) 141–158.
- [9] C. Durtschi, W. Hillison, C. Pacini, The effective use of Benford’s law to assist in detecting fraud in accounting data, J. Forensic Acc. 5 (2004) 17-34.
- [10] B. Rauch, M. G ” ottsche, G. Br ” ahler, S. Engel, Fact and Fiction in EU-Governmental Economic Data, Germ. Econ. Rev. 12 (2011) 243-255.
- [11] W.R. Mebane Jr., The wrong man is president! Overvotes in the 2000 presidential election in Florida, Presp. Polit. 2 (2004) 525-535.
- [12] B.F. Roukema, Benford’s Law anomalies in the 2009 Iranian presidential election, .
- [13] G. Judge, L. Schechter, Detecting Problems in Survey Data Using Benford’s Law, J. Hum. Resour. 44 (2009) 1-24.
- [14] S.N. Dorogovtsev, Frequency of occurrence of numbers in the World Wide Web, Physica A 360 (2006) 548-556.
- [15] A.D. Alves, H.H. Yanasse, N.Y. Soma, BenfordÕs Law and articles of scientific journals: comparison of JCR and Scopus data, Scientometrics 98 (2014) 173-184.
- [16] J.L. Barlow, E.H. Bareiss, On roundoff error distributions in floating point and logarithmic arithmetic, Computing 34 (1985) 325-347.
- [17] P. Schatte, On mantissa distributions in computing and Benford’s law, J. Inf. Proc. Cyber. 24 (1988) 443-455.
- [18] T.W. Beer, Terminal digit preference: beware of Benford’s law, J. Clin. Pathol. 62 (2009) 192.
- [19] M. Orita, Use of Benford’s law in drug discovery data, Drug Discovery Today 15 (2010) 328-331.
- [20] J.L.H. Caceres, J.L.P. García, C.M. Martinez, First digit distribution in some biological data sets. Possible explanations for departures from Benford’s Law, J. Biomed. 1 (2008) 27-35.
- [21] J. Burke, E. Kincanon, Benford law and physical constants - The distribution of initial digits, Am. J. Phys. 59 (1991) 952.
- [22] J.C. Pain, Benford’s law and complex atomic spectra, Phys. Rev. E 77 (2008) 012102.
- [23] B. Buck, A.C. Merchant, S.M. Perez, An illustration of Benford’s first digit law using alpha decay half lives, Eur. J. Phys. 14 (1993) 59-63.
- [24] L. Shao, B.Q. Ma, First digit distribution of hadron full width, Mod. Phys. Lett. A 24 (2009) 3275-3282.
- [25] M. Sambridge, H. Tkalčić, A. Jackson, Benford’s law in the natural sciences, Geo. Phys. Res. Lett. A 37 (2010) L22301.
- [26] M.A. Moret, V. de Senna, M.G. Pereira, G.F. Zebende, Newcomb-Benford law in astrophysical sources, International Journal of Modern Physics C 17 (11) (2006) 1597–1604.
- [27] L. Shao, B.Q. Ma, Empirical mantissa distributions of pulsars, Astrop. Phys. 33 (2010) 255-262.
- [28] T. Alexopoulos, S. Leontsinis, Benford’s Law and the Universe, .
- [29] P. Clippe, M. Ausloos, Benford’s law and Theil transform of financial data, Physica A 391(24) (2012) 6556–6567.
- [30] T.A. Mir, The law of the leading digits and the world religions, Physica A 391 (2012) 792-798.
- [31] T.A. Mir, The Benford law behavior of the religious activity data, Physica A 408 (2014) 1-9.
- [32] R. Raimi, The first digit problem, Am. Math. Mon. 83 (1976) 521-538.
- [33] C.R. Tolle, J.L. Budzien, R.A. LaViolette, Do dynamical systems follow Benford’s law?, Chaos 10 (2000) 331-336.
- [34] E. Canessa, Theory of analogous force on number sets, Physica A 328 (1) (2003) 44–52.
- [35] M.A. Snyder, J.H. Curry, A.M. Dougherty, Stochastic aspects of one-dimensional discrete dynamical systems: BenfordÕs law, Phys. Rev. E 64 (2001) 026222.
- [36] A. Berger, T.P. Hill, A basic theory of Benford’s Law, Probability Surveys 8 (2011) 1-126.
- [37] M. Ausloos, F. Petroni, Statistical dynamics of religions and adherents, Europhys. Lett. 77 (2007) 38002.
- [38] M. Ausloos, F. Petroni, Statistical Dynamics of Religions, Physica A 388 (2009) 4438–4444.
- [39] J. Hayward, Mathematical Modeling of Church Growth, J. Math. Sociol. 23 (1999) 255-292.
- [40] C. Herteliu, Statistical Indicators System regarding Religious Phenomena, J. Study of Religions and Ideologies 16 (2007) 115-131.
- [41] M. Ausloos, Two-exponent Lavalette function: A generalization for the case of adherents to a religious movement, Physical Review E (2014) 002800.
- [42] Al. Isaic-Maniu, C. Herteliu, Fertilitatea, nationalitatea si religia ìn Romania - perspective si implicatii pe termen lungÓ, (in romanian), Statistica-Problema fiecaruia (Academia de Studii Economice, Bucharest, 2004).
- [43] T. Bradley, Essential Statistics for Economics, Business and Management, J. Wiley, Chicheter, 2007, ch. 11 and Table 7
- [44] D.R. Radev, Weakly supervised graph-based methods for classification. Technical Report CSE-TR-500-04, University of Michigan. Department of Electrical Engineering and Computer Science, 2004.
- [45] B.D. Burns, Sensitivity to statistical regularities: People (largely) follow Benford’s law, Proc. Thirty-First Annual Conference of the Cognitive Science Society, Cognitive Science Society, Austin, TX (2009) 2872-2877.
- [46] R.P. Dobrow, Probability: With Applications and R, J.Wiley, Chichester, 2013, Introduction, p. xxi.