Early-time polarized optical light curve of GRB 131030A
Abstract
We report the polarized optical light curve of a gamma-ray burst afterglow obtained using the RoboPol instrument. Observations began 655 seconds after the initial burst of gamma-rays from GRB 131030A, and continued uninterrupted for 2 hours. The afterglow displayed a low, constant fractional linear polarization of throughout, which is similar to the interstellar polarization measured on nearby stars. The optical brightness decay is consistent with a forward-shock propagating in a medium of constant density, and the low polarization fraction indicates a disordered magnetic field in the shock front. This supports the idea that the magnetic field is amplified by plasma instabilities on the shock front. These plasma instabilities produce strong magnetic fields with random directions on scales much smaller than the total observable region of the shock, and the resulting randomly-oriented polarization vectors sum to produce a low net polarization over the total observable region of the shock.
Keywords:
gamma-ray burst: individual: GRB 131030A – magnetic fields – polarization – shock waves1 Introduction
Gamma-ray burst (GRB) afterglows are usually attributed to the synchrotron emission from a shock or jet propagating through the circumburst medium. The observed emission is thought to be the combination of the forward shock and a reverse shock that propagates backward into the flow (Piran, 1999; Zhang, Kobayashi & Mészáros, 2003), with the reverse shock dominating at early times. The light from the reverse shock might be highly linearly polarized if ordered magnetic fields thread the ejecta (Granot & Königl, 2003; Lyutikov, 2003; Lazzati et al., 2004), while the polarization of the forward shock depends of the circumburst magnetic field (Uehara et al., 2012).
The early-time polarized optical GRB afterglow emission has been measured five times. Mundell et al. (2007) measured a upper limit of 8 % on the linear polarization 203 s after the GRB event for GRB 060418. They interpreted this relatively-low polarization level as ruling out the presence of a large-scale ordered magnetic field. The next measurement of the early-time afterglow polarization was made by Steele et al. (2009) of GRB 090102 160.8 s after the GRB. They, by contrast, measured a level of , which they interpreted as coming from the reverse shock. GRB 110205A was measured by Cucchiara et al. (2011) to have a upper limit of 16 % 243 s after the BAT trigger time. A later measurement 56 min after the trigger time found a polarization level of % ( confidence levels). They excluded the zero-polarization hypothesis at a 92 % confidence level, supporting a reverse plus forward-shock scenario. Uehara et al. (2012) measured the optical polarization afterglow of GRB 091208B from 149 to 706 s after the burst trigger and found a linear polarization level of . At the time of the measurement the optical light curve exhibited a power-law decay (index of ), which they interpreted as the signature of the forward shock synchrotron emission.
Most recently, Mundell et al. (2013) obtained multiple measurements of the early-time optical polarization light curve of GRB 120308A, making this the first measurement of the temporal evolution of the early-time polarized optical afterglow emission. They began observing the GRB afterglow 240 s after the GRB trigger and monitored it for min, during which time the fractional polarization dropped from % to %.
2 RoboPol observations of GRB 131030A
The RoboPol project operates a four-channel imaging polarimeter on the 1.3 m telescope at the Skinakas Observatory in Crete, Greece11 1 http://skinakas.physics.uoc.gr/. The RoboPol instrument measures the Stokes parameters , , and , simultaneously in a single exposure. It is used to monitor the optical linear polarization of blazars (Pavlidou et al., 2014), and observations are performed by an automated control system (King et al., 2014) that is capable of responding to target-of-opportunity (TOO) events such as GRBs.
At 20:56:18 UT on 2013 October 30 the Swift Burst Alert Telescope (BAT, Barthelmy 2004) triggered and located GRB 131030A. The afterglow was located at 23h00’16.13”, 05∘22’05.1’’ (J2000) by the Swift Ultraviolet/Optical Telescope (UVOT, GCN#1540222 2 http://gcn.gsfc.nasa.gov/gcn3/15402.gcn3). The duration over which 90 % of the 15 – 350 keV GRB photons were collected, , was s and it had a fluence in the 15 – 150 keV band of erg cm-2 (GCN#1545633 3 http://gcn.gsfc.nasa.gov/gcn3/15456.gcn3). The GRB occurred at a redshift of 1.293 -- 1.295 (GCN#1540744 4 http://gcn.gsfc.nasa.gov/gcn3/15407.gcn3 and GCN#1540855 5 http://gcn.gsfc.nasa.gov/gcn3/15408.gcn3) and had an isotropic energy release of erg (GCN#1541366 6 http://gcn.gsfc.nasa.gov/gcn3/15413.gcn3).
The RoboPol control system automatically responded to the GRB notification by interrupting the regular observing schedule and slewing to the location of the GRB afterglow. The telescope operator identified the afterglow and began taking exposures in the Johnson-Cousins -band at 2013 October 10 21:07:13 UT, 655 s after the GRB trigger. We continued monitoring the GRB afterglow in a series of exposures until it set below our observing horizon about 2 h after the GRB, adjusting the exposure time as the afterglow faded. A typical image from the series of RoboPol exposures is shown in Figure 1.
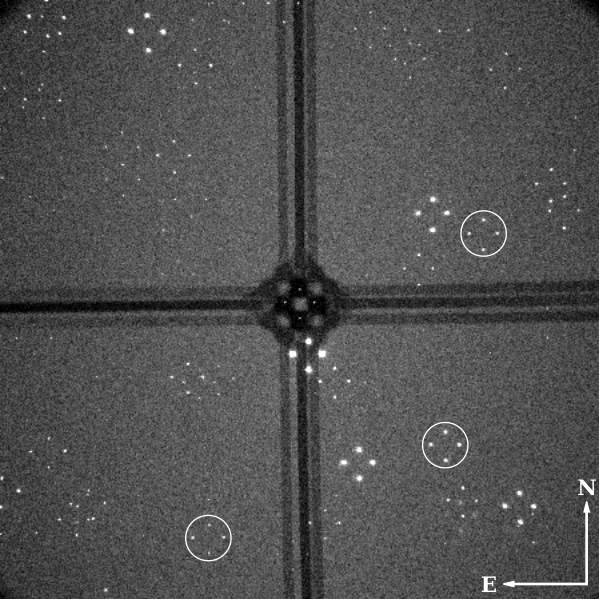
The data were reduced using both the Aperture Photometry Tool (Laher et al., 2012) and the RoboPol pipeline (King et al., 2014), and were calibrated using the RoboPol instrument model. Relative photometry was performed using three field sources (circled in Figure 1), with -band magnitudes taken from the USNO-B1.0 photometric catalog (Monet et al., 2003). The measurements from each exposure are given in Table 1.
| min | s | % | deg | mag | |||
|---|---|---|---|---|---|---|---|
| 11.25 | 20 | 2.25 | 1.65 | 31.3 | 20.6 | 15.94 | 0.08 |
| 12.33 | 20 | 1.65 | 1.72 | 26.2 | 29.8 | 15.97 | 0.08 |
| 13.22 | 20 | 1.36 | 1.80 | 129.7 | 36.4 | 16.05 | 0.08 |
| 13.72 | 20 | 4.12 | 1.82 | 29.6 | 12.4 | 16.09 | 0.08 |
| 14.23 | 20 | 1.38 | 1.85 | 173.7 | 38.0 | 16.12 | 0.07 |
| 14.73 | 20 | 1.79 | 1.89 | 19.1 | 30.3 | 16.15 | 0.08 |
| 15.28 | 20 | 2.63 | 1.91 | 22.5 | 20.8 | 16.16 | 0.07 |
| 15.78 | 20 | 2.98 | 1.96 | 167.1 | 18.7 | 16.22 | 0.08 |
| 16.30 | 20 | 3.86 | 1.94 | 19.0 | 14.4 | 16.20 | 0.07 |
| 18.78 | 120 | 1.96 | 0.80 | 38.8 | 11.2 | 16.38 | 0.07 |
| 21.17 | 120 | 2.20 | 0.85 | 35.4 | 10.9 | 16.51 | 0.07 |
| 23.77 | 120 | 2.40 | 0.92 | 24.8 | 10.8 | 16.62 | 0.07 |
| 26.48 | 120 | 2.71 | 0.97 | 15.8 | 10.4 | 16.75 | 0.07 |
| 29.17 | 120 | 1.56 | 1.04 | 22.0 | 19.1 | 16.87 | 0.08 |
| 31.50 | 120 | 2.32 | 1.10 | 27.5 | 13.4 | 16.94 | 0.07 |
| 34.22 | 120 | 1.74 | 1.16 | 26.2 | 19.1 | 17.06 | 0.07 |
| 36.93 | 120 | 3.25 | 1.24 | 36.9 | 10.5 | 17.16 | 0.07 |
| 39.65 | 120 | 2.64 | 1.33 | 16.2 | 14.7 | 17.32 | 0.07 |
| 42.37 | 120 | 2.21 | 1.38 | 20.5 | 17.8 | 17.39 | 0.07 |
| 45.03 | 120 | 4.55 | 1.48 | 22.1 | 9.3 | 17.45 | 0.08 |
| 48.77 | 180 | 2.73 | 1.29 | 31.7 | 13.0 | 17.55 | 0.07 |
| 52.02 | 180 | 2.11 | 1.32 | 43.4 | 16.5 | 17.53 | 0.07 |
| 55.52 | 180 | 2.85 | 1.41 | 36.6 | 13.2 | 17.65 | 0.07 |
| 59.23 | 180 | 2.78 | 1.42 | 21.5 | 14.5 | 17.69 | 0.07 |
| 65.82 | 180 | 2.86 | 1.42 | 22.0 | 14.2 | 17.72 | 0.08 |
| 69.47 | 180 | 3.72 | 1.57 | 19.7 | 12.2 | 17.84 | 0.08 |
| 73.00 | 180 | 2.06 | 1.54 | 28.7 | 20.3 | 17.68 | 0.08 |
| 76.20 | 180 | 2.23 | 1.58 | 55.4 | 19.1 | 17.71 | 0.08 |
| 82.63 | 180 | 3.02 | 1.66 | 37.0 | 14.1 | 17.79 | 0.07 |
| 86.33 | 180 | 0.92 | 1.60 | 57.2 | 48.4 | 17.79 | 0.08 |
| 93.73 | 180 | 3.56 | 1.82 | 43.8 | 13.7 | 17.90 | 0.08 |
| 96.93 | 180 | 3.29 | 1.86 | 39.7 | 14.6 | 17.92 | 0.08 |
| 100.70 | 180 | 2.21 | 1.83 | 5.4 | 24.9 | 17.92 | 0.08 |
| 104.18 | 180 | 1.95 | 1.96 | 18.9 | 29.1 | 18.09 | 0.08 |
| 107.57 | 180 | 4.62 | 2.17 | 44.1 | 11.9 | 18.10 | 0.08 |
| 114.73 | 180 | 1.25 | 2.11 | 79.3 | 53.9 | 18.12 | 0.08 |
| 118.17 | 180 | 3.61 | 2.24 | 20.4 | 17.7 | 18.27 | 0.08 |
| 121.90 | 180 | 1.99 | 2.40 | 130.4 | 28.8 | 18.12 | 0.08 |
The linearly polarized light curve for the GRB afterglow is shown in Figure 2. The polarization measurements have not been debiased, as most data points have , the threshold at which debiasing is usually applied (Pavlidou et al., 2014). The linear polarization behavior of the afterglow appears to remain constant throughout the 2 hour observing period. The mean polarization percentage from our data is , and the mean polarization angle is .
3 Is the polarization intrinsic?
The measured polarization of the GRB might be due to interstellar extinction in our Galaxy. We can estimate the expected level of induced polarization in the direction of the GRB from the level of Galactic extinction using the standard empirical relation from Serkowski, Mathewson & Ford (1975). According to the NASA Extragalactic Database the extinction in the direction of the GRB is and , which gives mag (Schlafly & Finkbeiner, 2011). The resulting level of stellar polarization is , i.e., %, though this method is approximate.
To obtain a more accurate estimate of the scale of the interstellar scattering effect we measured the linear polarization of four field stars around GRB 131030A in a separate series of exposures. We show in Figure 3 a polarization vector map of the GRB and the field sources. The mean polarization fraction for the field sources is , and the polarization vectors are well-aligned, indicating an ordered magnetic field in the absorbing interstellar medium (ISM).
The high level of polarization of the field sources around GRB 131030A implies that the measured polarization is dominated by interstellar extinction rather than the intrinsic polarization of the GRB afterglow.
4 Interpretation
The GRB occurred at a redshift of 1.294, so in the rest-frame we started observing s after the GRB event, which corresponds to about . This is about 3–5 times longer than the time when the 5 early-time optical polarimetric observations we mention in the Introduction started; Table 2 summarizes these data.
| Name | (s) | (s) | Polarization | Interpretation |
|---|---|---|---|---|
| GRB 120308A (Mundell et al., 2013) | 90 | 135 | Reverse shock | |
| GRB 090102 (Steele et al., 2009) | 63 | 24 | Reverse shock | |
| GRB 110205A (Cucchiara et al., 2011) | 76 | ? | Reverse shock | |
| GRB 060418 (Mundell et al., 2007) | 82 | 12 | () | Both |
| GRB 091208B (Uehara et al., 2012) | 72 | 551 | Forward shock | |
| GRB 131030A (this work) | 285 | 2894 | Forward shock |
The X-ray Telescope (XRT; Burrows et al. 2005) started observing the GRB field 78.4 s77 7 http://gcn.gsfc.nasa.gov/gcn3/15402.gcn3 after the trigger. The XRT light curve88 8 http://www.swift.ac.uk/xrt_curves/00576238/flux.qdp is shown in Figure 4. At early times, the X-ray light curve brightens until s (rest frame) after the burst, and then the X-ray afterglow decays steeply until s. At later times, coincident with the RoboPol observations, the X-ray light curve declines as a single power law . The RoboPol optical light curve is also plotted in Figure 4. The optical flux declines also as a single power law (we have included in the optical band light curve later -band photometry from GCN circulars #1541899 9 http://gcn.gsfc.nasa.gov/gcn3/15418.gcn3 and #154231010 10 http://gcn.gsfc.nasa.gov/gcn3/15423.gcn3).
Since we observe a single, power-law decline from up to min (rest-frame) after the burst, both in the optical and X-rays, the simplest explanation is that a single emitting component is responsible for the observed emission in both bands. This is most probably the forward shock propagating in the external medium, and we observe the synchrotron emission from this shock. The X-ray decline is consistent with the fast-cooling afterglow from a shock that has a power-law distribution of electron energies with a spectral index of (, Granot & Sari 2002). If the GRB ambient density profile is similar to the ISM we would expect an optical light curve that evolves as while in an environment with a stellar-wind density profile the light curve would evolve as . The measured optical power-law index of implies that the medium surrounding the GRB has a constant density with a profile similar to the ISM. The blast decelerates in a constant density medium and the cooling synchrotron break is between the optical and the X-ray bands min after the burst. The observed flux in the X-ray and optical bands is consistent with this model if a fraction of the dissipated energy goes into non-thermal electrons, a fraction goes into amplifying the magnetic field while the ambient density of the circumburst material is cm-3. These values are similar to those inferred in other bursts (e.g., Santana, Barniol Duran & Kumar 2014).
In general, the GRB afterglow emission is believed to consist mainly of the reverse and forward shock emission and other possible components (such as radiation related to jet reactivation). The reverse shock emission may dominate at early times, i.e., comparable, or a few times longer that the duration of the burst (Kobayashi, Piran & Sari, 1999; Mimica, Giannios & Aloy, 2009; Mimica, Giannios & Aloy, 2010) and may be strongly polarized, as in Mundell et al. (2013); Steele et al. (2009). At later times, the forward shock is the primary candidate for emission, and its polarization may be much weaker as observed by Mundell et al. (2007). Our results support this view, indicating a disordered magnetic field in the shock front as it propagates through the ambient medium around GRB 131030A.
This result supports suggestions that the magnetic field is amplified by plasma instabilities on the shock front, which would produce strong magnetic fields with random directions, on scales much smaller than the total observable region of the shock (Medvedev & Loeb, 1999). On the other hand, Uehara et al. (2012) observed a strong polarization signal of from the early afterglow of GRB 091208B, when the observed emission was also dominated by the forward shock emission. Their observation started s after the burst, and lasted for s (in the source rest frame). They measured an -band flux decaying as , with the X-ray flux initially decaying as and later steepening to . The first s of our observations overlap with the end of their observations in rest-frame time, during which time both the optical and X-ray light curve decay rates are very similar. Therefore, if the same mechanism operates in all GRBs, then a very fast decline in optical polarization must take place, indicating a fast change in the mechanism that amplifies the strong magnetic fields in the jet of these sources. On the other hand, these mechanisms may not be the same in all GRBs. More optical polarization data from different GRBs, and on long time scales, are needed in order to understand better the magnetic field structure in GRBs.
Acknowledgments
The RoboPol project is a collaboration between Caltech in the USA, MPIfR in Germany, Toruń Centre for Astronomy in Poland, the University of Crete/FORTH in Greece, and IUCAA in India. The U. of Crete group acknowledges support by the “RoboPol” project, which is implemented under the “Aristeia” Action of the “Operational Programme Education and Lifelong Learning” and is co-funded by the European Social Fund (ESF) and Greek National Resources, and by the European Comission Seventh Framework Programme (FP7) through grants PCIG10-GA-2011-304001 “JetPop” and PIRSES-GA-2012-31578 “EuroCal”. This research was supported in part by NASA grant NNX11A043G and NSF grant AST-1109911, and by the Polish National Science Centre, grant number 2011/01/B/ST9/04618. K. T. acknowledges support by the European Commission Seventh Framework Programme (FP7) through the Marie Curie Career Integration Grant PCIG-GA-2011-293531 “SFOnset”. M. B. acknowledges support from the International Fulbright Science and Technology Award. I. M. and S. K. are supported for this research through a stipend from the International Max Planck Research School (IMPRS) for Astronomy and Astrophysics at the Universities of Bonn and Cologne. T. H. was supported by the Academy of Finland project number 267324.
This research made use of Astropy, http://www.astropy.org, a community-developed core Python package for Astronomy (Astropy Collaboration et al., 2013).
This research has made use of the NASA/IPAC Extragalactic Database (NED) which is operated by the Jet Propulsion Laboratory, California Institute of Technology, under contract with the National Aeronautics and Space Administration.
References
- Astropy Collaboration et al. (2013) Astropy Collaboration et al., 2013, A&A, 558, A33, arXiv:1307.6212, doi:10.1051/0004-6361/201322068
- Barthelmy (2004) Barthelmy S. D., 2004, in Flanagan K. A., Siegmund O. H. W., eds, Society of Photo-Optical Instrumentation Engineers (SPIE) Conference Series Vol. 5165, X-Ray and Gamma-Ray Instrumentation for Astronomy XIII. pp 175–189, doi:10.1117/12.506779
- Burrows et al. (2005) Burrows D. N. et al., 2005, SSRv, 120, 165, arXiv:astro-ph/0508071, doi:10.1007/s11214-005-5097-2
- Cucchiara et al. (2011) Cucchiara A. et al., 2011, ApJ, 743, 154, arXiv:1107.3352, doi:10.1088/0004-637X/743/2/154
- Granot & Königl (2003) Granot J., Königl A., 2003, ApJL, 594, L83, arXiv:astro-ph/0304286, doi:10.1086/378733
- Granot & Sari (2002) Granot J., Sari R., 2002, ApJ, 568, 820, arXiv:astro-ph/0108027, doi:10.1086/338966
- King et al. (2014) King O. G. et al., 2014, MNRAS, 442, 1706, arXiv:1310.7555, doi:10.1093/mnras/stu176
- Kobayashi et al. (1999) Kobayashi S., Piran T., Sari R., 1999, ApJ, 513, 669, arXiv:astro-ph/9803217, doi:10.1086/306868
- Laher et al. (2012) Laher R. R., Gorjian V., Rebull L. M., Masci F. J., Fowler J. W., Helou G., Kulkarni S. R., Law N. M., 2012, PASP, 124, 737, doi:10.1086/666883
- Lazzati et al. (2004) Lazzati D. et al., 2004, A&A, 422, 121, arXiv:astro-ph/0401315, doi:10.1051/0004-6361:20035951
- Lyutikov (2003) Lyutikov M., 2003, MNRAS, 346, 540, arXiv:astro-ph/0303384, doi:10.1046/j.1365-2966.2003.07110.x
- Medvedev & Loeb (1999) Medvedev M. V., Loeb A., 1999, ApJ, 526, 697, arXiv:astro-ph/9904363, doi:10.1086/308038
- Mimica et al. (2009) Mimica P., Giannios D., Aloy M. A., 2009, A&A, 494, 879, arXiv:0810.2961, doi:10.1051/0004-6361:200810756
- Mimica et al. (2010) Mimica P., Giannios D., Aloy M. A., 2010, MNRAS, 407, 2501, arXiv:1004.2720, doi:10.1111/j.1365-2966.2010.17071.x
- Monet et al. (2003) Monet D. G. et al., 2003, AJ, 125, 984, arXiv:astro-ph/0210694, doi:10.1086/345888
- Mundell et al. (2007) Mundell C. G. et al., 2007, Science, 315, 1822, arXiv:astro-ph/0703654, doi:10.1126/science.1138484
- Mundell et al. (2013) Mundell C. G. et al., 2013, Nature, 504, 119, doi:10.1038/nature12814
- Pavlidou et al. (2014) Pavlidou V. et al., 2014, MNRAS, 442, 1693, arXiv:1311.3304, doi:10.1093/mnras/stu904
- Piran (1999) Piran T., 1999, Phys. Rep., 314, 575, arXiv:astro-ph/9810256, doi:10.1016/S0370-1573(98)00127-6
- Santana et al. (2014) Santana R., Barniol Duran R., Kumar P., 2014, ApJ, 785, 29, arXiv:1309.3277, doi:10.1088/0004-637X/785/1/29
- Schlafly & Finkbeiner (2011) Schlafly E. F., Finkbeiner D. P., 2011, ApJ, 737, 103, arXiv:1012.4804, doi:10.1088/0004-637X/737/2/103
- Serkowski et al. (1975) Serkowski K., Mathewson D. S., Ford V. L., 1975, ApJ, 196, 261, doi:10.1086/153410
- Steele et al. (2009) Steele I. A., Mundell C. G., Smith R. J., Kobayashi S., Guidorzi C., 2009, Nature, 462, 767, arXiv:1010.1255, doi:10.1038/nature08590
- Uehara et al. (2012) Uehara T. et al., 2012, ApJL, 752, L6, arXiv:1205.2149, doi:10.1088/2041-8205/752/1/L6
- Zhang et al. (2003) Zhang B., Kobayashi S., Mészáros P., 2003, ApJ, 595, 950, arXiv:astro-ph/0302525, doi:10.1086/377363