Anomalous High-Energy Electronic Interaction in Iron-Based Superconductor
Abstract
Strong electron interactions in solids increase effective mass, and shrink the electronic bands [1]. One of the most unique and robust experimental facts about iron-based superconductors [2, 3, 4] is the renormalization of the conduction band by factor of 3 near the Fermi level [5, 6, 7, 8, 9]. Obviously related to superconductivity, this unusual behaviour remains unexplained. Here, by studying the momentum-resolved spectrum of the whole valence band in a representative material, we show that this phenomenon originates from electronic interaction on a much larger energy scale. We observe an abrupt depletion of the spectral weight in the middle of the Fe band, which is accompanied by a drastic increase of the scattering rate. Remarkably, all spectral anomalies including the low-energy renormalization can be explained by coupling to excitations, strongly peaked at about 0.5 eV. Such high-energy interaction distinguishes all unconventional superconductors from common metals.

I Main
There is a fundamental problem in the condensed matter physics: Hamiltonian of any solid is extremely complicated due to large amount of involved particles — all electrons move around and act on each other. It is actually not trivial that one-electron local density approximation (LDA) gives astonishingly accurate predictions for the electronic properties of vast majority of common materials [10, 11, 12]. On the other hand, for many compounds that are currently under scrutiny of modern condensed matter physics the one-electron approach spectacularly fails, especially for those with potentially useful extraordinary properties [13, 14]. One recent example is the class of iron-based high-temperature superconductors [2, 3, 4], where numerous experimental techniques have established that the distribution of the electronic states at the Fermi level is compressed in energy three and more times as compared to the LDA predictions [5, 6, 7, 8, 9]. Since there are many candidates, not accounted for by the LDA approximation, which could lead to the renormalization at low energies and very little is known experimentally about the nature of the force capable of triple band squeezing, the problem remains unsolved. In this work we apply angle-resolved photoemission spectroscopy (ARPES) to study the electronic structure of superconducting NaFeAs covering much larger interval of binding energies than it is usually done, and show that not only electronic states at the Fermi level are renormalized, but the whole structure of the iron band is changed with respect to LDA by a strong interaction of a particular energy scale.
In Fig. 1 we compare the ARPES spectra recorded along the high symmetry directions in a broad energy range with corresponding results of the LDA band structure calculations for NaFeAs compound. At the bottom of the valence band, between 2 and 5 eV binding energies (), the photoemission intensity closely follows the calculated dispersions which correspond to the -bands of arsenic. In this region there are well defined dispersion features with moderate broadening and no appreciable renormalization, implying very good agreement with theory. Near eV, where the bottom of the iron -band is located, we observe the features with significantly larger scattering, but still noticeable dispersion and energy position similar to the original non-renormalized LDA bands. Comparison of the dispersions at even lower binding energies demonstrates that the experimental features change rapidly from smeared out and weakly defined to intense and well-discernible when going from 500 meV to 0. It is clearly seen, that they are located much closer to the Fermi level than the calculations predict (compare Fig. 1(b,f) with Fig. 1(c,g) respectively). In some spectra one is able to see a kink in the dispersion at about 500 meV [Fig. 1(c,g,h)]. A more detailed identification of the dispersive bands in the photoemission signal with the band calculation in the vicinity of the Fermi level is presented in the Supplementary Materials; basic result of such matching is that experimental bands at low binding energies are the ones predicted by LDA, but renormalized by average factor of 3.
To ensure the generality of this observation we show in Fig. 2 ARPES data taken using the light of different photon energies and polarizations. The data were recorded along various directions in the Brillouin zone. All mentioned above characteristics of the spectral weight distribution are universally present in all data sets, implying that the effect does not have a distinct momentum dependence. In addition, one can notice another common feature for the data presented in Fig. 2. It is a pronounced depletion of the spectral weight around eV [Fig. 1(a)]. This stripe-like intensity suppression is highlighted by the dark ribbon running through all the panels of Fig. 2. It is this feature which marks the border between the region of clearly dispersing sharp band contours and the region with strong electron scattering.
Next we try to understand the origin of the above described anomalies and deviations from the one-electron picture. For a start we employ rather simple model where electrons of original LDA bands interact with a hypothetical bosonic spectrum according to the Eliashberg formalism [15]. Within this approach the self energy which encapsulates the many-body effects of electronic interactions is defined by the following formulas: , , where is the self energy, and is the Eliashberg function.

In Fig. 3 we compare the calculated spectral function with experimental energy-momentum distribution of the photoemission intensity. The bosonic spectrum, , was assumed to be of a simplest single-peak form. In Supplementary Materials we present a convenient analytic form for , allowing for explicit integration of the expressions for and . To make the comparison more transparent, the experimental conditions were chosen in such a way that photoemission matrix elements highlight one of the bands, while all others are suppressed. The model captures many important features seen in the experimental spectra. First of all, these are the sharp and strongly renormalized dispersions close to the Fermi level. The fast increase of the electronic scattering rate with binding energy at a correct energy scale is reproduced too — well-defined dispersions vanish below 0.5 eV. Finally, smeared out spectral weight is also distributed around the contours of bare dispersion. The observed broadening of arsenic bands can be accounted by the model too, provided one assumes that arsenic bands interact with the same bosonic spectrum with roughly four times weaker coupling in comparison with the one for iron bands. This result clearly implies that combining the LDA calculations with the simple treatment of the electron-boson interaction satisfactory reproduces the experimental spectral function of the whole valence band on the energy scale of up to 6 eV. Obviously, “boson” does not necessarily mean here a particular external bosonic excitation — it could well be just a convenient representation of purely electron-electron interactions, and it remains an open question whether corresponding bosonic excitations can be singled out.
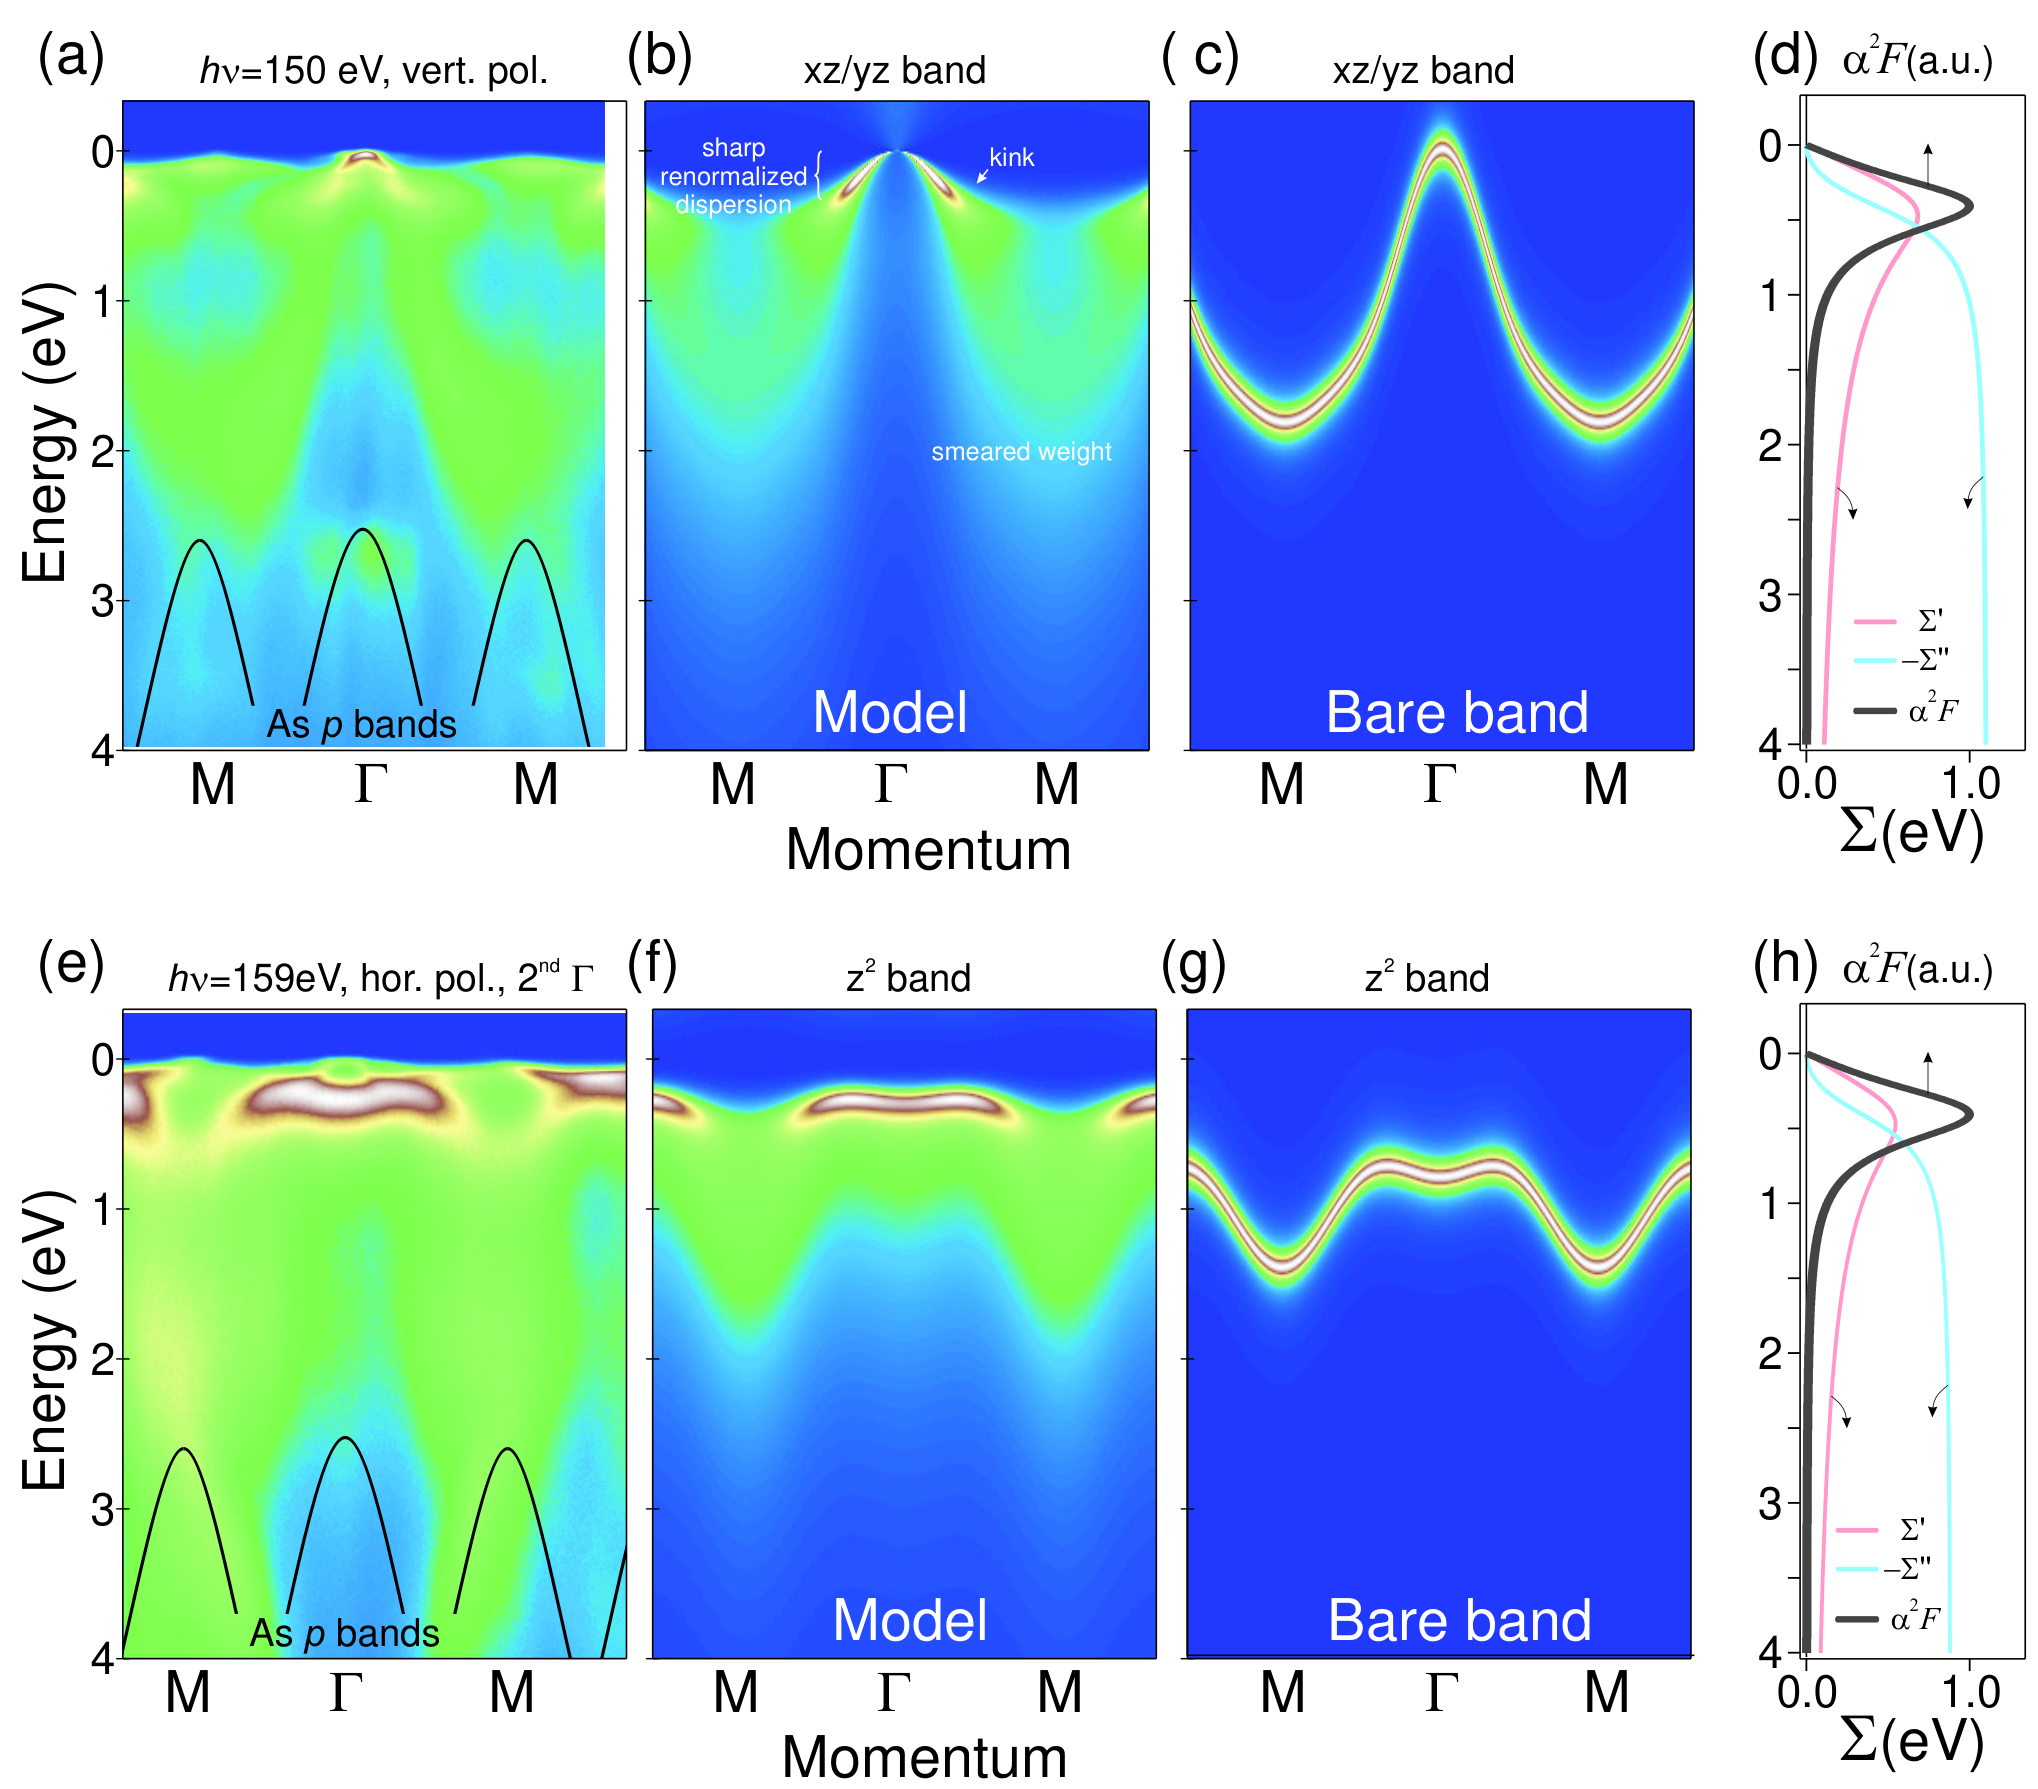
One may notice that the experimental spectral function [Fig. 3 (a), (c)] slightly deviates from the model in the region between 1.5 and 2 eV: the contours of the smeared spectral weight distribution are somewhat below the original bare bands and electronic scattering at the bottoms of these bands is somewhat lower. Both these discrepancies can be removed by allowing a decrease of the scattering rate [blue curve in Fig. 3(e)] after it passes the maximum at binding energy of 0.5–1 eV, which would cause a simultaneous change of sign of the real part of the self-energy [red curve in Fig. 3(e)]. Interestingly, same effect is observed when one describes the spectra of the cuprates, ruthenates, and vanadates using the self-energy formalism [16, 17, 18]. Within the utilized here model such behavior of the self-energy would necessarily imply that the bosonic spectrum becomes negative starting from a particular energy. This situation is directly related to the features in the spectral function, calculated for strongly correlated electronic systems [14, 19, 20, 21, 22]. Taken together, it means that while the intensity distribution corresponding to Fe band, as it appears in iron pnictides and chalcogenides, can be described by weak-coupling equations surprisingly adequate, at the same time it inherits some signatures peculiar to the strong-coupling approach. Taking into account that the coupling strength used in the model matching the experiment [Fig. 3] is around 2, we arrive at the conclusion that iron-based superconductors are essentially in the intermediate coupling regime.

Observation of high-energy anomalies in the experimental spectral function such as a kink in dispersion [Fig. 1,3] and stripe of intensity depletion [Fig. 2] as well as the possibility to track intensity variations at the contours of original LDA bands allow us to determine the Eliashberg function rather precisely. What could be the physical nature of the introduced effective bosonic spectrum ? Phononic origin can be ruled out, as the typical energies of phononic modes have more than order of magnitude lower energy [23, 24, 25]. One of the obvious candidates would be the spin-fluctuation spectrum, as strong electron coupling to the spin resonance mode below , has been detected for several iron-based superconductors. However, the spin-fluctuation spectrum has maximum at about 200 meV, and does not extend as high as 500 meV [26, 27]. Consequently, although both spin fluctuations and phonons certainly make contribution to the band renormalization at lower binding energies, they cannot be a source of the discussed here high-energy anomalies and band renormalization on the largest energy scale of band. Among other theoretically considered possibilities the Coulomb interaction in the forms of (i) well-known on-site repulsion and (ii) recently proposed to be important in iron-based superconductors Hund’s coupling [28, 30, 29] are reasonable candidates for explanation of high-energy anomalies in the electronic spectrum. More theoretical work is obviously needed to understand the origin and details of the introduced here anomalous strong high-energy interaction.
It is instructive to recall that most of electronic systems are “normal” — their spectra do not exhibit such strong anomalies and departure from LDA. We show ARPES spectra for a number of renown materials in the Fig. 4 (a). The band dispersion can be traced down to 5 eV binding energy and even deeper, and the agreement with LDA including the energy bandwidth is nearly perfect. A good intuitive quantity for illustration of electronic interaction strength is the scattering rate . A plot of binding energy dependence for several materials is adduced in the panel (b) of Fig. 4. There is a drastically different behaviour of the scattering rates for groups of materials with strongly- and weakly-interacting electrons.
Certainly, the most interesting question is what is the relation of the discussed above large-scale electronic interaction to the electron pairing? It is a priori clear that the introduced effective bosonic spectrum can hardly be considered as a pairing interaction in a conventional sense. Moreover if one makes an attempt to estimate the with the parameters of the extracted spectrum,, eV, than with original BCS formula one arrives at K, and at 970 K with McMillan’s expression [31] — as expected one gets way too high values. On the other hand, there is a rather clear hint for importance of such electronic interactions for high-temperature superconductivity: it is present in all studied high- superconductors. Finally, there is a number of materials isostructural to iron arsenides which were synthesized with complete substitution of one or more elements, e.g. BaCo2As2 [32], BaNi2As2 [33], SrPd2Ge2 [34]. In all of these materials superconductivity is either absent, or is low and superconductivity is believed to be of conventional phonon origin. Remarkably, the peculiar to iron-based superconductors band renormalization at the Fermi level in all these materials is not observed. Thus, there is strong empirical indication for strong electronic interactions on the energy scale of the whole band to be a necessary requisite for unconventional high-temperature superconductivity.
II Methods
ARPES measurements were carried out with -ARPES end station at BESSY II synchrotron in Berlin (Helmholtz-Zentrum für Materialien und Energie) on the in-situ cleaved single crystals of NaFeAs with 1.8% of rhodium doping in iron site. The samples were cleaved at temperature around 20 K, exhibiting shiny flat homogeneous surface. The utilized photon energies are provided in the figures. Band structure calculations were performed using the linear muffin-tin orbital method.
III Acknowledgments
We thank I. Nekrasov, A. Boris, S. Aswartham, A. Charnukha and D. Inosov for helpful discussions, and to R. Hübel and M. Naumann for technical support. The work was supported under grants No. BO1912/2-2, BE1749/13, NAS of Ukraine (project 73-02-14) and WU595/3-1.
IV Contributions
D.E., V.Z., J.M., T.K., A.K. and S.B. performed ARPES measurements, A.Y. performed LDA calculations, M.V. calculated the model spectral function, M.R, I.M., R.B., S.W. and H.B. have grown the samples, S.B. and B.B. coordinated the project.
References
- [1] G. Grimvall, Phys. Scr. 14, 63 (1976).
- [2] Y. Kamihara, T. Watanabe, M. Hirano, H. Hosono, J. Am. Chem. Soc. 11, 3296 (2008).
- [3] G. R. Stewart, Rev. Mod. Phys. 83, 1589 (2011).
- [4] Johnpierre Paglione and Richard L. Greene, Nat. Phys. 6, 645 (2010).
- [5] P. Popovich et al., Phys. Rev. Lett. 105, 027003 (2010).
- [6] S. Borisenko et al., Phys. Rev. Lett. 105, 067002 (2010).
- [7] H. Ding et al., Condens. Matter 23, 135701 (2011).
- [8] S. T. Cui et al., Phys. Rev. B 86, 155143 (2012).
- [9] D. V. Evtushinsky et al., Phys. Rev. B89, 064514 (2014).
- [10] R. O. Jones and O. Gunnarsson, Rev. Mod. Phys. 61, 689 (1989).
- [11] M. C. Payne et al., Rev. Mod. Phys. 64, 10451097 (1992).
- [12] W. W. Schulz, P. B. Allen, and N. Trivedi, Phys. Rev. B 45, 10886 (1992).
- [13] Elbio Dagotto, Rev. Mod. Phys. 66, 736 (1994).
- [14] M. Imada, A. Fujimori, and Y. Tokura, Rev. Mod. Phys. 70, 1039 (1998).
- [15] A. B. Migdal, Sov. Phys. JETP 34, 996 (1958).
- [16] W. Meevasana et al., Phys. Rev. B75, 174506 (2007).
- [17] H. Iwasawa et al., Phys. Rev. Lett. 109, 066404 (2012).
- [18] S. Aizaki et al., Phys. Rev. Lett. 109, 056401 (2012).
- [19] A. Georges, G. Kotliar, W. Krauth and M. J. Rozenberg, Rev. Mod. Phys. 68, 13 (1996).
- [20] K. Held, Advances in Physics 56,829 (2007).
- [21] A. Macridin, M. Jarrell, T. Maier, and D. J. Scalapino, Phys. Rev. Lett. 99, 237001 (2007).
- [22] R. S. Markiewicz, T. Das, S. Basak, A. Bansil, J. El. Spec. and Rel. Phen. 181, 23 (2010).
- [23] L. Boeri, O. V. Dolgov, A. A. Golubov, Physica C 469, 628 (2009).
- [24] T. Fukuda et. al., J. Phys. Soc. Jpn. 80, SB015 (2011).
- [25] Ch.-H. Lee et. al., J. Phys. Soc. Jpn. 79, 014714 (2010).
- [26] Pengcheng Dai, Jiangping Hu & Elbio Dagotto, Nature Physics 8, 709 (2012).
- [27] K.-J. Zhou et. al., Nature Communications 4, 1470 (2013).
- [28] M. Aichhorn et al., Phys. Rev. B80, 085101 (2009).
- [29] K. Haule and G. Kotliar, New J. Phys. 11, 025021 (2009).
- [30] J. Ferber, K. Foyevtsova, R. Valent´ý, and H. O. Jeschke, Phys. Rev. B85, 094505 (2012).
- [31] J. P. Carbotte, Rev. Mod. Phys. 62, 1027 (1990).
- [32] N. Xu et al., Physical Review X 3, 011006 (2013).
- [33] B. Zhou et al., Phys. Rev. B 83, 035110 (2011).
- [34] T. K. Kim et al., Phys. Rev. B85, 014520 (2012).