Post-merger evolution of carbon-oxygen + helium white dwarf binaries and the origin of R Coronae Borealis and extreme helium stars
Abstract
Orbital decay by gravitational-wave radiation will cause some close-binary white dwarfs (WDs) to merge within a Hubble time. The results from previous hydrodynamical WD-merger simulations have been used to guide calculations of the post-merger evolution of carbon-oxygen + helium (CO+He) WD binaries. Our models include the formation of a hot corona in addition to a Keplerian disk. We introduce a “destroyed-disk” model to simulate the effect of direct disk ingestion into the expanding envelope. These calculations indicate significant lifetimes in the domain of the rare R Coronae Borealis (RCB) stars, before a fast evolution through the domain of the hotter extreme helium (EHe) stars. Surface chemistries of the resulting giants are in partial agreement with the observed abundances of RCB and EHe stars. The production of , and are discussed. Evolutionary timescales combined with binary white-dwarf merger rates from binary-star population synthesis are consistent with present-day numbers of RCBs and EHes, provided that the majority come from relatively recent (Gyr) star formation. However, most RCBs should be produced by CO-WD + low-mass He-WD mergers, with the He-WD having a mass in the range . Whilst, previously, a high He-WD mass () was required to match the carbon-rich abundances of RCB stars, the “destroyed-disk” model yields a high-carbon product with He-WD mass , in better agreement with population synthesis results.
Keywords:
stars: peculiar (helium), stars: evolution, stars: white dwarfs, stars: abundances, binaries: close1 Introduction
R Coronae Borealis (R CrB or RCB) stars are carbon-rich, hydrogen-poor supergiants (Clayton, 1996). They range in effective temperature () from 4 000 to 8 000 K. The surface gravities range from to 1.5. Due to the ejection and condensation of carbon-rich dust clouds (soot), RCBs show large visible brightness variations. The RCB population in the Large Magellanic Cloud (LMC) provides estimates of absolute magnitudes which range from Mv 2.5 to 5 and corresponding luminosities of 4.0 to 3.2 (Alcock et al., 2001). At present, about 68 RCBs are known in the Galaxy, 25 in the Magellanic Clouds, and 4 in M31 (Clayton, 1996; Zaniewski et al., 2005; Tisserand et al., 2008; Clayton, 2012; Tang et al., 2013).
The surface compositions of RCB stars are extremely helium-rich (mass fraction 0.98). Besides extreme hydrogen deficiency, RCB stars are enriched in N, Al, Na, Si, S, Ni, several s-process elements, and sometimes O (Lambert, 1986; Asplund et al., 2000). The isotopic carbon ratio, , is very large () in most RCB stars (Clayton et al., 2007). In most RCB stars where oxygen isotopic ratios can be measured, is enhanced relative to by factors of 1001000 compared to standard Galactic values. In addition, some RCB stars are enhanced in lithium (Asplund et al., 2000).
Extreme Helium stars (EHe) are early-type supergiants with spectral types A and B and atmospheres almost void of hydrogen, but highly enriched in carbon (Jeffery et al., 2011). In many respects, their surface composition resembles that of the RCB stars, although isotopic ratios and the abundances of some interesting elements cannot be measured. Because of these similarities, a strong link between the cool RCB and the hot EHe stars has been postulated.
By considering these characteristics, two principle evolution channels have been established. A small fraction may be produced following a late thermal pulse in a post-asymptotic giant-branch star on the white dwarf cooling sequence (Iben & Renzini, 1984; Clayton et al., 2011). The majority are more likely to have been produced following the merger of a carbon-oxygen white dwarf with a helium white dwarf (Webbink, 1984; Saio & Jeffery, 2002; Jeffery et al., 2011; Longland et al., 2011; Staff et al., 2012; Menon et al., 2013; Dan et al., 2014). Less than 1% of RCB stars may come from a high-mass double helium white dwarf merger (Zhang & Jeffery, 2012a).
Using a simple nuclear reaction model, Clayton et al. (2007) indicated that in a CO+He WD merger, it is partial + burning at just the right temperature and duration that is the likely generator of excess (or a small / ratio). In addition, the high values of observed in RCB stars are probably produced by burning at the same time. Using complete nucleosynthesis models for asymptotic giant branch (AGB) stars as indicative of the composition of the CO white dwarf progenitor, Jeffery et al. (2011) examined the elements produced during a CO+He WD merger; the results supported such a merger as a possible progenitor of RCB stars. Smoothed-particle hydrodynamics (SPH) simulations have sought to probe the physics of the merger itself (Yoon et al., 2007; Lorén-Aguilar et al., 2009; Longland et al., 2012; Zhu et al., 2013). Those SPH simulations indicated that before the slow or ‘cool’ disk-accretion phase (Saio & Jeffery, 2002), there would have been a fast or ‘hot’ accretion phase. This fast phase may last between a few minutes (in unsynchronized systems) and a few hours (Raskin et al., 2012; Dan et al., 2011), during which approximately half the accreted mass would form a hot corona around the more massive star. Since none of the SPH calculations address the long-term post-merger evolution, and the Saio & Jeffery (2002) models did not incorporate a hot coronal phase, the picture of the post-merger evolution of a CO+He WD binary remains incomplete.
In this paper, we construct one-dimensional stellar evolution models for a number of dynamical CO+He WD mergers guided by the results of recent SPH calculations. These models are evolved through the RCB domain. The surface chemistries produced by the mergers and their subsequent evolution are compared with observations of RCB stars and related objects.
2 Carbon-oxygen + helium white dwarf mergers
There are two key requirements for a close binary white dwarf to merge and form a single star. The first is gravitational radiation whereby a close binary star system loses orbital angular momentum and causes the binary separation to decay until the larger star fills its Roche lobe. The rate of loss of orbital angular momentum (Landau & Lifshitz, 1962) is expressed as
where and are the masses of stars in the binary.
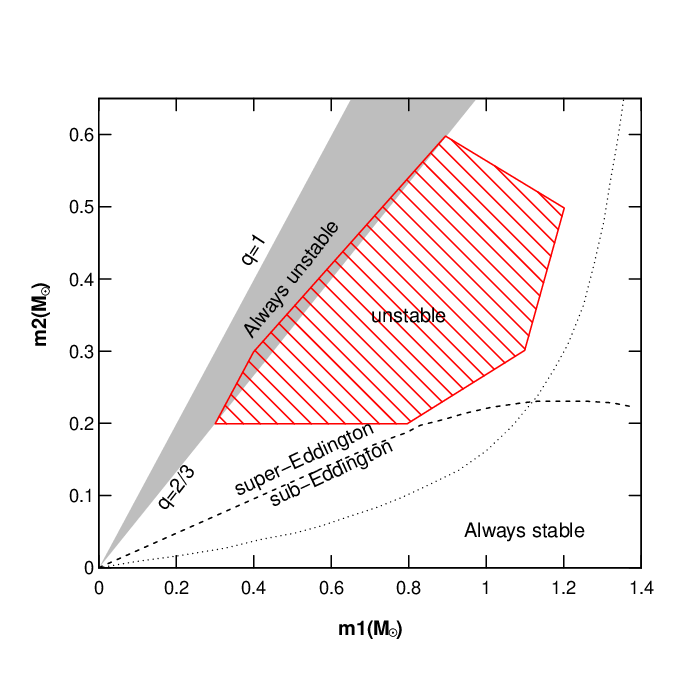

The second requirement is the mass ratio . If, at the point where the larger (less massive) white dwarf fills its Roche lobe and starts to lose mass,
where is obtained from the white-dwarf mass-radius relation, its radius will increase more quickly than the separation will increase due to the transfer of angular momentum, i.e. the synchronisation timescale of spin-orbit coupling, . This leads to unstable (runaway) mass transfer on a dynamical timescale (a few seconds), corresponding to the grey zone in Fig. 1. However, Nelemans et al. (2001) point out that there is a much more stringent condition under which no angular momentum is transferred from accretor to donor, i.e. the synchronisation timescale of spin-orbit coupling, . Under this condition, could decrease to 1/5, as shown by the dotted line in Fig. 1. If , stable mass transfer will occur, possibly leading to the formation of an AM CVn binary - an ultrashort binary system containing two helium white dwarfs. Thus, white dwarf binaries with mass ratios in the range will merge dynamically. In the region below the dotted line, mass transfer is always stable. The region between both zones corresponds to either stable or unstable mass transfer depending on the spin-orbit coupling (Marsh et al., 2004). The dashed line in Fig. 1 separates sub- and super-Eddington accretion. Under strong coupling, numerical simulations (Motl et al., 2007) indicate that results in stable mass transfer, leads to merger and tidal disruption of the donor, and for , the donor plunges into the accretor. Under weak coupling, the simulation of Dan et al. (2011) shows that some low mass-ratio binaries will be unstable and experience super-Eddington accretion (hatched zone of Fig. 1).
Hydrodynamical simulations of the merger of two low-mass white dwarfs suggest a number of phases occur. Following the complete tidal disruption of the lower mass component (secondary, ), its material may be redistributed around the more massive component (primary, ) in (a) a cold Keplerian debris disk and (b) a hot spherical corona. A disk allows cold mass to migrate towards its centre, from where it can be accreted slowly onto the primary surface, while angular momentum is dissipated towards the disk circumference (Lynden-Bell & Pringle, 1974). Fig. 2 shows a simplified sequence of events during a CO + He WD merger as suggested by hydrodynamical simulations. First, the He white dwarf is disrupted by the CO white dwarf in a few minutes, and forms a cold Keplerian debris disk and a hot spherical corona. Then, mass accretion starts from the disk to the star; this process may take around years. Once the accreted envelope is massive enough, stable helium-shell burning is ignited and the star becomes a cool giant. At large radius and low Teff, a stellar wind, pulsation and soot formation will give the star the characteristics of an R CrB variable. In addition, a number of RCB stars show nebular emission and extended low-temperature dust shells (Clayton, 1996). These are not seen in EHe stars. It is not yet clear whether this circumstellar material is related to the merger process or not.
| Model | |||||
|---|---|---|---|---|---|
| 1 | 0.50 | 0.40 | 0.23 | 0.17 | 0.90 |
| 2 | 0.50 | 0.45 | 0.31 | 0.14 | 0.95 |
| 3 | 0.55 | 0.35 | 0.15 | 0.20 | 0.90 |
| 4 | 0.55 | 0.40 | 0.20 | 0.20 | 0.95 |
| 5 | 0.55 | 0.45 | 0.25 | 0.20 | 1.00 |
| 6 | 0.60 | 0.30 | 0.10 | 0.20 | 0.90 |
| 7 | 0.60 | 0.35 | 0.12 | 0.23 | 0.95 |
| 8 | 0.60 | 0.40 | 0.16 | 0.24 | 1.00 |
3 Models
3.1 Numerical simulations
Numerical simulations of stellar evolution have been carried out using the stellar evolution code “Modules for Experiments in Stellar Astrophysics” (MESA) version 4028 (Paxton et al., 2011). Carbon-oxygen white-dwarf models were generated by evolving a 3 main-sequence star and removing the envelope when this reached the required mass (see Zhang & Jeffery (2012b) for details). The post-merger evolution was modeled by considering fast accretion at , representing the formation of a hot corona, followed by slow accretion at , representing accretion from a Keplerian disk. After the accretion process, we employ a Blöcker-type stellar wind of the form:
and
where the fundamental-mode pulsation period is approximated by
(Blöcker, 1995), and where we adopt two alternative values for the Reimers’ coefficient and 0.1. The value normally adopted for Galactic giants is 0.1. Adopting the smaller value of 0.02 makes some sense for C-rich giants, but the effect of hydrogen deficiency on the mass-loss efficiency is not at all known. The value 0.02 is in agreement with the luminosity and mass loss rates of some lithium and carbon-rich AGB stars in the Magellanic Clouds given by Ventura et al. (2000); Ventura et al. (2013), and used for the modelling the thermally-pulsing AGB phase (Lau et al., 2008). The composition of the accreted material is assumed to be , where the detailed metal abundance distribution is obtained from the average abundance of the He WD model. We set the ratio of mixing length to local pressure scale height, . The opacity tables for various metallicities are those compiled by Grevesse & Sauval (1998) and Ferguson et al. (2005). The default model atmosphere is an Eddington grey photosphere. The model resolution is determined by an adaptive grid in mass and an adaptive timestep. Nuclear burning is computed and applied explicitly for every timestep in the evolution calculation. Rotation is not treated in the version of MESA used. The evolution calculations do not yet follow the entire evolution through the EHe phase owing to to numerical instabilities associated with the very narrow helium-burning shell.
3.2 Hot corona and disk masses:
As Zhang & Jeffery (2012a); Zhang & Jeffery (2012b) discussed, the final surface composition of the merger depends strongly on the relative mass fractions in the hot corona and the disk. Zhu et al. (2013) studied a detailed parameter space for double carbon-oxygen white dwarf mergers with an SPH simulation, restricted to the systems without tidal locking. They give a formula for the masses of the accretor () and core-corona () as:
where is the central density ratio of the donor () and accretor (), . In the mass range of 0.4 to 1.0 , the central density depends approximately exponentially on mass,
where is in solar masses. As very little mass is ejected during the simulation (the merger is essentially conservative), the coronal mass is:
and
Although our calculations are for a CO+He WD merger, the masses are within the range of the Zhu et al. (2013) parameter space. We have therefore used this result to provide the coronal and disk masses in the eight models calculated for this paper and which are shown in Table 1.
Based on the corona-plus-disk model, a will be introduced in §7, in which the disk is assumed to be totally destroyed on a convective turnover timescale.


4 Evolution tracks
In the SPH simulations of white dwarf mergers, matter in the hot corona may, for some models, briefly reach temperatures of or more (Yoon et al., 2007; Lorén-Aguilar et al., 2009), so that some nucleosynthesis of -rich material will occur. For models comparable to those calculated here, Zhu et al. (2013) find peak temperatures K. Our one-dimensional quasi-equilibrium calculations indicate coronal temperatures up to for all models after the fast accretion phase (see details in Fig. 3). At these temperatures, the 3 and other alpha-capture reactions are ignited at the surface of the accretor almost immediately. Thus, carbon is produced by helium burning and nitrogen is destroyed by capture. As Warner (1967) and Clayton et al. (2007) indicated, the destruction of by the reaction becomes more efficient than it is at low temperature. As the temperature continues to increase, produces through an additional capture. Because of the high accretion rate, there is no runaway helium flash and burning is stable. Most of the energy released during this process goes into heating the corona.
After the fast-accretion phase, slow accretion transfers matter from the disk to the accretor, whilst inward heat conduction from the helium-burning shell continues to heat the CO core. Meanwhile, the star starts to expand to become a red giant. After the slow accretion phase, the temperature maximum decreases, and the width of the hot shell increases. An example of the temperature profile of model 4 (0.55+0.40 ) at two different epochs is shown in Fig. 4.
The location of convective regions during the accretion and post-merger phases of model 4 (0.55+0.40 ) is shown in Fig. 5. After the fast accretion phase, the increasing nuclear luminosity forces the star to expand; the radius becomes about 210 within 500 yrs. At this point, the envelope is almost fully convective, and helium-burning makes the corona rich in , and . The surface abundance of comes from the 3 reaction, which is very sensitive to temperature. However, during the (slow) disk-accretion phase the new ash of cannot reach the convection region, as shown in Fig. 5. Thus, all carbon enrichment occurs during the fast-accretion phase.
After the slow-accretion phase, the star becomes more luminous, and the mass-loss rate starts to become significant. The mass-loss rate depends on the Reimers’ coefficient, and will be discussed in the next section.
As the helium shell burns outwards through the accreted envelope, and the wind removes mass from the surface, the helium envelope is eventually not massive enough to sustain a helium-burning shell, and the shell luminosity starts to drop. To compensate, the envelope shrinks and the star evolves to become a white dwarf, evolving to higher Teff at constant luminosity. The evolution tracks for each model in the diagram are shown in Fig. 6.
The evolution calculations were terminated when the contracting star reached . This limit is currently imposed by numerical instabilities associated with the extremely narrow helium-burning shell and the algorithm used by MESA to select an appropriate timestep. Work to overcome this limitation is in progress.


5 Mass loss and dust formation
A carbon-rich dust environment is an important feature of RCB variables, the formation of which leads to the large visible brightness variations which are characteristic of the class. In our simulations, we assumed a Blöcker-type stellar wind (Blöcker, 1995), of the type usually used to represent mass loss in AGB stars. For the longest-lived phase of our models, this gave a mass-loss rate , which is comparable with observational estimates (Clayton, 2012). But this mass-loss rate is essentially determined by the Reimers’ coefficient which has been set to (see above). For , our model gave a mass-loss rate , and luminosity more than lower than the model. Details from the diagram for the 0.55+0.40 post-merger model are shown in Figs. 7 and 8, for and 0.1 respectively. The model loses 0.25 within yrs, and the model loses 0.3 within yrs. Both models show small random changes of luminosity during mass loss. We repeated the evolution calculation for 20 years of the model using different timesteps (Fig. 9). The small-amplitude variations did not repeat themselves identically (although still present), so we conclude that this ‘noise’ is principally numerical.
In view of the observational constraints on mass-loss rate and luminosity provided by the RCB stars, we chose for more detailed investigation. The evolution can be divided into two stages. During the first stage (A), the luminosity increases as the CO-core mass increases, with virtually no change in Teff. In the following 5000 yrs (stage B), where the star contracts at constant luminosity (see above), the mass loss rate reduces to , and the star loses a further 0.03 to give a final mass . We note that the mass is less than the estimate of from pulsation modeling (Saio & Jeffery, 2002; Saio, 2008), but that the mass-loss rate is higher than that estimated for EHe stars by Jeffery & Hamann (2010). If we assume a gas-to-dust ratio of 100 (Whittet, 2003; Clayton, 2012), we estimate that of dust would be produced during stage A ().


| Model | ||||||||
|---|---|---|---|---|---|---|---|---|
| 0.55+0.35 | -2.18 | -2.05 | -2.34 | -7.47 | -2.60 | -7.25 | 284 | 0.56 |
| 0.55+0.40 | -1.94 | -2.08 | -2.34 | -7.26 | -2.45 | -7.11 | 497 | 0.60 |
| 0.55+0.45 | -2.08 | -2.07 | -2.34 | -7.21 | -2.48 | -7.05 | 360 | 0.57 |
| 0.55+0.35 | -3.04 | -2.01 | -2.46 | -4.81 | -2.66 | -7.73 | 28 | 0.85 |
| 0.55+0.40 | -3.08 | -1.94 | -2.80 | -4.81 | -2,73 | -7.81 | 29 | 224 |
| 0.55+0.45 | -2.30 | -2.00 | -2.77 | -3.94 | -2.39 | -7.79 | 136 | 12 |
| Solar | -2.51 | -2.96 | -2.02 | -6.39 | -2.76 | -8.02 | 90 | 497 |
6 Surface Composition
Fig. 10 shows that most of the RCB stars lie around the part of the post-merger evolution corresponding to the final contraction phase (stage B). To compare with our simulations, data on the chemical composition of 17 RCB and 2 EHe stars with have been taken from the compilation by Jeffery et al. (2011), which, in turn, was based on measurements by Asplund et al. (2000) and Pandey et al. (2008). Data for Teff and surface gravities () of the same stars were taken from the latter two sources.


6.1 Individual elements
At the end of fast accretion and the beginning of slow accretion, flash-driven convection mixes throughout the envelope. During the subsequent slow-accretion phase, coronally-produced material is buried by C-poor material from the disk, so the new surface abundance very much depends on whereabouts in the star the disk material is deposited. In our simulations, which deposit disk material onto the surface of the accretor, only the models for a 0.55 CO white dwarf merger with a helium white dwarf can produce a carbon-rich surface; see Fig. 11 for details. All of the enrichment comes from the fast accretion phase as discussed above. The final carbon abundance depends on the peak temperature during accretion; in the models studied here, mergers onto a 0.55 CO white dwarf show the highest surface carbon. This appears counter-intuitive. However, because of the larger mass ratio, the 0.60 CO white dwarf accretes less mass during the fast merger phase, and hence the corona is cooler than in the 0.55 case (Fig. 3), leading to the production of less carbon.
Since we are concerned with the origin of the carbon-rich RCB stars, we focus our discussion on the three models producing most carbon, i.e. 0.55+0.35 , 0.55+0.40 and 0.55+0.45 . The principal surface abundances arising from these models are shown in Fig. 12 and Table 2.
Carbon
is enriched in all RCB stars. In those cool enough to show CO, the / ratios are very large (), indicating a or helium-burning origin for the carbon excess. In our models, was produced by helium burning through the reaction during the hot accretion phase, and then brought up to the surface during the slow-accretion phase by flash-driven convection. The abundance remained almost unchanged during the whole simulation. This enrichment of results in a very high ratio of /, being 284, 497, and 360 in our simulation for models for 0.55+0.35 , 0.55+0.40 and 0.55+0.45 , respectively. The total carbon, including and , shows an abundance similar to the observation (Fig. 12).
Nitrogen
is enriched in the RCB stars. Heber (1983) and subsequent authors point out that the N abundances in general follow the trend of the iron abundance. Nitrogen is enriched through CNO cycling in the parent stars. In our simulation, it is subsequently reduced by the reaction.
Oxygen
is enriched in most RCB stars. Clayton et al. (2007) report that, for four RCBs, has a large enrichment and shows a low ratio of close to unity. By comparison with the solar abundance, must have increased by a factor . Clayton et al. (2007) also indicate that the production of requires temperatures of at least K to allow the reaction. is also produced by -capture on during the fast-accretion phase in our models; the resulting ratios are 0.56, 0.60, and 0.57 for models 0.55+0.35 , 0.55+0.40 and 0.55+0.45 , respectively. There is no new from alpha-capture during the fast-accretion phase.
Fluorine
is enriched in most RCB stars by factors of 800–8000 relative to its probable initial abundance (Pandey et al., 2008). In our simulation, comes from the reaction , but the quantity of produced is small. The newborn is mixed with disk-accreted material. As was destroyed by during RGB evolution, the helium white dwarf is deficient in , having a mass fraction in our experiments. The fresh produced during the merger in our models is insufficient to match the observations.
Neon:
a high overabundance of neon has been identified in several RCBs. In our simulation, is enriched by two -captures on followed by extensive convective mixing.
Lithium:
a few RCB stars have a notably large overabundance of lithium, which has so far been difficult to explain. Longland et al. (2012) show that lithium can be produced by the merging of a He WD with a CO WD if their chemical composition is rich in from the previous evolution. This model requires enough to be left in the white dwarf after the end of main-sequence evolution and a hot enough corona to form during the merger. In our simulation, we obtained a mass fraction of in the He WD, which subsequently yielded a post-merger surface with a lithium mass fraction of , and for models 0.55+0.35 , 0.55+0.40 and 0.55+0.45 , respectively, or about ten times solar. Hence it is clear that is the key to explain the RCB lithium abundances.

6.2 The rôle of the helium white dwarf envelope
According to stellar evolution theory, in a helium white dwarf is thought to be produced whilst the star was previously on the first giant branch where it is dredged into and remains in the hydrogen envelope (Benvenuto & Althaus, 1998; Althaus & Benvenuto, 2000; Althaus et al., 2001; Steinfadt et al., 2010; Longland et al., 2012). Thus, the more of the hydrogen envelope that survives from the giant to the helium white dwarf, the more it is expected to contain. The He WD envelope plays a very important rôle in nucleosynthesis during the merger, particularly with regard to the production of lithium and fluorine.
To test whether there is a relation between hydrogen abundance and lithium enrichment, we set another three 0.4 He WDs, which have hydrogen envelope masses of 0.002, 0.004, 0.02 , to merge with a 0.55 CO WD. The abundance profile of a 0.4 He WD with a 0.02 hydrogen envelope is shown in Fig. 13. We assumed that all coronal hydrogen would be destroyed in the very initial stage of the fast-accretion phase, and so set this phase to be hydrogen free (), but maintained the contribution from . Without this assumption (i.e. with ), stable helium-burning could not be achieved during the accretion phase. Hydrogen which is not destroyed immediately at the beginning of accretion will be completely mixed in the accretion materials and may survive in both the disk and outer envelope. In a second experiment, we therefore tested the inclusion of a hydrogen mass fraction during both accretion phases.
As shown in Fig. 15 and Table 2, the abundances for nitrogen, neon and oxygen are similar to models without hydrogen. The carbon abundance is lower in models including hydrogen than in models without hydrogen. Carbon is decreased by the reaction in all models where hydrogen is present in the accreted material. At the same time, the ratio is also decreased and does not agree with observation. Hence the observed ratios limit the amount of hydrogen that can be present in the accreted material.
The more massive the hydrogen envelope in the helium white dwarf, the more it contains, and hence the more lithium is produced in the merger (Fig. 14).
The inclusion of a small quantity of hydrogen also affects the final fluorine abundances via the proton capture reaction (p,). Since a surplus of is produced during the hot coronal phase, and only a small quantity of is required to substantially alter the initial abundances, this mechanism can explain the fluorine excesses observed in RCB and EHe stars (Pandey et al., 2006; Pandey et al., 2008).
The above tests demonstrate that a hydrogen envelope on the helium white dwarf readily explains the enrichment of both and . The abundance of depends on the fraction of in the hydrogen envelope; and the abundance of depends on the fraction of in the accreted material.


7 Disk Destruction
If we only consider evolution after the fast-accretion phase, the star will expand to become a giant on a short timescale. For instance, the 0.55+0.20 merger model expands to a radius of 210 within 500 years (Fig. 16).
SPH simulations show the the debris disks to be smaller than 0.1 (Yoon et al., 2007; Lorén-Aguilar et al., 2009; Longland et al., 2012; Zhu et al., 2013; Dan et al., 2014). The envelope becomes almost fully convective when expanding, and hence the Keplerian disk may well be destroyed by convection and other mixing processes. Driven by helium-burning at its base, the convection region of the envelope will expand to 0.1 within 0.1 years (Fig. 17). If the disk is assumed to be totally destroyed by convection, the accretion rate will be . We adopt this accretion rate to make a new class of post-merger model, which we call “destroyed disk” models, and evolve these models with stellar winds, and hydrogen-free () accretion.
In order to consider both destroyed-disk and low- mergers, we produced 15 models comprising 0.50, 0.55, and 0.6 CO WDs merging with 0.20, 0.25, 0.30, 0.35, and 0.40 He WDs. We set the mass-accretion rate to be to emulate the disk-destruction process.


| Model (CO+He) | ||||||||
|---|---|---|---|---|---|---|---|---|
| 0.50+0.20 | -2.23 | -2.16 | -2.20 | -7.31 | -2.49 | -6.94 | 259 | 0.35 |
| 0.50+0.25 | -2.09 | -2.14 | -2.20 | -7.28 | -2.53 | -6.87 | 361 | 0.35 |
| 0.50+0.30 | -2.50 | -2.17 | -2.13 | -7.58 | -2.65 | -6.75 | 140 | 0.28 |
| 0.50+0.35 | -3.24 | -2.04 | -2.32 | -7.94 | -2.79 | -6.75 | 24 | 0.51 |
| 0.50+0.40 | -2.32 | -1.96 | -2.68 | -7.55 | -2.65 | -6.93 | 208 | 3.12 |
| 0.55+0.20 | -2.27 | -2.22 | -2.19 | -7.28 | -2.34 | -6.98 | 235 | 0.34 |
| 0.55+0.25 | -2.46 | -2.41 | -1.99 | -7.41 | -2.47 | -6.81 | 151 | 0.19 |
| 0.55+0.30 | -1.69 | -2.26 | -2.26 | -6.83 | -2.17 | -6.78 | 891 | 0.45 |
| 0.55+0.35 | -1.89 | -2.12 | -2.25 | -7.19 | -2.47 | -6.75 | 571 | 0.43 |
| 0.55+0.40 | -1.78 | -2.08 | -2.34 | -7.16 | -2.46 | -6.75 | 735 | 0.60 |
| 0.60+0.20 | -2.42 | -2.21 | -2.16 | -7.45 | -2.42 | -7.07 | 164 | 0.31 |
| 0.60+0.25 | -3.04 | -2.22 | -2.09 | -7.77 | -2.57 | -6.97 | 39 | 0.25 |
| 0.60+0.30 | -2.81 | -2.16 | -2.15 | -7.58 | -2.62 | -6.94 | 66 | 0.30 |
| 0.60+0.35 | -3.55 | -2.06 | -2.27 | -7.95 | -2.78 | -6.94 | 11 | 0.43 |
| 0.60+0.40 | -3.75 | -1.98 | -2.50 | -8.01 | -2.82 | -6.89 | 6 | 1.03 |
| Solar | -2.51 | -2.96 | -2.02 | -6.39 | -2.76 | -8.02 | 90 | 497 |
7.1 Hertzsprung-Russell diagram
The post-merger evolutionary tracks of two destroyed-disk models with different masses are shown in Fig. 18. After the merger process, they take 500 years to expand to the giant position. After the Reimers’ wind has removed most of the mass from the envelope (typically %), shell-helium burning makes the star evolve to high temperature without a luminosity change, as in most post-AGB stars. Taking the 0.55+0.30 model, for instance, the star takes 480 years to expand to 112 (marked A on Fig. 18) and only loses . Evolution from A to B takes 52 520 years, with a loss of 0.22 , and the radius only decreases to 103 . Evolution from stage B to C takes 1897 years and the temperature increases from 5336 K to 10000 K.

7.2 Comparison with observation
The locations of seventeen RCB and two EHe stars with on the temperature-gravity diagram are compared with the destroyed-disk post-merger evolution tracks (Fig. 19). In this figure, most RCB stars lie around the part of the post-merger evolution corresponding to the final contraction phase (B to C).
7.3 Abundances
Table 3 shows that the surface carbon abundance varies with mass. We also find enhanced abundances of N, O, Ne, and Li. All of these elements are compared with observed RCB and EHe stars in Fig. 21. Fluorine is low because there was no hydrogen in the accreted material. These calculations show that carbon is, again, only enhanced to the degree observed in models where the CO WD has a mass . However, high surface carbon is achieved for lower He WD masses, i.e. , than in the models presented in §4–6.
The slow-neutron capture process (s-process) occurs at temperatures and (Raiteri et al., 1991; Meyer, 1994). The temperature and density of the burning shell in our models satisfies this condition. In the destroyed-disk model, convection completely mixes the outer layers of the star so that any s-processed material produced in the shell during the merger and/or disk ingestion will become visible on the surface (Fig. 20). However, s-process nucleosynthesis is not included in the version of MESA used in these calculations, so we are not in a position to make a comparison with the observational constraints.


8 Pulsation
Following a series of studies of pulsation in hydrogen-deficient stars, Jeffery & Saio (2013) extended their stability calculations as a function of hydrogen abundance (mass fraction: ) to a larger range of effective temperature (), luminosity-to-mass ratio () and than before (Jeffery & Saio, 1999). Fig. 22 shows a fragment of the instability domain for and solar metallicity. At low Teff the classical “Cepheid” instability strip is evident, although shifted to higher Teff because of the reduced surface hydrogen. At high strange modes are excited. The strange modes are less sensitive to , and correspond to the observed locations of the variable RCB and EHe stars. Strange-mode oscillations in stars with high ratios have been identified for some time (Wood, 1976). They appear theoretically in non-adiabatic pulsation analyses and have no corresponding modes in the adiabatic approximation. In particular, they appear to be associated with stellar envelopes where high opacities in the ionisation zones also lead to a density inversion – effectively creating a radiation-pressure dominated cavity in the stellar interior. They are discussed at greater length by, inter alia, Gautschy & Glatzel (1990) and Saio et al. (1998).
The evolution tracks for CO+He WD mergers lie entirely within the unstable domain, with pulsation in classical radial modes driven by the second helium ionization zone at low Teff, and in strange modes at high (Fig. 22).
9 Population Synthesis
The birthrate of RCB stars from the merger of CO+He WD binaries has been estimated using a binary population synthesis technique. We perform a Monte-Carlo simulation to obtain a population of primordial binaries, then evolve each binary using a rapid binary evolution code (RBEC) (Hurley et al., 2000; Hurley et al., 2002) to obtain samples of double WD binaries. In the Monte Carlo simulation, all stars are assumed to be members of binaries and have circular orbits, while the primaries are generated according to the formula of Eggleton et al. (1989), i.e. following the initial mass function of Miller & Scalo (1979) and in the mass range 0.08 to 100 . The secondary mass, also with a lower limit of 0.08 , is then obtained assuming a constant mass-ratio distribution. The distribution of orbital separations, , is taken to be constant in for wide binaries and falls off smoothly at small separations according to Eq. (12) 11 1 for , ; for , , where , . in Han (1998), implying an equal number of wide binary systems per logarithmic interval and approximately 50% of stellar systems with orbital periods less than 100 yr (Han, 1998).
The numbers and characteristics of double WD binaries significantly depend on the critical mass ratio for dynamical instability and common-envelope (CE) evolution (Han, 1998). Here we adopt equation (57)22 2 for a normal giant, the mass-radius relation is assumed. Thus , where is core mass of . of (Hurley et al., 2002) for when the mass donor is on the first or asymptotic giant branch (AGB), and use the standard energy formalism (van den Heuvel, 1976; Webbink, 1984; Livio & Soker, 1988) for CE evolution by setting which reproduces the number of the double WD binaries in the Galaxy as in previous studies (Wang et al., 2009).


Fig. 23 shows the rates of possible mergers from CO+CO, CO+He and He+He WD binaries for a single starburst (normalized to ). These include only mergers arising from WD binaries which fill their Roche lobes in a Hubble time. If , mass transfer may be stable and may not produce a merger immediately. The CO+He systems are produced from stable RLOF+CE33 3 RLOF = Roche Lobe Overflow or CE+CE interactions to be sure that the orbital separation is small enough and the systems can merge in a Hubble time. The He WDs must be formed in the second CE process. The binding energy of an AGB-star envelope (with a CO core) is small, so that CE ejection results in an orbital separation too wide to merge in a Hubble time if the CO WD forms after the He WD. Furthermore, the smaller the mass of the He WD, then the larger the binding energy of the envelope and the more orbital energy is required and used for CE ejection. Thus the CO+He binaries which have the shortest periods and hence the highest likelihood to merge will be those containing the lowest mass He-WDs. Consequently, most of the merged CO+He binaries in Fig. 23 have low-mass He companions before merger. Fig. 24 shows a number-density plot for CO+He WD binaries in the plane. If we adopt the critical mass ratio for dynamically unstable mass transfer to be (Motl et al. (2007) give 0.67), Fig. 24 suggests that relatively few RCBs will be produced from CO+He WD mergers.

As discussed in §2, mass transfer in many low mass-ratio binaries is probably unstable and super-Eddington accretion may occur (Fig. 1: hatched region). Indeed, Dan et al. (2011) find a weak coupling between spin and orbit that leads almost all systems with to merge. In our calculations, the abundance of RCBs can only be explained if . In this case, mass transfer is unstable if . We have computed the RCB birthrate for various ranges of the CO WD mass, i.e. for , , and (Fig. 25). These show that RCBs appear at about yr after a single star burst, and the peak frequency is for the optimum range of CO WD mass (). The dip around 1.3 Gyr separates double WD binaries produced by the stable RLOF+CE process, which dominate at long lifetimes, from the more compact double WD systems produced by the CE+CE process, which dominate at short lifetimes. CO WDs with masses of account for the formation of RCBs when Gyr, while those with masses of dominate RCB production for longer lifetimes.

Fig. 25 represents the formation rate from a single starburst, as possibly represented by the old population of the galactic bulge to which RCBs and EHes are believed to belong. The theoretical merger lifetimes are too short to explain the current numbers of RCBs and EHes in this way. Sufficient numbers of CO+He WD binaries can only come from relatively recent ( Gyr) star formation. Fig. 26 shows the merger rates for a similar calculation assuming a constant star-formation rate of over the past 15 Gyr, resembling the Galactic disk. The RCB birthrate in this simulation is at 15 Gyr for the optimum case (), enough to explain the number of RCBs in our Galaxy.
In our post-merger evolution models, the timescales of the RCB stages are 50 000 to 70 000 yrs. Assuming a birthrate of gives RCB stars in the Galaxy. As the timescale for the EHe stage is less than 10% of the RCB stage, the number of EHes will be . Current observations give 68 known active RCBs and 17 known EHes in the Galaxy. It is not clear what fraction of stars in the theoretical RCB stage will be active in the sense of showing RCB-type minima, or what the overall completeness statistics are. The predicted and observed numbers are comparable within these unknowns.
10 Conclusion
The merger of a helium white dwarf with a carbon-oxygen white dwarf in a short-period binary currently provides the preferred model for the origin of RCB stars. Guided by hydrodynamical calculations of the dynamical merger, which provide approximate initial conditions for the subsequent evolution, we have made one-dimensional calculations of the post-merger evolution. We have considered the separate contributions of the hot corona and cold Keplerian disk which are formed from the helium white dwarf, and have also considered the chemistry of the helium white dwarf.
We have calculated how the luminosity and effective temperature of the star evolve over time, and also how the surface composition behaves in response to the chemistry of the progenitor white dwarfs, to nucleosynthesis during and after the merger, to disruption of the helium white dwarf and to convective mixing during the post-merger evolution. We have included mass-loss assuming a Blöcker-type stellar wind, and have considered the effects of enhancing this wind as a consequence of the hydrogen-deficient carbon-rich chemistry. Following merger, the stars become luminous and spend some 50 000 to 70 000 yrs in the domain of the RCB variables, where their surface chemistries strongly resemble those observed. Our calculations suggest that the observed abundances can only be produced by a very small range in the mass of the CO white dwarf around . As found previously, is produced during and survives the merger to account for observed overabundances of oxygen. Some , reacting with hydrogen from the helium white dwarf, and from the same source, combining with , can account for the enrichment of fluorine and lithium seen in many RCB stars.
To account for the small-size of the Keplerian disk relative to the expanding star, and its likely ingestion into that envelope, we have investigated a new class of model, the “destroyed-disk” model, in which the disk is assumed to be totally destroyed on a convective turnover timescale. A CO WD mass of is still required to produce high surface carbon, but a lower range in the He WD mass is permissible ().
The post-merger evolution tracks pass through a region of the diagram where stars are predicted to be pulsationally unstable, as is generally observed. Binary population synthesis (BPS) calculations indicate that the highest fraction of CO+He WD binaries have masses of around 0.55 (CO) and 0.25 (He) respectively. Combining the evolution timescales with estimates of merger rates from the BPS calculations yields an estimate of present-day numbers consistent with current observation.
A few problems still need to be addressed: i) post-merger evolution calculations and observed carbon abundances require the He WD masses to be in the range 0.30 (destroyed-disk) to 0.45 (fast+slow) whereas BPS simulations show most He-WD companions have masses in the range 0.2 – 0.3 , ii) observed luminosities and evolution calculations imply total masses around 0.8 – 1.0 , whereas BPS simulations favour total masses in the range 0.75 – 0.85 (with some outliers in both cases), iii) the BPS calculations imply that spin-orbit coupling must be weak so as to allow dynamical mergers for . and iv) the observed distribution of Galactic RCB stars must be reconciled with a relatively young ( Gyr) stellar population. The first three might readily be solved by considering in detail the rôle of spin-orbit coupling as suggested in § 9, and by Dan et al. (2011). Accurate measurements of distances, luminosities and masses will provide crucial tests for the models, whilst work on the effect of rotation and the distribution of angular momentum following merger will have important consequences for interpreting the products.
A number of RCB observables have not been considered in the current paper. The ejection of carbon-rich material from the system either during the merger or in the form of an enhanced Blöcker-type wind may lead to the formation of a cricumstellar shell. Cool dust shells are observed to exist around several RCB stars. A comparison of the observed masses and sizes with what might be expected theoretically would be valuable. It would be interesting to know whether the shells were formed during the stage A phase (as ejecta from the dynamical merger) or during the subsequent stage B evolution. More theoretical work on how mass-loss works in these stars would also be useful, particularly in reconciling the ad hoc use of a Blöcker-type wind with the episodic dust ejection associated with RCB variability.
In §6 we noted that CO+He WD mergers may also result in stars that are not carbon-rich. One may speculate upon how such stars might appear and whether they could be recognised. The evolution tracks continue to imply a passage through the AGB and post-AGB regions of the plane. With reduced carbon, the characteristic dust-ejection episodes and the molecular (Swan) absorption bands would be absent. The surface chemistry would remain hydrogen-deficient, so CH and OH would not be strong, but other signatures such as lithium and fluorine could persist. More detailed computations of the surface chemistry, based, for example, on the calculations presented here, would be worthwhile.
Acknowledgments
The Armagh Observatory is supported by a grant from the Northern Ireland Dept. of Culture Arts and Leisure. Z.H. is partly supported by the Natural Science Foundation of China (Grant Nos 11390374 and 11033008), the Science and Technology Innovation Talent Programme of the Yunnnan Province (Grant No. 2013HA005) and the Chinese Academy of Sciences (Grant No. XDB09010202). X.C. is partly supported by the Natural Science Foundation of China (Grant No. 11173055), the Talent Project of Young Researchers of Yunnan Province (2012HB037) and the Chinese Academy of Sciences.
References
- Alcock et al. (2001) Alcock C., Allsman R. A., Alves D. R., Axelrod T. S., Becker A., et al. 2001, ApJ, 554, 298
- Althaus & Benvenuto (2000) Althaus L. G., Benvenuto O. G., 2000, MNRAS, 317, 952
- Althaus et al. (2001) Althaus L. G., Serenelli A. M., Benvenuto O. G., 2001, MNRAS, 323, 471
- Anders & Grevesse (1989) Anders E., Grevesse N., 1989, Geochimica et Cosmochimica Acta, 53, 197
- Asplund et al. (2000) Asplund M., Gustafsson B., Lambert D. L., Rao N. K., 2000, A&A, 353, 287
- Benvenuto & Althaus (1998) Benvenuto O. G., Althaus L. G., 1998, MNRAS, 293, 177
- Blöcker (1995) Blöcker T., 1995, A&A, 297, 727
- Clayton (1996) Clayton G. C., 1996, PASP, 108, 225
- Clayton (2012) Clayton G. C., 2012, Journal of the American Association of Variable Star Observers (JAAVSO), 40, 539
- Clayton et al. (2007) Clayton G. C., Geballe T. R., Herwig F., Fryer C., Asplund M., 2007, ApJ, 662, 1220
- Clayton et al. (2011) Clayton G. C., Sugerman B. E. K., Stanford S. A., Whitney B. A., Honor J., 2011, ApJ, 743, 44
- Dan et al. (2014) Dan M., Rosswog S., Brüggen M., Podsiadlowski P., 2014, MNRAS, 438, 14
- Dan et al. (2011) Dan M., Rosswog S., Guillochon J., Ramirez-Ruiz E., 2011, ApJ, 737, 89
- Eggleton et al. (1989) Eggleton P. P., Fitchett M. J., Tout C. A., 1989, ApJ, 347, 998
- Ferguson et al. (2005) Ferguson J. W., Alexander D. R., Allard F., Barman T., Bodnarik J. G., Hauschildt P. H., Heffner-Wong A., Tamanai A., 2005, ApJ, 623, 585
- Gautschy & Glatzel (1990) Gautschy A., Glatzel W., 1990, MNRAS, 245, 597
- Grevesse & Sauval (1998) Grevesse N., Sauval A. J., 1998, Space Science Reviews, 85, 161
- Han (1998) Han Z., 1998, MNRAS, 296, 1019
- Heber (1983) Heber U., 1983, A&A, 118, 39
- Hurley et al. (2000) Hurley J. R., Pols O. R., Tout C. A., 2000, MNRAS, 315, 543
- Hurley et al. (2002) Hurley J. R., Tout C. A., Pols O. R., 2002, MNRAS, 329, 897
- Iben & Renzini (1984) Iben I., Renzini A., 1984, Physics Reports, 105, 329
- Jeffery & Hamann (2010) Jeffery C. S., Hamann W.-R., 2010, MNRAS, 404, 1698
- Jeffery et al. (2011) Jeffery C. S., Karakas A. I., Saio H., 2011, MNRAS, 414, 3599
- Jeffery & Saio (1999) Jeffery C. S., Saio H., 1999, MNRAS, 308, 221
- Jeffery & Saio (2013) Jeffery C. S., Saio H., 2013, MNRAS, 435, 885
- Lambert (1986) Lambert D. L., 1986, in K. Hunger, D. Schoenberner, & N. Kameswara Rao ed., IAU Colloq. 87: Hydrogen Deficient Stars and Related Objects Vol. 128 of Astrophysics and Space Science Library, The chemical composition of cool stars. II - The hydrogen deficient stars. pp 127–147
- Landau & Lifshitz (1962) Landau L., Lifshitz E., 1962, in The classical theory of fields. Pergamon, Oxford., . pp 1–352
- Lau et al. (2008) Lau H. H. B., Stancliffe R. J., Tout C. A., 2008, MNRAS, 385, 301
- Livio & Soker (1988) Livio M., Soker N., 1988, ApJ, 329, 764
- Longland et al. (2012) Longland R., Lorén-Aguilar P., José J., García-Berro E., Althaus L. G., 2012, A&A, 542, A117
- Longland et al. (2011) Longland R., Lorén-Aguilar P., José J., García-Berro E., Althaus L. G., Isern J., 2011, ApJL, 737, L34
- Lorén-Aguilar et al. (2009) Lorén-Aguilar P., Isern J., García-Berro E., 2009, A&A, 500, 1193
- Lynden-Bell & Pringle (1974) Lynden-Bell D., Pringle J. E., 1974, MNRAS, 168, 603
- Marsh et al. (2004) Marsh T. R., Nelemans G., Steeghs D., 2004, MNRAS, 350, 113
- Menon et al. (2013) Menon A., Herwig F., Denissenkov P. A., Clayton G. C., Staff J., Pignatari M., Paxton B., 2013, ApJ, 772, 59
- Meyer (1994) Meyer B. S., 1994, ARAA, 32, 153
- Miller & Scalo (1979) Miller G. E., Scalo J. M., 1979, ApJS, 41, 513
- Motl et al. (2007) Motl P. M., Frank J., Tohline J. E., D’Souza M. C. R., 2007, ApJ, 670, 1314
- Nelemans et al. (2001) Nelemans G., Portegies Zwart S. F., Verbunt F., Yungelson L. R., 2001, A&A, 368, 939
- Pandey et al. (2006) Pandey G., Lambert D. L., Jeffery C. S., Rao N. K., 2006, ApJ, 638, 454
- Pandey et al. (2008) Pandey G., Lambert D. L., Rao N. K., 2008, ApJ, 674, 1068
- Paxton et al. (2011) Paxton B., Bildsten L., Dotter A., Herwig F., Lesaffre P., Timmes F., 2011, ApJS, 192, 3
- Raiteri et al. (1991) Raiteri C. M., Busso M., Picchio G., Gallino R., Pulone L., 1991, ApJ, 367, 228
- Raskin et al. (2012) Raskin C., Scannapieco E., Fryer C., Rockefeller G., Timmes F. X., 2012, ApJ, 746, 62
- Saio (2008) Saio H., 2008, in Werner A., Rauch T., eds, Hydrogen-Deficient Stars Vol. 391 of Astronomical Society of the Pacific Conference Series, Radial and Nonradial Pulsations in RCB and EHe-B Stars. p. 69
- Saio et al. (1998) Saio H., Baker N. H., Gautschy A., 1998, MNRAS, 294, 622
- Saio & Jeffery (2002) Saio H., Jeffery C. S., 2002, MNRAS, 333, 121
- Staff et al. (2012) Staff J. E., Menon A., Herwig F., Even W., Fryer C. L., Motl P. M., Geballe T., Pignatari M., Clayton G. C., Tohline J. E., 2012, ApJ, 757, 76
- Steinfadt et al. (2010) Steinfadt J. D. R., Bildsten L., Arras P., 2010, ApJ, 718, 441
- Tang et al. (2013) Tang S., Cao Y., Bildsten L., Nugent P., Bellm E., Kulkarni S. R., Laher R., Levitan D., Masci F., Ofek E. O., Prince T. A., Sesar B., Surace J., 2013, ApJL, 767, L23
- Tisserand et al. (2008) Tisserand P., Marquette J. B., Wood P. R., Lesquoy É., Beaulieu J. P., et al. 2008, A&A, 481, 673
- van den Heuvel (1976) van den Heuvel E. P. J., 1976, in Eggleton P., Mitton S., Whelan J., eds, Structure and Evolution of Close Binary Systems Vol. 73 of IAU Symposium, Late Stages of Close Binary Systems. p. 35
- Ventura et al. (2000) Ventura P., D’Antona F., Mazzitelli I., 2000, A&A, 363, 605
- Ventura et al. (2013) Ventura P., Di Criscienzo M., Carini R., D’Antona F., 2013, MNRAS, 431, 3642
- Wang et al. (2009) Wang B., Meng X., Chen X., Han Z., 2009, MNRAS, 395, 847
- Warner (1967) Warner B., 1967, MNRAS, 137, 119
- Webbink (1984) Webbink R. F., 1984, ApJ, 277, 355
- Whittet (2003) Whittet D. C. B., ed. 2003, Dust in the galactic environment
- Wood (1976) Wood P. R., 1976, MNRAS, 174, 531
- Yoon et al. (2007) Yoon S., Podsiadlowski P., Rosswog S., 2007, MNRAS, 380, 933
- Zaniewski et al. (2005) Zaniewski A., Clayton G. C., Welch D. L., Gordon K. D., Minniti D., Cook K. H., 2005, AJ, 130, 2293
- Zhang & Jeffery (2012a) Zhang X., Jeffery C. S., 2012a, MNRAS, 426, L81
- Zhang & Jeffery (2012b) Zhang X., Jeffery C. S., 2012b, MNRAS, 419, 452
- Zhu et al. (2013) Zhu C., Chang P., van Kerkwijk M. H., Wadsley J., 2013, ApJ, 767, 164