Search for Millicharged Particles Using Optically Levitated Microspheres
Abstract
We report results from a search for stable particles with charge in bulk matter using levitated dielectric microspheres in high vacuum. No evidence for such particles was found in a total sample of ng, providing an upper limit on the abundance per nucleon of at the 95% confidence level for the material tested. These results provide the first direct search for single particles with charge bound in macroscopic quantities of matter and demonstrate the ability to perform sensitive force measurements using optically levitated microspheres in vacuum.
pacs
95.35.+d, 14.80.-j, 42.50.WkMillicharged particles, i.e., particles with charge for , have been proposed in extensions to the Standard Model that include new, weakly coupled gauge sectors (e.g. [1]). It is possible that millicharged particles are a component of the universe’s dark matter [2, 3]. If millicharged particles exist, they could have been produced in the early universe [4] and may have formed stable bound states that can be searched for in terrestrial matter today [5, 6].
Constraints on millicharged particles exist from astrophysical and cosmological observations [7, 8] as well as laboratory measurements [9, 10, 11, 12, 13]. However, such limits are typically sensitive to the mass of the particles and do not provide significant constraints for particles with mass GeV [7]. In contrast, searches for millicharged particles bound in bulk matter are typically insensitive to the the mass of the new particle and can probe masses GeV, but suffer from significant uncertainty on the relic abundance in terrestrial materials. The terrestrial abundance depends on the binding and ionization rate of the particles in the early universe, as well as subsequent enrichment or depletion processes [6].
Previous bulk matter searches using magnetic levitometers [14, 15, 16, 17] or high-throughput Millikan oil drop techniques [5, 18, 19, 20] focused on searching for free quarks with , and did not have sensitivity to single fractional charges with . In this work we present results from a search for particles with in bulk matter using optically levitated microspheres in high vacuum [21]. At high vacuum, residual dissipation of the microsphere motion from gas collisions becomes small, and measuring the motion of the microsphere in three dimensions allows extremely sensitive force detection [22, 21]. Previous work has demonstrated the trapping of microspheres in vacuum and cooling of the center-of-mass motion, which is necessary to keep the microsphere stably trapped at low pressures [23, 24, 25].
We have developed a system for trapping and cooling dielectric microspheres with diameters m in vacuum using a single, vertically-oriented laser beam [26, 27]. This optical setup allows long working distances between the focusing optics and trap location (few mm to few cm) and active feedback cooling of the microsphere’s motion through modulation of the trapping laser intensity and position. This cooling is used to stabilize the microsphere in the trap once dissipation due to residual gas collisions is insufficient to balance the heating of the microsphere’s mechanical motion by the laser [27].

A schematic of the experimental setup is shown in Fig. 1. A 300 mW diode laser ( nm) is spatially filtered and passes through a 2-axis acousto-optic deflector (AOD). Inside the vacuum chamber, the beam is focused and recollimated by a pair of aspheric lenses with focal lengths =11 mm. The resulting optical trap is centered between the flat faces of two cylindrical electrodes with diameter mm and separation mm. Assuming an offset m from the center of the electrodes, this configuration gives an expected electric field gradient at the microsphere location mm-1 [28]. In the following discussion, we define X as the direction parallel to the electric field, while gravity points in the -Z direction.
Two 20 mW diode lasers ( nm) are used to provide 3D imaging of the microsphere’s position. The first of these lasers is co-aligned with the trapping beam after the AOD and passes through the same optics used to orient and focus the trapping laser. The transmitted light from this laser is imaged onto a lateral effect position sensitive photodetector (PSPD) 11 1 Thorlabs PDP90A, http://www.thorlabs.com to determine the position of the microsphere in the 2 degrees of freedom (DOF) perpendicular to the trapping beam axis (i.e. the X and Y axes). The second imaging laser passes through an orthogonal set of lenses and is used to image the position of the microsphere along the Z axis. A field programmable gate array (FPGA)-based feedback loop modulates the amplitude and steering of the trapping beam using the AOD, which allows feedback to be applied to all three orthogonal DOF. An additional lens is placed after the AOD such that deflections of the beam angle at the AOD provide displacements of the trap [30].
This work uses m diameter silica microspheres (with masses, ng) manufactured by Bangs Laboratories 22 2 https://www.bangslabs.com/. Microspheres are loaded into the trap in 50 mbar of dry nitrogen, where there is enough gas damping that the trap is stable without feedback. The microspheres are applied to the bottom surface of a glass cover slip positioned above the trapping region and a piezoelectric transducer is used to vibrate the cover slip, releasing the microspheres to fall under gravity [26, 27]. A small fraction of these microspheres fall through the trapping laser focus and become trapped.
Once a microsphere is trapped, the pressure in the chamber is reduced to 2 mbar and feedback cooling is applied. The pressure in the chamber can then be lowered to the base value of mbar. We have demonstrated stable trapping of a single microsphere at this pressure for more than 100 hr. Although effective temperatures mK have been demonstrated for levitated microspheres in vacuum in our setup and elsewhere [23, 24, 25], cooling to K is more than sufficient for the force measurements presented here.
The minimum resolvable force in a 1 s integration is , where [21, 27] denotes the corresponding fluctuations due to the total dissipation of the microsphere motion, . Here is Boltzmann’s constant and is the mass of the microsphere. The additional noise term, , denotes noise sources that are not associated with damping, such as imaging noise. When , the application of feedback cooling does not significantly affect the signal-to-noise of the measurement [32, 33] since both the signal and noise are attenuated by the feedback. In this case, if the dissipation, , is limited by residual gas collisions, for gas pressure [34]. For our measurements the force sensitivity is pressure limited for mbar, while it is limited to N Hz-1/2 at lower pressures by laser fluctuations and imaging noise. We are working to reduce these non-intrinsic sources of noise and reach pressure limited noise at mbar, which is 2 orders of magnitude lower than the current sensitivity.
The microspheres typically have a net charge of 100–1000 after loading the trap. To remove this charge, a fiber-coupled Xenon flash lamp is used to illuminate the electrode surfaces near the microsphere. Empirically we have found that UV flashes from the Xe lamp nearly always charge the microsphere in the negative direction, consistent with photoelectric ejection of from the electrode surfaces. Hence, it is necessary to trap only microspheres with an initial net positive charge. When loading the microspheres directly from the glass cover slip, we have found that the initial charge is typically negative, but positive charges can be obtained by applying a thin layer of plastic between the glass surface and the microspheres (for these results, Scotch brand tape is used).
Once a microsphere is stably trapped at low pressure, an AC voltage with mV and Hz is applied to the electrodes. The charge of the microsphere is inferred from its resulting motion while the Xe flash lamp is used to quickly reduce the net charge to +10 . While this coarse discharging is done with a voltage drive at a single frequency, the data at are taken with a broad frequency excitation to ensure that any observed signal has the correct frequency response. A frequency comb containing all prime integers between 20 and 200 Hz is used, which has good frequency coverage around the microsphere resonant frequency of Hz. Since only prime frequencies are used, harmonics generated by potential non-linearities can be identified. After the microsphere has been discharged to a net charge +10 , the drive voltage is increased to V, which is sufficient to observe individual steps of 1 in the microsphere charge with high signal-to-noise, but low enough that the microsphere is not pushed out of the trap (the measured trap depth is 1 eV). The microsphere is then slowly discharged to a net integral charge of 0 , while calibrating the signal amplitude at each charge step. Once the microsphere is neutralized, the voltage is increased to V to increase sensitivity to small residual charges, and data are taken for a total integration time s. Finally, the voltage is again reduced to 10 V and additional calibration data are taken as the microsphere is charged to . An example of this discharging and measurement process is shown in Fig. 2.

For each data set, the X, Y, Z, and sum signals from the PSPDs are digitized at a sampling rate of 5 kHz using a 16-bit analog-to-digital converter (ADC). The drive signal is also directly recorded after passing through a resistive voltage divider with a measured gain of , and digitized on a separate 12-bit ADC to prevent electrical cross-talk to the position signals. A common trigger is used to synchronize acquisition of the drive and position signals, ensuring that the phase of the drive relative to the start of the data acquisition is identical for each 100 s cycle of the frequency comb. Data from each cycle are individually recorded to disk.
Data were taken for 10 microspheres to quantify variations between microspheres and to increase the total mass tested. The manual nature of the current loading sequence makes it impractical to measure a substantially larger number of microspheres. For each microsphere, the calibration data taken at a residual charge of 1 are used to determine the expected response to the drive signal, which includes both the transfer function of the microsphere’s motion in the trap as well as any effects of the readout electronics on the measured position response. The amplitude of the response for each 100 s cycle is then estimated using the optimal filter constructed from this response template [35]. This amplitude estimator is applied to the data at each net charge, and the measured single steps in the response are used to calibrate the residual response for each microsphere. The amplitude estimator is linear within 5% for response amplitudes V, so non-linearity in the response is negligible for the smaller residual motion of a neutral microsphere driven at 500 V.
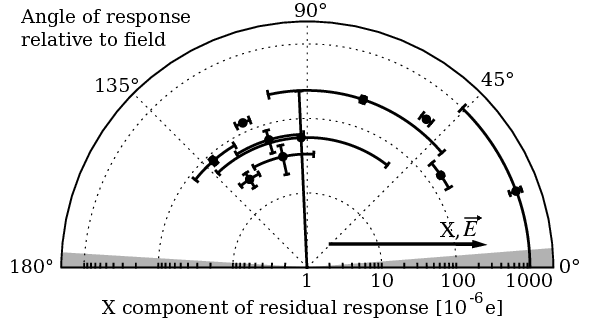
The residual response measured at a net integral charge of 0 for each of the microspheres is shown in Fig 3. Roughly half of the microspheres show a statistically significant residual of , while the remaining microspheres show a larger response of . For the microspheres with measured residuals , this response is found to vanish when the electrodes are grounded at the input to the vacuum chamber, but all other wiring connections are identical. The residual also vanishes when the drive signal is connected to the electrodes but there is no microsphere in the trap. These checks indicate that the residual responses from are likely to result from actual motion of the microspheres in the trap due to the drive voltage. However, this motion differs from the calibrated response of a microsphere with a net charge , being typically offset by relative to the direction of the electric field. In contrast, the calibrations for all microspheres with charges between align with the nominal direction of the electric field within , limited by residual misalignment of the imaging axes to the field. For the microspheres with larger measured residuals, in some cases the residual response does not completely vanish when the microsphere is removed from the trap, suggesting that the residuals may be at least partly due to cross-talk from the drive signal to the position measurement.
Given the misalignment of the microspheres’ motion relative to the expected response, the measured residuals are not evidence of a net residual fractional charge. Such residuals could be consistent with a permanent, microsphere-dependent electric dipole moment that couples to the translational DOF through asphericities or other inhomogeneities. Future work may allow the reduction of this residual by spinning the microspheres around the Z-axis at high frequency, averaging over inhomogeneities [16]. The residual motion varies with each microsphere, and provides a systematic limit to the sensitivity to small charges that dominates the statistical error for integration times s.
We conservatively calculate limits on the abundance of millicharged particles by assuming that the component of the residual response in the direction of the electric field could be due to a net fractional charge. The resulting limit on the abundance per nucleon, , of particles with charge is shown in Fig. 4, and compared to previous limits from oil drop [5, 18] and magnetic levitometer [14, 16, 17] experiments. The gray shaded region denotes the parameter space directly excluded by the present results assuming the residual on each microsphere could be due to a single millicharged particle.
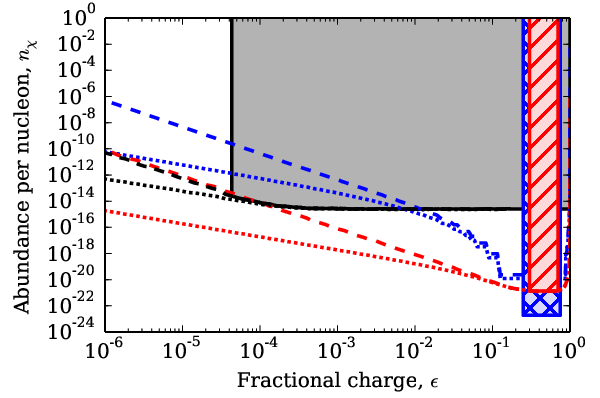
For the general case, where multiple millicharged particles could be bound to the microspheres, the distribution of the number of millicharged particles per microsphere is calculated for each value of . This distribution is calculated assuming Poisson statistics and either that the average number of positive and negative millicharged particles is equal (dashed lines in Fig. 4), or that only particles of a single sign are trapped in bulk matter (dotted lines in Fig. 4). To be conservative, the likelihood of a non-zero net charge is taken to be unity below the mean residual measured for each microsphere, and to fall off with the measured Gaussian error above the mean residual. The likelihood marginalized over the distribution of the number of millicharged particles is then calculated, and a combined likelihood, , over all microspheres is formed. The 95% confidence level (CL) upper limit for is determined from following Wilks’ theorem [36].
Although Refs. [5] and [16] published limits only above their single particle thresholds of , we have calculated the analogous limits from these experiments below this threshold for comparison. For Ref. [16], we use the reported residual charge and errors for each levitated ball to calculate the limit following the same technique as for our data above. For Ref. [5], the total mass was divided into individual droplets, and only the distribution of the measured residuals for these droplets was reported. Following the procedure in [5], we calculate the 95% CL limit on from this distribution given that no droplets were observed with . As shown in Fig. 4, the limits below the single particle threshold fall off more quickly for Ref. [5] than for Ref. [16] or our results. This occurs because the total mass tested in [5] was divided into many small droplets, which reduces the probability that a single droplet will contain multiple millicharged particles.
As shown in Fig. 4, the present results provide the first direct search for millicharged particles in bulk matter with sensitivity to single particles with . Over this full range, the upper limit on the abundance per nucleon is at most at the 95% CL for the material tested, while it improves to for . For , constraints on the abundance per nucleon are less stringent since multiple millicharged particles per microsphere would be required to give an observable charge. Previous results from [16] can also constrain some or all of this region, depending on the assumed ratio of positive to negative particles. However, given the residual systematic effects seen in all such searches, the single particle sensitivity of this work is necessary to distinguish a signal from backgrounds since the expected discrete distribution of particles can be directly observed. Future work to reduce the systematics described above may significantly improve the sensitivity of this technique.
In addition to providing the first direct search for single millicharged particles with in bulk matter, this work also represents the first application of sub-aN force sensing using levitated microspheres in vacuum to search for new particles or interactions. The method demonstrated here for discharging microspheres with single-electron precision is applicable to future work using optically levitated microspheres since it provides an absolute calibration of the force sensitivity and a means of eliminating electrostatic backgrounds that depend on net charge. In particular, these techniques and further improvements may also allow significant increases in sensitivity to short range forces [21, 22], including searches for non-Newtonian gravitational forces at micron distances.
This work was performed with seed funding from Stanford University. We would like to thank M. Lu, M. Dolinski, and M. Celentano for their work on early versions of the apparatus discussed here. We would also like to thank P. Graham, J. Mardon, and S. Block for useful discussions.
References
- [1] B. Holdom, Phys. Lett. B 166, 196 (1986).
- [2] D. Feldman, Z. Liu, and P. Nath, Phys. Rev. D 75, 115001 (2007), hep-ph/0702123 .
- [3] S. D. McDermott, H.-B. Yu, and K. M. Zurek, Phys. Rev. D 83, 063509 (2011), arXiv:1011.2907 [hep-ph] .
- [4] X. Chu, T. Hambye, and M. H. G. Tytgat, JCAP 5, 034 (2012), arXiv:1112.0493 [hep-ph] .
- [5] P. C. Kim, E. R. Lee, I. T. Lee, M. L. Perl, V. Halyo, and D. Loomba, Phys. Rev. Lett. 99, 161804 (2007).
- [6] P. Langacker and G. Steigman, Phys. Rev. D 84, 065040 (2011), arXiv:1107.3131 [hep-ph] .
- [7] S. Davidson, S. Hannestad, and G. Raffelt, JHEP 5, 003 (2000), hep-ph/0001179 .
- [8] A. D. Dolgov, S. L. Dubovsky, G. I. Rubtsov, and I. I. Tkachev, Phys. Rev. D 88, 117701 (2013), arXiv:1310.2376 [hep-ph] .
- [9] L. W. Jones, Rev. Mod. Phys. 49, 717 (1977).
- [10] A. A. Prinz, R. Baggs, J. Ballam, S. Ecklund, C. Fertig, J. A. Jaros, K. Kase, A. Kulikov, W. G. J. Langeveld, R. Leonard, T. Marvin, T. Nakashima, W. R. Nelson, A. Odian, M. Pertsova, G. Putallaz, and A. Weinstein, Phys. Rev. Lett. 81, 1175 (1998), hep-ex/9804008 .
- [11] A. Badertscher, P. Crivelli, W. Fetscher, U. Gendotti, S. N. Gninenko, V. Postoev, A. Rubbia, V. Samoylenko, and D. Sillou, Phys. Rev. D 75, 032004 (2007), hep-ex/0609059 .
- [12] S. N. Gninenko, N. V. Krasnikov, and A. Rubbia, Phys. Rev. D 75, 075014 (2007), hep-ph/0612203 .
- [13] M. L. Perl, E. R. Lee, and D. Loomba, Ann. Rev. Nucl. Part. Sci. 59, 47 (2009).
- [14] G. S. LaRue, J. D. Phillips, and W. M. Fairbank, Phys. Rev. Lett. 46, 967 (1981).
- [15] J. D. Phillips, W. M. Fairbank, and J. Navarro, Nucl. Instrum. Meth. Phys. Res. A 264, 125 (1988).
- [16] M. Marinelli and G. Morpurgo, Phys. Rep. 85, 161 (1982).
- [17] P. F. Smith, Ann. Rev. Nucl. Part. Sci. 39, 73 (1989).
- [18] I. T. Lee, S. Fan, V. Halyo, E. R. Lee, P. C. Kim, M. L. Perl, H. Rogers, D. Loomba, K. S. Lackner, and G. Shaw, Phys. Rev. D 66, 012002 (2002), hep-ex/0204003 .
- [19] D. C. Joyce, P. C. Abrams, R. W. Bland, R. T. Johnson, M. A. Lindgren, M. H. Savage, M. H. Scholz, B. A. Young, and C. L. Hodges, Phys. Rev. Lett. 51, 731 (1983).
- [20] J. Van Polen, R. T. Hagstrom, and G. Hirsch, Phys. Rev. D 36, 1983 (1987).
- [21] Z.-Q. Yin, A. A. Geraci, and T. Li, Int. J. Mod. Phys. B 27, 1330018 (2013), arXiv:1308.4503 [quant-ph] .
- [22] A. A. Geraci, S. B. Papp, and J. Kitching, Phys. Rev. Lett. 105, 101101 (2010), arXiv:1006.0261 [hep-ph] .
- [23] T. Li, S. Kheifets, and M. G. Raizen, Nature Phys. 7, 527 (2011), arXiv:1101.1283 [quant-ph] .
- [24] J. Gieseler, B. Deutsch, R. Quidant, and L. Novotny, Phys. Rev. Lett. 109, 103603 (2012), arXiv:1202.6435 [cond-mat.mes-hall] .
- [25] N. Kiesel, F. Blaser, U. Delic, D. Grass, R. Kaltenbaek, and M. Aspelmeyer, Proc. Nat. Acad. Sci. 110, 14180 (2013), arXiv:1304.6679 [quant-ph] .
- [26] A. Ashkin and J. M. Dziedzic, Appl. Phys. Lett. 19, 283 (1971).
- [27] T. Li, Fundamental Tests of Physics with Optically Trapped Microspheres (Ph.D. thesis, The University of Texas at Austin (2013)).
- [28] W. J. Atkinson, J. H. Young, and I. A. Brezovich, J. Phys. A: Math. Gen. 16, 2837 (1983).
- [29] Thorlabs PDP90A, http://www.thorlabs.com.
- [30] K. C. Neuman and S. M. Block, Rev. Sci. Instr. 75, 2787 (2004).
- [31] https://www.bangslabs.com/.
- [32] J. L. Garbini, K. J. Bruland, W. M. Dougherty, and J. A. Sidles, J. Appl. Phys. 80 (1996).
- [33] D. Vitali, S. Mancini, L. Ribichini, and P. Tombesi, Phys. Rev. A 65, 063803 (2002).
- [34] K. G. Libbrecht and E. D. Black, Phys. Lett. A 321, 99 (2004), quant-ph/0311138 .
- [35] L. R. Rabiner and B. Gold, Theory and application of digital signal processing (Prentice-Hall, Inc., Englewood Cliffs, N.J.).
- [36] S. Wilks, Annals Math. Statist. 9, 60 (1938).