Electron and photon energy calibration
with the ATLAS detector using LHC Run 1 data
Abstract
This paper presents the electron and photon energy calibration achieved with the ATLAS detector using about 25 fb-1 of LHC proton–proton collision data taken at centre-of-mass energies of and TeV. The reconstruction of electron and photon energies is optimised using multivariate algorithms. The response of the calorimeter layers is equalised in data and simulation, and the longitudinal profile of the electromagnetic showers is exploited to estimate the passive material in front of the calorimeter and reoptimise the detector simulation. After all corrections, the resonance is used to set the absolute energy scale. For electrons from decays, the achieved calibration is typically accurate to 0.05% in most of the detector acceptance, rising to 0.2% in regions with large amounts of passive material. The remaining inaccuracy is less than 0.2–1% for electrons with a transverse energy of 10 GeV, and is on average 0.3% for photons. The detector resolution is determined with a relative inaccuracy of less than 10% for electrons and photons up to 60 GeV transverse energy, rising to 40% for transverse energies above 500 GeV.
Keywords:
electron, photon, calibration, electromagnetic shower, calorimeter response, energy scale, resolution1 Introduction
Precise calibration of the energy measurement of electrons and photons is a fundamental input to many physics measurements. In particular, after the discovery of the Higgs boson by the ATLAS and CMS experiments [1, 2], an accurate determination of its properties is of primary importance. A precise measurement of the boson mass is also a long-term goal of the LHC experiments, and requires an excellent accuracy of the electron energy calibration.
A first electron and photon calibration analysis was performed using 40 pb-1 of LHC collision data taken in 2010 at a centre-of-mass energy TeV [3]. The calibration of the ATLAS liquid argon (LAr) calorimeter was primarily based on test-beam measurements; only the absolute energy scale was set using the boson resonance. The uncertainty on the detector material upstream of the LAr calorimeter, which is of primary importance in understanding its response to incident electromagnetic particles, was estimated from engineering drawings and a material survey during construction. The achieved calibration was accurate to 0.5–1% for electrons, depending on pseudorapidity and energy.
This paper presents the calibration scheme developed for precision measurements involving electrons and photons with 11 1 ATLAS uses a right-handed coordinate system with its origin at the nominal interaction point (IP) in the centre of the detector and the -axis along the beam pipe. The -axis points from the IP to the centre of the LHC ring, and the -axis points upward. Cylindrical coordinates are used in the transverse plane, being the azimuthal angle around the beam pipe. The pseudorapidity is defined in terms of the polar angle as . and mostly derived from collision data. It comprises local corrections to the calorimeter energy measurement, and the intercalibration of its longitudinal layers; a measurement of detector material leading to an improved simulation; an improved simulation-based calibration; and a measurement of the absolute energy scale from boson decays. The universality of the energy scale is verified using and decays (). The studies are primarily based on 20.3 fb-1 of proton–proton collision data collected in 2012 at TeV, and the algorithms are tested on 4.5 fb-1 of data collected in 2011 at TeV.
The paper is organised as follows. After an overview of the energy reconstruction with the ATLAS LAr calorimeter in Sect. 2, the calibration procedure, the data and simulated Monte Carlo (MC) samples used for this purpose are summarised in Sects. 3 and 4. Section 5 describes the simulation-based energy calibration algorithm. Data-driven corrections to the energy measurement and to the detector material budget are presented in Sects. 6 to 8, and the absolute energy scale determination from boson decays is described in Sect. 9. Systematic uncertainties affecting the calibration and cross-checks of the -based energy scale are given in Sects. 10-13. The results of this calibration procedure applied to the 2011 data sample are summarised in Appendix A. Uncertainties on the energy resolution are discussed in Sect. 14, and the performance of an algorithm combining the calorimeter energy measurement with the momentum measured in the tracking detectors is presented in Sect. 15. Section 16 summarises the achieved results and concludes the paper.
2 Electron and photon reconstruction and identification in ATLAS
2.1 The ATLAS detector
The ATLAS experiment [4] is a general-purpose particle physics detector with a forward-backward symmetric cylindrical geometry and near 4 coverage in solid angle. The inner tracking detector (ID) covers the pseudorapidity range and consists of a silicon pixel detector, a silicon microstrip detector (SCT), and a transition radiation tracker (TRT) in the range . The ID is surrounded by a superconducting solenoid providing a 2 T magnetic field. The ID provides accurate reconstruction of tracks from the primary proton–proton collision region and also identifies tracks from secondary vertices, permitting an efficient reconstruction of photon conversions in the ID up to a radius of about 800 mm.
The electromagnetic (EM) calorimeter is a LAr sampling calorimeter with an accordion geometry. It is divided into a barrel section (EMB), covering the pseudorapidity region ,22 2 The EMB is split into two half-barrel modules which cover the positive and negative regions. and two endcap sections (EMEC), covering . The barrel and endcap sections are divided into 16 and 8 modules in , respectively. The transition region between the EMB and the EMEC, , has a large amount of material in front of the first active calorimeter layer ranging from 5 to almost 10 radiation lengths (). A high voltage (HV) system generates an electric field of about 1 kV/mm, which allows ionisation electrons to drift in the LAr gap. In the EMB, the HV is constant along , while in the EMEC, where the gap varies continuously with radius, it is adjusted in steps along . The HV supply granularity is typically in sectors of . Both the barrel and endcap calorimeters are longitudinally segmented into three shower-depth layers for . The first one (L1), in the ranges and , has a thickness of about and is segmented into high-granularity strips in the direction, typically in in EMB, sufficient to provide an event-by-event discrimination between single photon showers and two overlapping showers coming from the decay of neutral hadrons in jets [5]. The second layer (L2), which collects most of the energy deposited in the calorimeter by photon and electron showers, has a thickness of about and a granularity of in . A third layer (L3), which has a granularity of in and a depth of about 2, is used to correct leakage beyond the EM calorimeter for high-energy showers. In front of the accordion calorimeter, a thin presampler layer (PS), covering the pseudorapidity interval , is used to correct for energy loss upstream of the calorimeter. The PS consists of an active LAr layer with a thickness of 1.1 cm (0.5 cm) in the barrel (endcap) and has a granularity of .
The hadronic calorimeter, surrounding the EM calorimeter, consists of an iron/scintillator tile calorimeter in the range and two copper/LAr calorimeters spanning . The acceptance is extended by two copper/LAr and tungsten/LAr forward calorimeters up to 4.9. The forward calorimeters also provide electron reconstruction capability, a feature that is not discussed here.
The muon spectrometer, located beyond the calorimeters, consists of three large air-core superconducting toroid systems with precision tracking chambers providing accurate muon tracking for and fast detectors for triggering for .
2.2 Energy reconstruction in the electromagnetic calorimeter
Electrons and photons entering the LAr calorimeter develop EM showers through their interaction with the lead absorbers. The EM showers ionise the LAr in the gaps between the absorbers. The ionisation electrons drift and induce an electrical signal on the electrodes which is proportional to the energy deposited in the active volume of the calorimeter. The signal is brought via cables to the read-out Front End Boards, where it is first amplified by a current-sensitive pre-amplifier. In order to accommodate a large dynamic range, and to optimise the total noise due to electronics and inelastic collisions coming from previous bunch crossings (out-of-time pile-up), the signal is shaped by a bipolar filter and simultaneously amplified with three linear gains called low (LG), medium (MG) and high (HG). For each channel, these three amplified signals are sampled at a 40 MHz clock frequency and stored on a switched capacitor array, awaiting the level-1 trigger decision; upon receipt, the sample corresponding to the maximum amplitude of the physical pulse stored in MG is first digitised by a 12-bit analog-to-digital converter (ADC). Based on this sample, a hardware gain selection is used to choose the most suited gain. The samples of the chosen gain are digitised and routed via optical fibres to the read-out drivers. More details on the ATLAS LAr calorimeter read-out and electronic calibration are given in Refs. [6] and [7].
The total energy deposited in an EM calorimeter cell is reconstructed as
| (1) | |||||
where are the samples of the shaped ionisation signal digitised in the selected electronic gain, measured in ADC counts in time slices () spaced by 25 ns; 33 3 The delay between the event trigger and the time slices is optimised to ensure that the third sample is on average at the signal maximum in each read-out channel. is the read-out electronic pedestal, measured for each gain in dedicated calibration runs; the weights are the optimal filtering coefficients (OFC) derived from the predicted shape of the ionisation pulse and the noise autocorrelation, accounting for both the electronic and the pile-up components [8]. The cell gain is computed by injecting a known calibration signal and reconstructing the corresponding cell response. The factor , which quantifies the ratio of the maxima of the physical and calibration pulses corresponding to the same input current, corrects the gain factor obtained with the calibration pulses to adapt it to physics-induced signals; the factor converts digital-to-analog converter (DAC) counts set on the calibration board to a current in ; the factor converts the ionisation current to the total deposited energy at the EM scale and is determined from test-beam studies [9].
2.3 Electron and photon reconstruction
The reconstruction of electrons and photons in the region starts from energy deposits (clusters) in the EM calorimeter. To reconstruct the EM clusters, the EM calorimeter is divided into a grid of towers of size . Inside each of these elements, the energy of all cells in all longitudinal layers is summed into the tower energy. These clusters are seeded by towers with total transverse energy above 2.5 GeV and searched for by a sliding-window algorithm [10], with a window size of 3 5 towers.
Clusters matched to a well-reconstructed ID track originating from a vertex found in the beam interaction region are classified as electrons. If the matched track is consistent with originating from a photon conversion and if in addition a conversion vertex is reconstructed, the corresponding candidates are considered as converted photons. They are classified as single-track or double-track conversions depending on the number of assigned electron-tracks. Clusters without matching tracks are classified as unconverted photons [5]. The electron cluster is then rebuilt using an area of calorimeter cells corresponding to 37 and 55 L2 cells 44 4 Only in L2 does the cell granularity correspond exactly to this tower size: the number of cells selected by the clustering algorithm in the other layers varies according to the position of the cluster barycentre in L2 [10]. in the EMB and EMEC respectively. For converted photons, the same 37 cluster size is used in the barrel, while a 35 cluster is associated with unconverted photons due to their smaller lateral size. A 55 cluster size is used in the EMEC for converted and unconverted photons. These lateral cluster sizes were optimised to take into account the different overall energy distributions in the barrel and endcap calorimeters while minimising the pile-up and noise contributions. The cluster energy is then determined by applying correction factors computed by a calibration scheme based on the full detector simulation, which is described in Sect. 5.
Photons and electrons reconstructed near regions of the calorimeter affected by read-out or HV failures are rejected [11].
The relative energy resolution for these EM objects can be parameterised as follows:
| (2) |
where , and are -dependent parameters; is the sampling term, is the noise term, and is the constant term. The sampling term contributes mostly at low energy; its design value is at low , and is expected to worsen as the amount of material in front of the calorimeter increases at larger . The noise term is about MeV for a cluster in space in the barrel and for a mean number of interactions per bunch crossing ; it is dominated by the pile-up noise at high . At higher energies the relative energy resolution tends asymptotically to the constant term, , which has a design value of 0.7%.
2.4 Electron and photon identification
The clusters associated with electron and photon candidates must satisfy a set of identification criteria, requiring their longitudinal and transverse profiles to be consistent with those expected for EM showers induced by such particles.
Three reference sets of cut-based selections, labelled loose, medium and tight, have been defined for electrons with increasing background rejection power [12, 13]. Shower shape variables in both the first and second layers of the EM calorimeter and the fraction of energy deposited in the hadronic calorimeter are used in the loose selection with additional requirements on the associated track quality and track-cluster matching. Tightened requirements on these discriminating variables are added to the medium criteria together with a loose selection on the transverse impact parameter and on the number of hits in the TRT associated with the track, and a measured hit in the innermost layer of the pixel detector to discriminate against photon conversions.55 5 This cut is only applied when the traversed module is active The tight selection adds a selection on the ratio of the candidate’s reconstructed energy to its track momentum, , stricter requirements on the discriminating variables and TRT information, and a veto on reconstructed photon conversion vertices associated with the cluster.
The identification of photons is performed by applying cuts on shower shapes measured in the first two longitudinal layers of the EM calorimeter and on the leakage into the hadronic calorimeter [14].
To further suppress background from hadronic decays, an isolation requirement is applied. The calorimeter isolation transverse energy is computed by summing the transverse energy of all calorimeter cells in a cone of size around the candidate [10]. The isolation energy is corrected by subtracting the estimated contributions from the photon or electron candidate itself and from the underlying event and pile-up contributions using the technique proposed in Ref. [15] and implemented as described in Ref. [16]. A track isolation variable is also used for electrons and muons. It is built by summing the transverse momenta of the tracks in a cone of size around the candidate, excluding the track associated with the candidate itself. The tracks considered in the sum must come from the reconstructed vertex with the highest sum of all associated tracks and must have at least four hits in either the pixel or SCT detector.
3 Overview of the calibration procedure
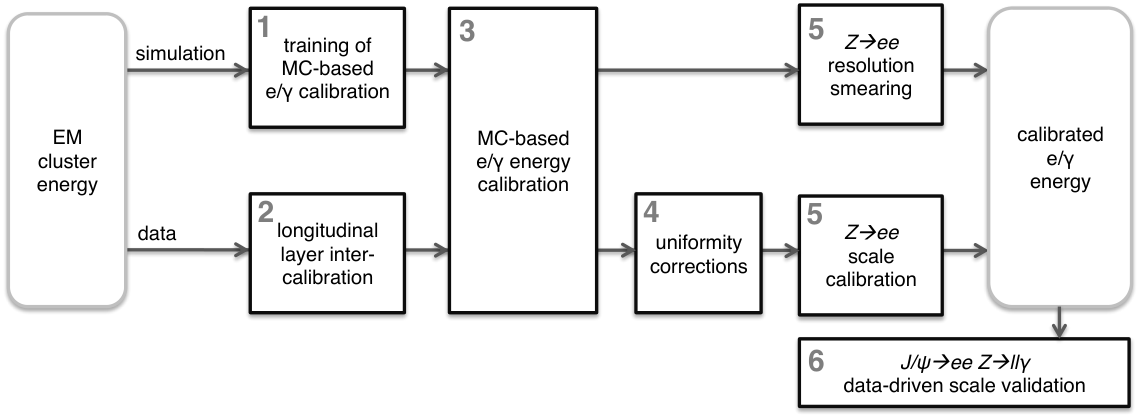
The different steps in the procedure to calibrate the energy response of electrons and photons described in this paper are summarised below, with the item numbers referring to the calibration steps sketched in Fig. 1. The references to their description in the paper is also given.
The energy of an electron or photon candidate is built from the energy of a cluster of cells in the EM calorimeter. The calibration proceeds as follows:
- 1.
The EM cluster properties, including its longitudinal development, and additional information from the ATLAS inner tracking system, are calibrated to the original electron and photon energy in simulated MC samples using multivariate techniques (step 1), which constitutes the core of the MC-based response calibration (step 3). The calibration constants are determined using a multivariate algorithm (MVA) [17]; its optimisation is performed separately for electrons, converted and unconverted photons. The MC samples used in the various analyses presented in this paper are detailed in Sect. 4, while the MC-based MVA calibration is described in Sect. 5.
A prerequisite of this MC-based calibration is that the detector geometry and the interactions of particles with matter are accurately described in the simulation. The material distribution is measured in data using the ratio of the first-layer energy to the second-layer energy in the longitudinally segmented EM calorimeter (). Measuring in data with different samples (electrons and unconverted photons) allows a precise determination of the amount of material in front of the calorimeter and provides some sensitivity to its radial distribution as described in Sect. 8.
- 2.
Since the EM calorimeter is longitudinally segmented, the scales of the different longitudinal layers have to be equalised in data with respect to simulation, prior to the determination of the overall energy scale, in order to ensure the correct extrapolation of the response in the full range used in the various analyses (step 2). The procedure to measure the EM calorimeter layer scales is reviewed in Sect. 7.
- 3.
The MC-based response calibration is applied to the cluster energies reconstructed both from collision data and MC simulated samples (step 3).
- 4.
A set of corrections are implemented to account for response variations not included in the simulation in specific detector regions (step 4), e.g. non-optimal HV regions, geometric effects such as the inter-module widening (IMW) or biases associated with the LAr calorimeter electronic calibration. These corrections are discussed in Sect. 6, where the stability of the calorimeter response as a function of , time and pile-up is also presented.
- 5.
The overall electron response in data is calibrated so that it agrees with the expectation from simulation, using a large sample of events as discussed in Sect. 9. Per-electron scale factors are extracted and applied to electron and photon candidates in data (step 5). Using the same event sample it is found that the resolution in data is slightly worse than that in simulation, and appropriate corrections are derived and applied to simulation to match the data. The electron and photon calibration uncertainties are summarised in Sect. 10.
- 6.
The calibrated electron energy scale is validated with electron candidates from events in data (step 6). The scale dependence with and , and its associated systematic uncertainties are summarised in Sect. 11. The scale factors extracted from events are assumed to be valid also for photons, while photon-specific systematic uncertainties are applied, as discussed in Sect. 12. This approach is validated with photon candidates from events in data, and discussed in Sect. 13.
4 Collision data and simulated samples
The results presented in this paper are primarily based on 20.3 fb-1 of collision data at = 8 TeV, collected by ATLAS in 2012. The results of the application of the same methods to 4.7 fb-1 of collision data taken in 2011 at = 7 TeV are described in Appendix A.
Table 1 lists the kinematic selections applied to the different calibration samples, the generators used and the corresponding numbers of events in 2012 collision data. The average electron transverse energy is around 4045 GeV in the and samples and 11 GeV in the sample; for photons, 25, 100 GeV in the and samples, respectively. The event selection relies on and , respectively defined as the norm and azimuth of the total transverse momentum imbalance of all reconstructed objects, and on the transverse mass defined as where , being the azimuthal angle of the electron.
| Process | Selections | MC generator | |
|---|---|---|---|
| GeV, | 5.5 M | Powheg+Pythia | |
| GeV | |||
| GeV, | 34 M | Powheg+Pythia | |
| GeV, GeV | |||
| GeV, | 0.2 M | Pythia | |
| GeV | |||
| GeV, | 7 M | Sherpa | |
| GeV | |||
| , | GeV, | 20k (e) | Sherpa |
| large-angle | GeV, | 40k () | |
| GeV, | |||
| GeV | |||
| GeV | |||
| , | GeV, | 120k | Sherpa |
| collinear | GeV, | ||
| GeV | |||
| GeV | |||
| GeV, | 3.1 M | Pythia |
The sample results from both direct production and decays. Three different triggers are used for this sample requiring a transverse energy of the leading lepton above 4, 9 and 14 GeV respectively. The trigger requirement significantly affects the electron distribution in this sample, which is not the case for the other calibration samples.
In the sample, photons and electrons are required to have a large-angle separation. A collinear sample in the channel, where the photon is near one of the muons, is also selected. Isolation requirements are applied to photons and leptons. In the large-angle sample, leptons are required to have ; in addition electrons are required to satisfy while for photons GeV. In the collinear sample, the same isolation cut is applied to photons, but it is tightened for muons by applying .
The measurements are compared to expectations from MC simulation. Comparisons between data and simulation are initially performed using the detector description originally used for most ATLAS analysis (for instance, in Ref. [1]), later refered to as the “base” simulation. The detector description resulting from the passive material determination described in Sec. 8 is instead refered to as the “improved” simulation. Large samples of , , , , and events were generated with Sherpa [18] and Powheg [19, 20, 21, 22] interfaced with Pythia [23]. The generated events are processed through the full ATLAS detector simulation [24] based on Geant4 [25]. The size of the MC samples exceeds the corresponding collision data samples by a factor of up to 10.
For the optimisation of the MC-based response calibration, a sample of 20 million single electrons, and one of 40 million single photons are simulated. The distribution of such samples is tuned to cover the range from 1 GeV to 3 TeV while maximising the statistics between 7 and 100 GeV.
For studies of systematic uncertainties related to the detector description in simulation, samples with additional passive material in front of the EM calorimeter are simulated, representing different estimates of the possible amount of material, based on studies using collision data [26, 27, 28, 29, 30, 31].
Depending on the signal samples, backgrounds consist of , and gauge boson pair production, simulated using Powheg; simulated using Pythia; and production, simulated using Mc@nlo [32]. For the analysis, backgrounds from production in association with jets are simulated using Sherpa. Some background contributions are directly determined from data.
The MC events are simulated with additional interactions in the same or neighbouring bunch crossings to match the pile-up conditions during LHC operation, and are weighted to reproduce the distribution of the average number of interactions per bunch crossing in data.
5 MC-based calibration for electrons and photons
Reconstructed electron and photon clusters are calibrated to correct for the energy lost in the material upstream of the calorimeter, the energy deposited in the cells neighbouring the cluster in and , and the energy lost beyond the LAr calorimeter. Further corrections are applied to correct for the response dependence as a function of the particle impact point within the central cluster cell. The cluster-level calibration constants are extracted from simulated electrons and photons and strongly rely on the assumed amount of passive material in front of the EM calorimeter. The simulation of the detector material uses the improvements described in Sect. 8.
The constants are determined using a multivariate algorithm, applied separately for electrons, converted and unconverted photons in and bins. The calibration method presented in this section supersedes the procedure described in Refs. [33] and [3], except for the transition region where the initial calibration procedure is still used.
5.1 Input variables
The calibration procedure optimises the estimate of the true particle energy at the interaction point () from the detector-level observables. The algorithm uses cluster position measurements in the ATLAS and EM calorimeter frames. The ATLAS coordinate system has its origin at the nominal interaction point, with respect to which the calorimeter is displaced by a few millimeters, while all calorimeter cells are in their nominal position in the EM calorimeter frame.
The quantities used for electrons and photons are the total energy measured in the calorimeter, ; the ratio of the PS energy to the calorimeter energy, ; the shower depth, defined as , where and are the cluster energy and the calorimeter thickness (in radiation lengths) in layer ; the cluster barycentre pseudorapidity in the ATLAS coordinate system, ; and the cluster barycentre in and within the calorimeter frame. The variable is included to account for the passive-material variations in front of the calorimeter; the inclusion of the barycentre location in the calorimeter frame is important to accurately correct for the increase of lateral energy leakage for particles that hit the cell close to the edge, and for the sampling fraction variation as a function of the particle impact point with respect to the calorimeter absorbers.
Photons are considered converted if the conversion radius is smaller than 800 mm. For these converted photons, is used as an additional input to the MVA only if the vectorial sum of the conversion track momenta, , is above 3 GeV. In particular for conversions with both tracks containing at least one hit in either the pixel or SCT detector, further quantities are considered: the ratio ; and the fraction of the conversion momentum carried by the highest- track, .
5.2 Binning and linearity corrections
To help the MVA optimise the energy response in different regions of phase space, the sample is divided into bins of , , and according to the particle type (electron, unconverted photon or converted photon). The binning is chosen to follow the known detector geometry variations and significant changes in the energy response. A rectangular mesh of bins in is defined, and bins are defined in addition for the regions close to the edges of the two half-barrel modules:
-
: 0 - 0.05 - 0.65 - 0.8 - 1.0 - 1.2 - 1.37 ; 1.52 - 1.55 - 1.74 - 1.82 - 2.0 - 2.2 - 2.47, where 1.37 - 1.52 is excluded and 0 - 0.05 and 1.52 - 1.55 are edge bins.
-
(normal bins): 0 - 10 - 20 - 40 - 60 - 80 - 120 - 500 - 1000 and 5000 GeV.
-
(edge bins): 0 - 25 - 50 - 100 - 500 - 1000 and 5000 GeV.
An independent optimisation is performed for each bin.
Multivariate algorithms aim at optimising the energy response and minimising the root mean square (RMS) resolution. The presence of tails in the energy response results in remaining non-linearities which are corrected by adjusting the peak position of the ratio of the output energy to to unity. These corrections range from +2% to +5% depending on at 10 GeV, and rapidly decrease to zero around 100 GeV.
5.3 Performance
The linearity and resolution of the MVA calibration are illustrated in Fig. 2. The linearity is defined as the deviation of the peak position of from unity as a function of , estimated by the most probable value (MPV) of a Gaussian function fitted to the core of the distribution in each () bin. The fits are restricted to the range standard deviations. The resolution is defined as the interquartile range of , i.e. the interval excluding the first and the last quartiles of the distribution in each bin, normalised to 1.35 standard deviations, its equivalent definition for a normal distribution. These estimators are chosen to reflect the influence of energy tails.
The obtained MVA calibration non-linearity is everywhere below 0.3% for above 10 GeV, better than 1% at lower transverse energies, only reaching 2% in localised regions for converted photons. An improvement of more than a factor two compared to the initial calibration is achieved, in particular in the high region. For the resolution, improvements of about 3% to 10% in the barrel and 10% to 15% in the endcap are obtained for unconverted photons. For converted photons in the same energy range, the resolution is improved by typically 20%. For electrons, improvements of a few percent are obtained on average, except at where they vary from 10% to 30% depending on . While the resolution estimator used here reproduces the expected sampling term resolution for unconverted photons ( on average), the worse resolution obtained for electrons and converted photons reflects the presence of significant energy tails induced by interactions with the material upstream of the calorimeter.
Fig. 3 compares the performance of the MVA calibration with the initial calibration in simulated ( GeV) and events. The invariant mass resolution of the former improves by 10% on average, with a maximum improvement of 15% for converted photons or in the barrel–endcap transition region. The latter reflects the expected linearity improvement; no significant resolution improvement is obtained.
6 Uniformity and stability
Good uniformity of the EM calorimeter energy reconstruction across pseudorapidity and azimuthal angle, and excellent stability of the response as a function of time and pile-up conditions, are necessary to achieve optimal energy resolution in data. They also constitute a prerequisite for the passive material determination and energy scale measurement presented in Sects. 7-9. The present section describes a set of studies, based on the data collected at , aiming to correct for local non-uniformities in the calorimeter response.
The response uniformity is investigated using for electrons in events and the electron pair invariant mass in boson decays. Four classes of effects are discussed below. The stability of the response as a function of , time and pile-up is presented after all corrections are applied.
6.1 High-voltage inhomogeneities
In a few sectors (of typical size ) of the EM calorimeter, the HV is set to a non-nominal value due to short circuits occurring in specific LAr gaps [11]. The effect of such modifications is first corrected at the reconstruction level using the expected HV dependence of the response. The azimuthal profiles of the electron pair invariant mass in events, however, show localised residual effects, affecting less than 2% of the total number of HV sectors in the EM calorimeter [7]. An empirical correction is derived based on these profiles to restore the azimuthal uniformity in the problematic sectors. The average value of as a function of the azimuthal position of its leading decay electron, for , is presented in Fig. 4 before and after this correction. In this example, two sectors are set to a non-nominal HV, inducing a decrease of the response by about 2% at and . After correction, the response is uniform.
6.2 Time dependence of the presampler response
The nominal HV in the EM barrel PS is 2000 V. To limit the increasing occurrence of sporadic electronics noise [3] with increasing luminosity, the operating HV was reduced to 1600 V during the 2011 run and until September 2012 (period P1). The HV was later further reduced to 1200 V, with some sectors brought down to 800 V (period P2). As above, the non-nominal HV is at first compensated at the cell level using a correction defined from the expected HV dependence of the PS response. This correction is of the order of 8% for P1 and 21% for P2.
The accuracy of the correction is verified by comparing the PS response for electrons from data between P1 and P2; a residual -dependent variation of up to 1% is observed. An additional empirical correction is applied to the PS energy at the cluster level, reducing the bias to 0.4% across . The residual response bias and its corrections are illustrated in Fig. 5.
6.3 Energy loss between the barrel calorimeter modules
When probing the energy response versus using the MPV of the distribution in events in data, a -periodical structure is observed. The period and the location of the effect correspond to the transitions between the barrel calorimeter modules. The size of the modulation is 2% in the region and 1% for , and is interpreted as a gravity-induced widening of the inter-module gaps. The energy loss is adjusted with an empirical function which is then used to correct the calorimeter response. The effect of the inter-module widening and its correction are shown in Fig. 6. This effect is not observed in the EMECs.
6.4 Energy response in high and medium gain
To accommodate the wide range of expected energies in the calorimeter cells, the electronic signals are treated with three gains (see Sect. 2.2). In events, used for the absolute energy scale determination (see Sect. 9), most electron clusters have all their L2 cells recorded in HG. In the case of ( GeV) for example, roughly 1/3 of the events have a photon with at least one cell in MG.
The reconstructed electron pair invariant mass is compared between data and simulation as a function of the electron energy, for events where all electron cluster cells in L2 are in HG and for those where at least one cell is in MG. In most of the calorimeter, the energy calibration is found to be gain independent within uncertainties; however, a percent-level effect is seen in specific regions (around and ). Two example regions are illustrated in Fig. 7 for and . The observed effect is symmetric in .
The observed gain dependence of the energy response is removed by applying a correction defined from the data–MC difference of the energy response in HG and MG, multiplied by the expected fraction of clusters with at least one L2 cell in MG at given and . The LG case, relevant only at very high energy, is assumed to have the same correction as the MG.
6.5 Azimuthal non-uniformity and operational stability after corrections
The azimuthal non-uniformity before and after the corrections described above is shown in Fig. 8. This non-uniformity is defined as the RMS of the energy response versus , probed with a granularity of , after having subtracted the contribution from the expected statistical fluctuations. The energy response is probed using the electron pair invariant mass peak in events, and the non-uniformity is defined from the RMS of the response versus , probed with a granularity of , corresponding to one cell in L2, and for coarse bins; the contribution of the expected statistical fluctuations is subtracted in quadrature. The result can be interpreted as the non-uniformity contribution to the long-range resolution constant term. A non-uniformity of 0.45% is achieved for , and 0.75% is obtained in the rest of the calorimeter.
The stability of the electron energy response as a function of the mean number of interactions per bunch crossing (), and as a function of time was measured using electrons from boson decays. The results presented in Figs. 9 and 10 show stability at the level of . The stability of the response as a function of the number of reconstructed collision vertices () is shown in Fig. 11. Classifying events according to , related to the actual number of interactions per bunch crossing, biases the pile-up activity of the colliding bunch with respect to the average. In this case the compensation of the pile-up contribution to the reconstructed energy by the bipolar shaping becomes imperfect, giving rise to the observed slope. The description of this effect in the simulation is accurate to 0.05%.
7 Intercalibration of the LAr calorimeter layers
Corrections are needed in data to adjust residual effects not perfectly accounted for by the cell electronic calibration discussed in Sect. 2.2.
The intercalibration of the first and second calorimeter layers uses muons from decays as probes, while the determination of the PS energy scale exploits the PS energy distributions of electrons in data and simulation, after effective corrections for possible mis-modelling of the upstream passive material. The results are verified by a study of the electron energy response as a function of shower depth.
No dedicated intercalibration of the third EM longitudinal layer is carried out, as its contribution is negligible in the energy range covered by the present studies.
7.1 Intercalibration of the first and second calorimeter layers
Muon energy deposits in the calorimeter are insensitive to the amount of passive material upstream of the EM calorimeter and constitute a direct probe of the energy response. The measured muon energy is typically 60 MeV in L1 and about 210 MeV in L2, with a signal-to-noise ratio of about three [7]. Muon energy deposits are very localised, most of the energy being deposited in one or two cells. Since the critical energy for muons interacting with the calorimeter is of the order of 100 GeV, most muons from decays are minimum ionising particles.
The analysis uses muons from decays, requiring GeV. The calorimeter cells crossed by the muon tracks are determined by extrapolating the muon tracks to each layer of the calorimeter, taking into account the geometry of the calorimeter and the residual magnetic field seen by the muon along its path in the calorimeter. In L1, the muon signal is estimated by summing the energies measured in three adjacent cells along , centred around the cell of highest energy among the few cells around the extrapolated track. In L2, due to the accordion geometry, the energy is most often shared between two adjacent cells along ; hence the signal is estimated from the sum of the highest energy cell and its most energetic neighbour in .
The observed muon energy distribution in each layer is given by the convolution of a Landau distribution describing the energy deposit, and a Gaussian distribution corresponding to the electronic noise. The MPV of the deposited energy is extracted using an analytical fit with the convolution model, or is alternatively estimated using a truncated mean, by defining the interval as the smallest one containing 90% of the energy distribution. Denoting the ratio of the MPVs in L1 and L2, the intercalibration result is defined as . The central value of is given by the average of the two methods; the difference is used to define its systematic uncertainty. The statistical uncertainty is negligible. The result is illustrated in Fig. 12. All features are observed to be symmetric within uncertainties with respect to , and are therefore shown as a function of . In the barrel, a negative bias of about 3% is observed; it shows a falling structure from to 0.8 and from to 1.4, with a positive step at the boundary between these regions. In the endcap, on average, but its behaviour across pseudorapidity is not uniform.
The intercalibration of the calorimeter layers with muons relies on the proper modelling in the simulation of the induced ionisation current by muons in each calorimeter layer. The following sources of uncertainty are considered:
-
uncertainty in the exact path length traversed by muons, related to uncertainty in the geometry of the read-out cells;
-
uncertainty in the effect of the reduced electric field at the transition between the different calorimeter layers;
-
uncertainty in the modelling of the conversion of deposited energy to ionisation current due to variations in the electric field following the accordion structure of the absorbers and electrodes;
-
uncertainty in the cross-talk between different calorimeter cells (between L1 cells, between L1 and L2 cells and between L2 cells) [34] which affects the measured energy for muons (using three cells in L1 and two cells in L2).
These uncertainties are evaluated by implementing the corresponding changes in the simulation. The resulting uncertainty on the relative calibration of L1 and L2 rises from 1% to 1.5% with the pseudorapidity in the barrel and is 1.5% in the endcap.
These uncertainties are also propagated to uncertainties on the modelling of for electrons and photons, as this variable is used in Sect. 8 for the passive-material determination. For this modelling, the difference between data and simulation in the description of lateral EM shower shape is also taken into account, as it affects L2 more than L1.
In addition, the HG response in L1 is found to be sensitive to the pile-up-dependent optimisation of the OFC, for , with an uncertainty rising from 1% to 5% in this region. Since in this region most high- EM showers have their highest energy cell in L1 recorded in MG, this additional uncertainty is accounted for when applying the muon-based calibration to electrons or photons.
The L1/L2 calibration bias discussed in this section is removed by applying an -dependent correction to the layer intercalibration in data. The correction can be applied to the energy measured either in L1 (by defining ) or in L2 (). The latter option is chosen, as a direct comparison of in data and simulation shows that the pattern vs observed in Fig. 12 is localised in L2. After all other corrections discussed in the rest of the paper are applied, and in particular the overall energy scale correction discussed in Sect. 9, the calibrated particle energy is unaffected by this choice.
7.2 Presampler energy scale
The presampler energy scale is determined from the ratio of PS energies in data and MC simulation and estimated using electrons from and decays. Before this ratio can be interpreted in terms of an energy scale, the effects of passive-material mis-modelling must be taken into account, as an inaccurate passive-material description in the detector affects the electron shower development and hence the predicted PS energy distributions with respect to the data, resulting in an apparent energy scale bias. This is addressed by exploiting the expected correlation between and for electrons, at a given value, under variations of the passive material upstream of the PS.
To study this correlation, a set of detector material variations is implemented in simulation, increasing the passive material in the various detector sub-systems upstream of the PS (ID, services, cryostat) and within the calorimeter volume between the PS and L1. The results are illustrated in Fig. 13. Simulations with additional passive material upstream of the PS result in an earlier shower and simultaneously increase the PS activity and ; a linear correlation between these observables is observed. Simulations also including passive material between the PS and L1 exhibit the same slope of versus , but with an offset along as material additions after the PS can not affect the PS activity, but generate earlier showers in the calorimeter. The following linear parameterisation describes the impact of upstream passive-material variations on and :
| (3) |
where and are the predicted values of and in the nominal simulation, and and their values in the varied simulations. The simulation samples described above predict for , and for . Assuming correct L1/L2 calibration, parameterises the remaining potential mis-modelling of for effects unrelated to the material upstream of the PS (such as an imperfect description of the passive material between the PS and L1 and a possible mis-modelling of the cross-talk between L1 and L2); by definition in the absence of bias.
Correlating the data/MC ratios of and thus approximately removes the impact of local material variations on the former, and provides a corrected prediction for this quantity,
| (4) |
where corresponds to the amount of expected PS energy in the simulation, corrected for local material bias via and . Finally, the PS energy scale is defined by
| (5) |
The offset is probed using a sample of unconverted photons selected from radiative decays and inclusive photon production, and defined as for this sample. In addition to the identification criteria summarised in Sect. 2, the unconverted photon sample should satisfy MeV to limit the probability that a conversion occurred between the end of the ID and the PS. It is verified using simulation that this cut indeed minimises the sensitivity of this sample to material variations upstream of the PS, and that modelling uncertainties from material after the PS or cross-talk between L1 and L2 affect electrons and photons in a similar way, so that this photon sample probes for electrons with an inaccuracy of less than 1–2% depending on pseudorapidity.
Fig. 14 shows the comparison of between data and simulation for electrons and for the unconverted photon sample, before and after the L1/L2 calibration correction described in Sect. 7.1. Before this calibration correction, the ratio of data to MC simulation for electrons and photons is on average below one by 3% in the barrel. After calibration corrections, is everywhere close to one, which suggests that there is no significant material mis-modelling downstream of the PS. In contrast, the electron data in the endcap show a residual positive bias of about 7% on average, indicating a discrepancy in the description of the material. An explicit passive-material measurement using these data is performed in Sect. 8.
Figure 15 summarises the PS scale calculated according to Eqs. (4) and (5) and Fig. 14, from which the corrected values are used as input to the calculation. The material corrections based on Eq. (4) visibly reduce the variations of versus compared to , especially in the regions and . After this correction, the PS energy scale is defined by averaging over intervals corresponding to the PS module size ( in the barrel, in the endcap). As it is located in the transition region, the correction to the PS energy scale for the module covering is not addressed by this analysis. For particles entering this region, and its uncertainty are taken from the closest range among and .
The measured PS energy scale defines a correction factor that is applied to the data. Uncertainties affecting its determination arise from the statistical and systematic uncertainties affecting and , and from the residual variations of within a PS module, which indicates that the material correction via Eq. (4) is only approximate. The statistical uncertainty on and from the electron samples is negligible. The PS scale measurement is accurate to 2–3%, depending on pseudorapidity.
7.3 Layer intercalibration cross-check
The dependence of the electron energy response on shower depth allows a direct extraction of for EM showers, providing a test of the baseline approach described in Sect. 7.1. Figure 16 shows the correlation between the invariant mass of electron pairs from decays and for data and simulation, in the representative bin . The PS scale corrections determined in Sect. 7.2 are applied.
The ratio between data and the nominal simulation is not constant versus . A constant data-to-simulation ratio is recovered by rescaling the L1 response in data and recomputing the invariant mass accordingly, adjusting to maximise the compatibility of the ratio with a horizontal line. This procedure is applied to derive as a function of , and the optimum is determined by minimisation.
The difference between the values of obtained with this procedure and with the muon-based L1/L2 calibration are shown in Fig. 17 as a function of . Good compatibility in the full pseudorapidity range is observed, confirming the validity of the muon-based calibration. For and , the distributions for electrons in data and simulation differ significantly regardless of , leading to poor convergence of the minimisation procedure and enhanced uncertainties in these bins.
The uncertainties on the electron measurement include systematic contributions from detector material mis-modelling and from uncertainties on the cross-talk between L1 and L2. To test the influence of passive material, a sample with 2035% additional material, depending on , is simulated and treated as the data. The values extracted from this sample represent a conservative passive-material contribution to the uncertainty on , and contribute about 0.5% on average, except for where the uncertainty is 12%. The influence of cross-talk is probed by rescaling the L1 response in data, requiring in addition that the sum of the L1 and L2 energies be constant. Such variations have no impact on the data/MC ratio and the contribution of this effect is negligible. These systematic variations are also illustrated in Fig. 16, for .
8 Passive-material determination
After L1/L2 calibration corrections, the distribution observed for EM showers in the data can be used to quantify the amount of detector material upstream of the active calorimeter. Higher values of in data would indicate earlier shower development, and hence a local excess of material in comparison with the simulation. Although is intrinsically a measure of the material integral in front of the calorimeter at a given pseudorapidity, the study is performed for different categories of EM showers (electrons, and unconverted photons without PS activity), providing partial information on the distance from the beam axis at which the material is probed.
The detector material categories can be grouped under ID material; cryostat material (“Cryo”), designating material located between the maximal conversion radius and the PS; and calorimeter material (“Calo”), for passive material located between the PS and L1.
8.1 Methodology
Electrons are sensitive to all detector material crossed along their trajectory, from the interaction point up to L1; unconverted photons are insensitive to the ID material upstream of the conversion radius. Within the PS acceptance (), a veto on the PS activity can be required to minimise the probability that a conversion happened in front of the PS, making such photons specifically sensitive to passive material between the PS and L1. The shower development for these different types of particles is sketched in Fig. 18.
The sensitivity of for these probes of detector material is evaluated using simulated samples including the following variations:
-
+5% relative scaling of the ID inactive material;
-
+10% in front of the barrel calorimeter;
-
+5% between the barrel PS and L1;
-
+15% at the end of the active SCT and TRT endcap detectors;
-
+15% at the end of the ID volume, in front of the EMEC cryostat;
-
+30% in front of the endcap calorimeter, for ;
-
+5% between the endcap PS and L1.
The material additions in the barrel are placed at constant radius, and their thickness is constant as a function of , hence the material seen by particles coming from the interaction point increases with pseudorapidity as indicated above. Similarly, the material additions in the endcap are placed at constant and have constant thickness as a function of radius.
For each category and in a given region, the amount of additional material , expressed in terms of , is normalised to the relative shift induced in for electrons or photons respectively, obtaining a sensitivity factor . Figure 19 shows the sensitivity curve obtained from the various material distortions upstream of the PS, for electrons. The behaviour is approximately universal, and parameterised as a single curve. At small , a 1% relative change in corresponds to about 2.5%. The sensitivity of unconverted photons with MeV to material between the PS and L1 is also shown; a 1% relative change in corresponds to about 1.5%, independently of .
This factor is scaled by the observed relative difference of between data and simulation after calibration corrections (see Fig. 14), yielding an estimate of the passive-material offset with respect to the nominal simulation:
| (6) |
The uncertainty on the material measurement receives contributions from , reflecting the residual L1/L2 calibration uncertainty discussed in the previous section, and from . The intrinsic EM shower development modelling accuracy contributes to the latter; this item is evaluated by simulating high- electron samples and varying the associated Geant4 options to test refinements in the theoretical description of bremsstrahlung and photon conversion cross sections, as well as alternative electron multiple scattering models, and found to be 1%. The residual sensitivity differences between the various material configurations contributes a systematic uncertainty of 10% to the parameterisation.
Two categories of detector material are probed for : the integral between the interaction point and the PS, i.e. the sum of ID and cryostat material; and calorimeter material between the PS and L1. The former is obtained by comparing in the electron and unconverted photon data samples in order to subtract, from the electron probe, the influence of material after the PS. The latter is obtained by comparing for unconverted photons between data and simulation. For , only the total amount of material up to L1 is measured, by comparing for electrons in data and simulation.
The ID material is considered known , with an accuracy of 5% from detailed monitoring and weighing during the construction and installation [4]. Studies using decays, secondary hadronic interactions and photon conversions were also performed [28, 27], with no indication of ID material mis-modelling larger than 5%. The ID material accuracy is combined with the measured material integral to derive an estimate for the cryostat material. The calorimeter material is measured without external inputs.
8.2 Material determination
The difference between the calorimeter material estimate from data and simulation, as obtained from the comparison of for unconverted photons after calibration corrections, is summarised in Fig. 20 (left). The statistical uncertainty in the measurement is dominated by the size of the unconverted photon control samples. Systematic uncertainties come from the accuracy of the material sensitivity calibration, the finite size of the MC sample, and from the residual sensitivity of unconverted photons to passive-material variations upstream of the PS. After calibration corrections, no significant bias remains in (see Fig. 14, bottom), translating into material discrepancies of at most 0.03. The measurement accuracy is about 0.03.
In Fig. 20 (right), the data–MC material difference integrated up to L1, denoted and expressed in units of , results from the combination of the observed profile for electrons after calibration corrections (see Fig. 14, top) and the corresponding sensitivity curve (see Fig. 19). In the barrel, moderate features are observed, primarily a 0.2 excess at , and a slight –0.1 deficit between . In the endcap, the measurement is characterised by very strong excesses, up to 0.60.7, in the region , and around because of an incomplete description of SCT cooling pipes. In the remaining part of the endcap, an overall bias of about 0.2 is observed. In contrast, a deficit of about –0.5 is observed within . The material bias integrated up to the PS, , is obtained after subtracting, from the above, material contributions located after the PS, i.e. . This is derived by comparing the electron and unconverted photon data. The features observed within the PS acceptance are very similar to , which indicates that the material biases are located upstream of the PS. For both integrated estimates, the measurement accuracy ranges from about 0.04 to 0.06.
8.3 Improvements to the ATLAS material simulation
This section presents the detector simulation improvements implemented following the results obtained in the previous section. Given the absence of significant biases in , the data suggest the need to implement in the simulation material modifications upstream of the PS. Most of the discrepancies correspond to areas with a large amount of material from services between the ID active area and the calorimeter cryostat. The corrections were implemented in an effective way, adding material in the most discrepant areas and in amounts corresponding to the measurement. The modifications to the detector material description are illustrated in Fig. 21. The total amount of detector material within the ID boundaries, and up to the active calorimeter are illustrated in Fig. 22 for the improved simulation.
After implementation and validation of the improved simulation, the samples were resimulated, and the data/MC comparisons repeated. The difference between the material estimate from data and the improved simulation is summarised in Fig. 23. As can be seen, the improved simulation behaves as expected in most of the acceptance: the overall discrepancy in the endcap has disappeared, as well as the strong peak around . The deficit within remains, as it has not been addressed. In the barrel, the excess at has been halved. The residual passive-material uncertainties in this improved simulation are presented in Fig. 24. Where no significant excess or deficit remains, the measurement uncertainty is given by the L1/L2 calibration uncertainty, and the sensitivity curves’ systematic uncertainties. When the residual discrepancy is larger than the measurement uncertainty, the size of the discrepancy is taken as the final uncertainty. No measurement was performed for ; in this region the uncertainty on the material upstream of L1 is estimated to be , following Ref. [3]. The modelling systematic uncertainties summarised in Sect. 7 are considered correlated across , separately in the barrel and endcap calorimeters. Among these, the L1 gain systematic uncertainty only affects the measurement of the material integral up to L1, for . The Geant4 systematic uncertainties are fully correlated across . The data-driven components of the material determination are estimated in bins of size , and the corresponding uncertainties are uncorrelated beyond this range.
The MC-based energy calibration described in Sect. 5 is applied using the new detector description, to reoptimise the energy response in the endcap, where significant amounts of passive material were added in the simulation. The resulting MC calibration constitutes, together with the energy corrections described in Sects. 6 and 7, the basis of the absolute scale determination presented in the next section.
9 Energy scale and resolution determination with electrons from decays
As shown in Sect. 6, no significant mis-calibration is observed as a function of , in a given region. The residual non-uniformity is at the level of 0.75% or better as illustrated in Fig. 8, matching the design constant term of 0.7%. Furthermore, the energy response is shown in Figs. 9 and 10 to be stable with time at the level of 0.05%. Consequently, the absolute scale determination is carried out as a function of only, and independently of time and azimuth.
9.1 Methodology
The energy mis-calibration is defined as the difference in response between data and simulation, and is parameterised as follows:
| (7) |
where and are the electron energy in data and simulation, and represents the departure from optimal calibration, in a given pseudorapidity bin labelled . For decays, the effect of electron mis-calibration on the electron pair invariant mass is
| (8) |
neglecting second-order terms and assuming that the angle between the two electrons is perfectly known; and are the invariant mass in data and simulation for an electron pair reconstructed in pseudorapidity bins and , and the induced shift of the mass peak. Electron resolution corrections are derived under the assumption that the resolution curve is well modelled by the simulation up to a Gaussian constant term
| (9) |
The sampling term is assumed to be known to from test-beam studies [35]. For each category, the relative electron and invariant mass resolutions satisfy
| (10) |
where is the relative invariant mass resolution correction for . To determine the and parameters, histograms of the invariant mass are created from the simulation, including energy scale and resolution perturbations to the reconstruction-level quantities, in a range covering the expected uncertainty in narrow steps. The templates are built separately for the electron pseudorapidity configurations and constitute a two-dimensional grid along (, ). The data are categorised accordingly. The optimal values, uncertainties and correlations of and are obtained by minimisation, as illustrated in Fig. 25. The individual electron energy scales and resolution corrections are obtained by solving the system given by Eqs. (8) and (10).
An alternative method relies on the same kinematical relations, but replaces the templates by a parameterisation of the Monte Carlo distributions, and performs a likelihood fit to the energy scales. The parameterisation is based on the convolution of a Breit–Wigner function and a Gaussian distribution; the energy scales are determined by minimising with respect to the following likelihood:
| (11) |
where 0, is the number of regions considered for the calibration, is the total number of selected events and is the probability density function (PDF) quantifying the compatibility of an event with the expected boson line shape at the reconstruction level, when the two electrons fall in regions and .
9.2 Results and uncertainties
The methods described above are applied to a sample of decays, selecting two electrons in the final state, satisfying GeV, , GeV and medium ID selection criteria. The categories are defined as bins of size in the barrel; a more complicated structure is defined in the endcap, according to the PS acceptance boundaries and the -dependent HV settings.
The results are summarised in Figs. 26 and 27, where the energy scale and the effective constant term corrections are illustrated as a function of . The energy scale factors are defined with respect to the 2010 calibration results [3], which were implemented as cell-level energy corrections in coarse bins; the values obtained here reflect the reoptimisation of the OFC coefficients for the 2012 pile-up conditions, and the uniformity and layer calibration corrections performed ahead of the absolute scale determination and discussed in the previous sections. They are found to be symmetric with respect to in the barrel; in the endcaps, similar patterns are observed for and , up to an overall shift of about 1% resulting from the slightly different LAr temperature in the two cryostats. The energy scale determination is accurate to for , for and for . The resolution corrections are about 0.8% on average in the barrel, and about 1% in the endcap, and are determined to be accurate on average to 0.3% and 0.5%, respectively. At given , the values of are found to be statistically compatible for and and are symmetrised in Fig. 27. The uncertainty contributions are detailed below.
The agreement of the energy scale between the template and likelihood methods is good, with an average difference of when the full range is considered, and of when the transition region () is discarded. The fitted constant terms agree within between the two methods.
The intrinsic accuracy of the template method is tested by injecting known energy scale and resolution distortions into a simulation sample that is treated as the data. The corresponding and corrections are then derived by comparing the modified simulation to the templates, and compared to the injected values. No bias is found beyond the statistical accuracy of the test; systematic uncertainties of for the energy scales, and for the resolution corrections are assigned.
The sensitivity of the result to the event selections is studied by varying the electron identification criteria and the mass window used for the fit. Repeating the energy correction determination using electrons with tight ID selection criteria gives an average difference for the energy scales, and for the resolution corrections. Uncertainties on the efficiency corrections for trigger, identification and reconstruction can distort the invariant mass distribution and lead to a total uncertainty of about on the energy scales and on the resolution corrections. The impact of the choice of mass window is on average and .
The dedicated tracking algorithm used for electrons provides momentum measurements at the interaction point and at the outer radius of the ID, denoted by ( and ( respectively. The momentum lost by bremsstrahlung is quantified by defining , where values close to 0 select electrons which have lost a small fraction of their momentum. Repeating the analysis requiring selects an electron sample with less bremsstrahlung than the inclusive sample, with an efficiency of about 50%. The impact of this selection is and .
Uncertainties induced by the general modelling of the signal process (pile-up, interaction point distribution, theoretical description of the lineshape) contribute and .
Electroweak, top and multijet backgrounds constitute about 0.13% of the selected boson sample. To propagate the corresponding uncertainty, the normalisation of the electroweak and top backgrounds is varied within the theoretical cross-section uncertainties, which are as large as 10% depending on the channel, with an impact of and . The multijet background fraction is estimated by comparing the electron isolation distribution observed after all selections with the expected distributions for signal and multijet production [12]. The signal distribution is determined from the simulation, while the multijet distribution is determined from a jet-enriched sample obtained by selecting electron pairs passing only the loose identification criterion. The relative uncertainty of this determination is 50% and contributes and .
The uncertainties quoted above are averages; the values depend on pseudorapidity, with larger values in regions with a large amount of material upstream of the calorimeter and in the transition region between the barrel and endcap. The stability of the corrections with the energy is discussed in Sect. 11.
9.3 Data/MC comparison after corrections
After all corrections, the dielectron mass distribution in data and simulation agree at the level of 1% in the mass range GeV, rising to 2% towards the low end of the interval. The energy scale adjustement, followed by the resolution correction, are the main causes of the improved agreement with respect to that obtained with the previous calibration and simulation [3]. The jet, electroweak and top backgrounds contribute about 1.5% near GeV and GeV. Figure 28 shows the dielectron mass distribution for the data corrected with the energy scale factors and for the MC simulation with and without the resolution corrections. In addition the ratios of the corrected data and uncorrected MC distributions to the corrected MC distribution are illustrated together with the final calibration uncertainty.
A slight excess persists at low mass, indicating that the energy tails in the data are not entirely modelled by the simulation, even after the calibration and detector geometry improvements described above. However, as shown in Fig. 28, this discrepancy lies within the quoted passive-material uncertainty. Its impact on the energy scale and resolution corrections is covered by the systematic variations described in the previous section.
10 Summary of uncertainties common to electrons and photons
The calibration uncertainty for electrons from boson decays is determined, at given pseudorapidity and for GeV, by the accuracy of the -based calibration described in the previous section. Other effects are generally energy and particle-type dependent and can be written as follows:
| (12) |
A given source of uncertainty changes the energy scale by , which is a function of and and depends on particle type. The -based effective calibration absorbs the effect for electrons with and leaves the residual uncertainty . Because of this subtraction, can change sign as a function of .
The gain dependence of the energy response is measured in data by comparing the peak position for electron clusters with all L2 cells recorded in HG to electrons with at least one cell recorded in MG. The probability of an electron or photon cluster to contain at least one MG cell increases smoothly with energy in a given range: it is parameterised using simulated and samples, and is then validated using events from data. The parameterisation is used to correct for the effect in data, and the full size of the correction is taken as uncertainty. As a separate effect, the energy pedestal of electron and photon clusters is verified by comparing pile-up only events in data and simulation. An average offset of about 15 MeV is found, depending on . The induced energy non-linearity is negligible at high energy but can reach 0.1% for GeV and is counted as a separate systematic uncertainty.
The impact of the PS and L1/L2 calibration uncertainties on the reconstructed particle energy depends on the fractional energies of the cluster carried in those layers, and . The energy and pseudorapidity dependence of and is parameterised for electrons and photons using the simulation, and the uncertainty is given by the product of these energy fractions and the corresponding layer calibration uncertainties, at given and . An additional uncertainty is assigned to the intrinsic accuracy of EM shower development simulation, by varying physics modelling options in Geant4.
The ID, Cryo and Calo material uncertainties are propagated after comparing the energy response in samples simulated with modified and nominal detector material. The simulation modifications follow the description in Sect. 8.1; the corresponding response differences are scaled to the actual material measurement uncertainties, yielding the energy response uncertainties.
The dominant sources of uncertainty are illustrated in Fig. 29 for electrons and unconverted photons, for and GeV. All curves correspond to an upward variation of the considered source of uncertainty by one standard deviation; the effect of this variation can change sign as a function of , as discussed above. For electrons, the layer calibration uncertainties reach about 0.15% at low , are minimal for GeV, and rise to about 0.05% towards high energy. For unconverted photons, the layer uncertainties are largest at high energy, reaching about 0.1%. The uncertainty related to the HG/MG transition contributes above GeV, and reaches 0.3% at high transverse energy. A deficit of passive material in the simulation induces a drop in the energy scale towards low ; in this pseudorapidity region, the drop is largest for cryostat material and reaches –0.3% at GeV. After the -based calibration, the same material deficit induces an overestimate of the energy response for unconverted photons by about 0.05%, regardless of the passive material type. The energy dependence of this effect is negligible for unconverted photons and the corresponding uncertainties are considered independent of .
Other sources of uncertainty are subleading and not discussed here explicitly. All sources are considered as independent and their sum in quadrature defines the total uncertainty at given and . Tables 26 show the uncertainty contributions discussed above as a function of pseudorapidity, and fixed values of . For electrons, 11 GeV and 40 GeV are typical of and decays, respectively; 200 GeV illustrates the asymptotical behaviour of the uncertainty. For photons, 60 GeV is typical for decays with GeV.
| Electrons, GeV | ||||||
|---|---|---|---|---|---|---|
| range | 0–0.6 | 0.6–1 | 1–1.37 | 1.37–1.55 | 1.55–1.82 | 1.82–2.47 |
| calibration | 0.03 | 0.04 | 0.08 | 0.22 | 0.22 | 0.05 |
| Gain, pedestal | 0.09 | 0.09 | 0.07 | 0.00 | 0.09 | 0.24 |
| Layer calibration | 0.15 | 0.19 | 0.14 | 0.16 | 0.13 | 0.19 |
| ID material | 0.03 | 0.03 | 0.31 | 0.88 | 0.33 | 0.10 |
| Other material | 0.12 | 0.38 | 0.58 | 0.20 | 1.00 | 0.15 |
| Total | 0.22 | 0.44 | 0.69 | 0.94 | 1.09 | 0.36 |
| Electrons, GeV | ||||||
|---|---|---|---|---|---|---|
| range | 0–0.6 | 0.6–1 | 1–1.37 | 1.37–1.55 | 1.55–1.82 | 1.82–2.47 |
| calibration | 0.03 | 0.04 | 0.08 | 0.22 | 0.22 | 0.05 |
| Gain, pedestal | 0.00 | 0.00 | 0.00 | 0.00 | 0.02 | 0.01 |
| Layer calibration | 0.01 | 0.01 | 0.01 | 0.00 | 0.00 | 0.01 |
| ID material | 0.00 | 0.00 | 0.01 | 0.00 | 0.00 | 0.00 |
| Other material | 0.00 | 0.01 | 0.02 | 0.00 | 0.02 | 0.00 |
| Total | 0.03 | 0.04 | 0.08 | 0.22 | 0.22 | 0.05 |
| Electrons, GeV | ||||||
|---|---|---|---|---|---|---|
| range | 0–0.6 | 0.6–1 | 1–1.37 | 1.37–1.55 | 1.55–1.82 | 1.82–2.47 |
| calibration | 0.03 | 0.04 | 0.08 | 0.22 | 0.22 | 0.05 |
| Gain, pedestal | 0.21 | 0.36 | 0.40 | 0.00 | 2.14 | 0.61 |
| Layer calibration | 0.15 | 0.18 | 0.16 | 0.18 | 0.18 | 0.21 |
| ID material | 0.00 | 0.06 | 0.07 | 0.78 | 0.17 | 0.06 |
| Other material | 0.06 | 0.17 | 0.35 | 0.20 | 0.63 | 0.07 |
| Total | 0.27 | 0.45 | 0.57 | 0.85 | 2.25 | 0.65 |
| Unconverted photons, GeV | |||||
| range | 0–0.6 | 0.6–1 | 1–1.37 | 1.55–1.82 | 1.82–2.47 |
| calibration | 0.03 | 0.04 | 0.08 | 0.16 | 0.05 |
| Gain, pedestal | 0.03 | 0.02 | 0.01 | 0.89 | 0.55 |
| Layer calibration | 0.15 | 0.20 | 0.20 | 0.25 | 0.26 |
| ID material | 0.06 | 0.12 | 0.19 | 0.07 | 0.12 |
| Other material | 0.09 | 0.17 | 0.40 | 0.96 | 0.09 |
| Total | 0.19 | 0.31 | 0.50 | 1.35 | 0.63 |
| Converted photons, GeV | |||||
|---|---|---|---|---|---|
| range | 0–0.6 | 0.6–1 | 1–1.37 | 1.55–1.82 | 1.82–2.47 |
| calibration | 0.03 | 0.04 | 0.08 | 0.22 | 0.05 |
| Gain, pedestal | 0.03 | 0.02 | 0.01 | 0.86 | 0.06 |
| Layer calibration | 0.03 | 0.05 | 0.06 | 0.11 | 0.05 |
| ID material | 0.03 | 0.10 | 0.09 | 0.15 | 0.05 |
| Other material | 0.03 | 0.04 | 0.13 | 0.37 | 0.05 |
| Total | 0.18 | 0.34 | 0.50 | 1.00 | 0.23 |
The uncertainty model developed and summarised here is expected to be valid up to GeV. At these energies, the contribution of the third calorimeter layer to the energy measurement is enhanced, and a significant fraction of electrons and photons are recorded in low gain. These aspects are not addressed in this paper.
11 Electron calibration cross-checks
At this point, the electron energy scale is fully specified; after all corrections are applied, the energy response is expected to be linear and uniform. The objective of the present section is to test the extrapolation to different regimes using additional probes.
11.1 Energy scale from
The results presented here are based on the sample described together with the selection criteria in Table 1, and consisting of about 185K events. After selections [12], the average electron transverse energy is GeV, making this sample a useful test of the energy response in the low energy range where electrons from decays are not available.
The invariant mass distribution of the events selected in the data sample shows a sizeable background contribution and a hint of the resonance. To disentangle these contributions, the Monte Carlo signal is parameterised by an empirical function taking into account the Gaussian core of the peak and the non-Gaussian tails. The parameterised signal is used as input for a fit to the data to extract the combinatorial background, parameterised as a second-order polynomial, and the contribution. The peak position is unconstrained, and the resonance is assumed to be identical to that of the signal, up to a scaling of the mass and the corresponding expected change in resolution.
The events are categorised as a function of electron pseudorapidity as in Sect. 9. For each () category, the electron pair invariant mass PDF, , is built from the fitted signal and background components. The electron energy scale factors are extracted using a simultaneous fit using the likelihood function given in Eq. (11).
The statistical uncertainty on the electron energy scale extraction amounts to 0.1% to 0.2%, depending on pseudorapidity. The main source of systematic uncertainty is induced by the imperfect modelling of the electron isolation. The sample results from direct production and from decays; in the latter process, the electrons are produced in the vicinity of jets, which contribute to the measured electron cluster energy. The uncertainty on the relative fractions of the two processes and on the modelling of the jet contribution to the electron energy contributes an uncertainty of 0.2%.
The fit results are shown in Fig. 30, and are compared to the expected uncertainties, composed of scale uncertainties, PS and L1/L2 intercalibration, and passive-material uncertainties extrapolated to GeV. The uncertainties on the energy scales determined from the sample include the contributions discussed above. Satisfactory agreement is obtained, although the results tend to be higher than the ones by about one standard deviation. The residual differences in the central region can be explained by an imperfect calibration of the cell response, associated to a difference of the read-out pedestals in physics and calibration runs. This small bias is understood as resulting from a different setting of the electronics configuration used in both cases. In the region , the differences are most probably related to residual uncertainties in the detector material description. Figure 31 shows the electron pair invariant mass distribution in data and MC simulation, and the data/MC ratio as a function of after energy corrections. The corrected data and the simulation agree within uncertainties across the mass window used in the analysis.
11.2 Energy linearity in events and overall electron calibration accuracy
Finally, a study of the energy dependence of the calibration is performed. The and analyses of Sects. 9, 11.1 are repeated, now categorising the electrons in broad intervals of , with the following boundaries:
- •
: 0 - 0.6 - 1 - 1.37 - 1.55 - 1.82 - 2.47.
In addition, the sample is subdivided in electron intervals:
- •
: 27 - 35 - 42 - 50 - 100 GeV.
The analysis is performed after applying all corrections derived above, so that the energy scale corrections derived here are expected to be close to zero and constant. The results are shown in Fig. 32. In all cases, the resulting energy scales lie within the calibration systematic uncertainty envelopes.
12 Photon-specific uncertainties
12.1 Conversion reconstruction inefficiency and fake conversions
| Uncertainty | ||||
|---|---|---|---|---|
| Inefficiency | ||||
| Fake Rate |
| Particle type | |||
|---|---|---|---|
| , converted | |||
| , unconverted |
The fraction of photons that convert to electron–positron pairs before reaching the calorimeter is directly connected to the amount of material upstream. The efficiency to reconstruct the corresponding tracks and match them to clusters is close to unity for conversions in the innermost layers of the detector and drops at larger radii, in the region instrumented by the TRT. The energy of true converted photons reconstructed as unconverted is typically underestimated by about 2%, depending on , and the radius of the conversion. On the other hand, wrong associations between tracks induced by pile-up interactions or fake tracks and clusters lead to “fake conversions” that induce around 2% overestimation of the energy. This effect is also more frequent for tracks reconstructed in the TRT due to the imprecise measurement of .
Both effects impact the absolute photon energy scale if the efficiency and fake rates are imperfectly described by the simulation. Systematic uncertainties associated with these quantities were estimated by comparing the conversion rates in data and MC simulation, and using a template method based on the ratio . The latter exhibits a different behaviour for photons that do or do not convert before the calorimeter and therefore is sensitive to the “true” conversion status of the photon. By combining the true and reconstructed conversion status, one can determine the reconstruction efficiency and fake rate in data. The method can also provide an estimate of the material upstream and could be used in the future to constrain this quantity.
The study was performed in four bins (0–0.6, 0.6–1.37, 1.52–1.81, 1.81–2.37) using the same event selection as typically adopted by the analysis [36]. Events with two photon candidates satisfying tight identification criteria based on calorimeter shower shapes and both track- and calorimeter-based isolation were considered. The ratio of the transverse momenta of the photons to the diphoton invariant mass, , was required to be above 0.35 and 0.25 for the leading and subleading photons, respectively, with GeV 160 GeV. The study was limited to the leading photon of each event in order to limit contamination by jets misidentified as photons, estimated to be %. This jet background is subtracted in each bin using a sideband method based on the identification and isolation criteria [16]. The contribution of Drell–Yan events was estimated to be % using MC simulation. Systematic uncertainties associated with imperfect knowledge of and the material upstream were propagated to the templates and the expected conversion rate in each bin.
The results point to inefficiencies and fake rates that exceed by up to a few percent the predictions from MC simulation. The impact on the energy scale of unconverted (converted) photons from the additional inefficiency (fake rate) is shown in Table 7. It is typically around few depending on and , and reaches in the bin around GeV.
12.2 Lateral leakage mis-modelling
Electrons and photons deposit about 6% of their energy outside of the cluster used in the reconstruction, depending on pseudorapidity and particle type. Although this effect is to first order taken into account by the MC calibration, a calibration bias could appear in the case of imperfect modelling of lateral shower development, as the energy loss would be different in data and simulation.
The energy scale factors obtained from the -based effective calibration described in Sect. 9 absorb such discrepancies. The energy dependence of the difference between data and simulation for electron lateral leakage was investigated and found to be negligible. Therefore the only component yet to be determined is the mis-modelling difference between electrons and photons.
The and samples are used to estimate this difference. The energy of the decay electrons and radiative photons in the nominal cluster size is compared to the energy found in a larger window of size cells defined around it, using only cells in L2. The normalised difference between electrons and photons,
| (13) | |||||
is estimated for three pseudorapidity intervals, separating unconverted and converted photons.
The effect of the mis-modelling of photon conversion reconstruction is tested by correcting the fraction of converted photons in simulation according to the results of Sect. 12.1, and is evaluated with and without this correction. Table 8 shows the most conservative values obtained for each bin and photon type according to this procedure.
The most significant effects found are % for converted photons within , and % for unconverted photons in the same pseudorapidity bin. The systematic uncertainty on the photon energy scale related to this effect is defined in each bin as the larger of and its uncertainty. This uncertainty is assumed to not depend on the photon transverse energy.
13 Photon calibration cross-checks
The energy scale factors extracted in Sect. 9 are expected to be valid for electrons and photons. Their universality is tested using photons from radiative decays in the electron and muon channels, separately for unconverted, one-track and two-track converted photons. A first selection requires a large-angle separation between the radiative photon and the leptons and is applied in the electron and muon channels, and for converted and unconverted photons; a sample of unconverted collinear photons is also selected in the muon channel [37]. The event selection is detailed in Table 1; the photon purity in the various samples is estimated to range between 97% and 99%. Figure 33 shows the three-body invariant mass distributions for converted and unconverted photons in data and MC simulation for large-angle events in the electron and muon channels after all energy corrections are applied.
Residual mis-calibrations between data and MC simulation are parameterised following , similar to the procedure applied to electrons from decays in Sect. 9. Here, and are photon energies in region for MC simulation and data respectively, and measures the residual photon energy mis-calibration. For each applied to data, the three-body invariant mass is recomputed; its agreement with MC simulation is quantified using a double ratio method,
| (14) |
where and are the mean values of the three-body and two-body invariant masses in the radiative and non-radiative samples, respectively. Taking the ratio of to in the numerator suppresses the lepton energy scale uncertainties; normalising this ratio to the MC expectation removes possible biases due to the different lepton kinematics in and events. The value of that provides the best agreement in the distributions with defines the photon energy scale. The photon energy scales are separately derived for non-collinear and events for both unconverted and converted photons, while collinear events are only used for unconverted photons. The energy scales from the different event topologies are then combined.
Several sources of systematic uncertainty are considered in this study: background contamination, fit range, muon momentum scale and resolution in the channel and electron energy scale and resolution in the channel. The total systematic uncertainty is of the order of % while the statistical uncertainty ranges between 0.2% and 1.5% depending on the pseudorapidity and on the photon conversion type. Figure 34 shows the combined photon energy scales as a function of both and , separately for unconverted, single- and double-track converted photons. The bands around zero represent the calibration systematic uncertainty, including contributions discussed in Sects. 10 and 12. The measured photon energy scales agree with the expectation within uncertainties.
14 Resolution accuracy
The main way to probe the resolution in data is provided by the study of the resonance width, which provides a constraint on the total resolution at given and for GeV, the average transverse energy of electrons from decays. The resolution corrections are derived in Sect. 9 as an effective constant term to be added in quadrature to the expected resolution. However, as is the case for the energy scales, absorbs the potential mis-modelling of the resolution sampling term, the electronics noise term, the asymptotic resolution at high energy, and the effect of passive material upstream of the calorimeter. Uncertainties related to these sources thus reappear when considering different energies or particle types.
The calorimeter intrinsic resolution, defined as the expected resolution in the absence of upstream material and with perfect response uniformity, is a function of and scales as 1/. A 10% uncertainty is assumed from test-beam studies [35] and from simulation predictions obtained by varying the physics modelling options in Geant4. Taking into account that the resolution is constrained at GeV, the uncertainty on the squared resolution induced by a 10% relative increase in the intrinsic resolution is:
| (15) | |||||
where is the intrinsic resolution (in units of GeV), and can be positive or negative depending on particle type and energy. Equation (15) is obtained by varying the sampling term by 10% in Eq. (2) and requiring that the total resolution is unchanged at GeV.
The resolution noise term scales as for pile-up noise and for electronic noise, and mostly matters at low energy. It receives contributions from the read-out electronics and pile-up. A measurement of the total noise affecting electron and photon clusters is performed by comparing pile-up-only events in data and simulation. Random clusters of the size used for electrons and photons are drawn over , and the noise is defined as the spread of the cluster transverse energy distribution. The noise systematic uncertainty is defined as the difference in quadrature between in data and simulation. An uncertainty of MeV is found across , apart for where MeV is appropriate. Its impact is
| (16) |
The impact of detector material uncertainty on the resolution is treated as follows. Assuming the ID, cryostat and calorimeter material uncertainties discussed in Sect. 8, samples are simulated with corresponding geometry distortions. The distorted geometry samples are used as pseudo-data, and the impact of the additional passive material on the reconstructed invariant mass distribution is calculated as in Sect. 9.1, yielding a material-induced constant term correction. This correction is applied to simulated particles in the nominal geometry; subtracting the result in quadrature from the actual particle resolution obtained in the distorted simulation yields the material contribution to the resolution uncertainty. The impact is
| (17) |
where is the material-induced resolution correction obtained as described above. The resolutions and are parameterised for electrons and photons separately; hence depends on particle type, energy and .
A given uncertainty source ( = , int, mat, noise) contributes to a change in the squared resolution. Its contribution to the total resolution uncertainty is
| (18) |
where is the nominal energy resolution. The summed in quadrature give the total resolution uncertainty.
The resolution curve is shown for electrons and unconverted photons in Fig. 35, as a function of energy for . The different contributions to the resolution uncertainty are shown in Fig. 36. The relative uncertainty is minimal for electrons at GeV, where the measurement of translates into an uncertainty of 5%. At higher transverse energy, the sampling term and detector material contributions are significant; at low energy, the pile-up contribution dominates. For unconverted photons, the uncertainty is about 10% for GeV.
The asymptotic resolution uncertainty is given by the accuracy of the constants, which are determined at GeV. At high energy, the increased contribution of the third sampling and the turn-on of low-gain amplification (mentioned in Section 10) are not expected to generate energy fluctuations that invalidate this model.
15 Energy–momentum combination
Combining the track momentum and cluster energy measurements improves the electron energy resolution, in particular for electrons of low energy. For electrons, the momentum provided by the ID provides the best measurement for low- particles, whereas the calorimeter energy measurement is superior at high . The combination also improves the electron resolution in the transition region of the electromagnetic calorimeter, . This method is not applied for .
The method relies on the ID momentum and calorimeter energy response functions determined from simulation. Electrons are categorised according to transverse momentum (, , ) and pseudorapidity (, , , ). For each category, the distributions of and are parameterised using Crystal Ball functions. The following likelihood is then maximised for a given electron candidate:
| (19) |
where and represent the ID and EM calorimeter response functions, and represents the combined transverse momentum. The combined transverse momentum is given by the value of for which is maximal.
The results are illustrated in Fig. 37. In the low range, the performance of the combination algorithm is assessed using events. The invariant mass resolution is improved by about 20% and the low-mass tails are significantly reduced. A significant improvement is also obtained for decay electrons in the calorimeter barrel–endcap transition region where the tracking information compensates for the locally poor energy measurement.
Energy–momentum combination is applied in measurements involving final states with low- electrons, such as Higgs boson decays to four leptons [36]. The systematic uncertainty on the combined momentum is given by the cluster energy scale uncertainty summarised in Sect. 10, and by the momentum scale uncertainty. The latter is assessed using events reconstructed using ID information only. Comparing the position of the electron pair invariant mass peak in data and simulation yields a systematic uncertainty ranging from about 0.1% near to about 1% in the barrel–endcap transition region. The cluster energy and track momentum systematic uncertainties are combined in quadrature to obtain the total uncertainty on the combined energy–momentum scale.
16 Summary
The calibration procedure for electron and photon energy measurement with the ATLAS detector is presented using LHC Run 1 proton–proton collision data corresponding to a total integrated luminosity of about 25 fb-1 taken at centre-of-mass energies of TeV and TeV. The calorimeter energy measurement is optimised on simulation using MVA techniques, improving the energy resolution with respect to the previous calibration approach [3] by about 10% (20%) for unconverted (converted) photons; for electrons, the improvement ranges from a few percent in most of the acceptance up to 30% in the region with the largest amount of material upstream of the active calorimeter, .
The calorimeter energy response in data is stable at the level of 0.05% as a function of time and pile-up. After corrections for local mechanical and high-voltage defects, the azimuthal non-uniformity is less than 0.5% in the barrel, and less than 0.75% in the endcap, meeting the original design goals. The relative response of the calorimeter layers is analysed, notably correcting a bias of about 3% in the barrel. After calibration corrections, the shower depth is used to probe the amount of material upstream of the calorimeter with a typical accuracy of 310%, depending on pseudorapidity; the detector material description is adjusted accordingly. The MVA calibration is optimised with the improved simulation, and the calorimeter absolute energy scale is determined using electron pairs from boson decays.
This procedure yields definite predictions for the energy dependence of the electron and photon calibration and its uncertainty. The uncertainty for electrons at GeV is on average 0.04% for , 0.2% for and 0.05% for . At GeV, the electron response uncertainty ranges from 0.4% to 1% for , is about 1.1% for , and again 0.4% for . The photon energy scale uncertainty is typically 0.2% to 0.3% for and ; for , the uncertainty is 0.9% and 0.4% for unconverted and converted photons, respectively. Outside of this range, similar accuracy is achieved for converted and unconverted photons, and the energy dependence is weak. The electron and photon calibration is confirmed using independent resonances provided by events and boson radiative decays. The present energy scale uncertainty model is expected to be valid up to GeV.
Finally, the relative uncertainty on the energy resolution is better than 10% for GeV, and asymptotically rises to about 40% at high energy. For analyses involving low- electrons, an energy–momentum combination algorithm is defined, which improves the electron energy resolution obtained from the calorimeter cluster by about 20% for GeV and .
The present results form the basis of ATLAS precision measurements using electrons and photons in LHC Run-1 data.
Acknowledgements
We thank CERN for the very successful operation of the LHC, as well as the support staff from our institutions without whom ATLAS could not be operated efficiently.
We acknowledge the support of ANPCyT, Argentina; YerPhI, Armenia; ARC, Australia; BMWFW and FWF, Austria; ANAS, Azerbaijan; SSTC, Belarus; CNPq and FAPESP, Brazil; NSERC, NRC and CFI, Canada; CERN; CONICYT, Chile; CAS, MOST and NSFC, China; COLCIENCIAS, Colombia; MSMT CR, MPO CR and VSC CR, Czech Republic; DNRF, DNSRC and Lundbeck Foundation, Denmark; EPLANET, ERC and NSRF, European Union; IN2P3-CNRS, CEA-DSM/IRFU, France; GNSF, Georgia; BMBF, DFG, HGF, MPG and AvH Foundation, Germany; GSRT and NSRF, Greece; ISF, MINERVA, GIF, I-CORE and Benoziyo Center, Israel; INFN, Italy; MEXT and JSPS, Japan; CNRST, Morocco; FOM and NWO, Netherlands; BRF and RCN, Norway; MNiSW and NCN, Poland; GRICES and FCT, Portugal; MNE/IFA, Romania; MES of Russia and ROSATOM, Russian Federation; JINR; MSTD, Serbia; MSSR, Slovakia; ARRS and MIZŠ, Slovenia; DST/NRF, South Africa; MINECO, Spain; SRC and Wallenberg Foundation, Sweden; SER, SNSF and Cantons of Bern and Geneva, Switzerland; NSC, Taiwan; TAEK, Turkey; STFC, the Royal Society and Leverhulme Trust, United Kingdom; DOE and NSF, United States of America.
The crucial computing support from all WLCG partners is acknowledged gratefully, in particular from CERN and the ATLAS Tier-1 facilities at TRIUMF (Canada), NDGF (Denmark, Norway, Sweden), CC-IN2P3 (France), KIT/GridKA (Germany), INFN-CNAF (Italy), NL-T1 (Netherlands), PIC (Spain), ASGC (Taiwan), RAL (UK) and BNL (USA) and in the Tier-2 facilities worldwide.
Appendix A Calibration results using 2011 data
The calibration procedure described in this paper was applied to 4.7 fb-1 of data collected at 7 TeV, and the same cross-check measurements are carried out. The event selections are modified to account for the different trigger conditions, yielding a sample of about 1.1M events, 100K events and 90K events.
The intercalibration constants and effective smearing corrections are shown in Figs. 38 and 39. The binning in pseudorapidity is identical to that used in the 8 TeV data analysis. The features observed with the 2011 data are similar to those observed in 2012, up to small differences expected from the lower pile-up conditions and changes in the OFC optimisation procedure.
The energy scale uniformity obtained using events, after application of the full calibration chain, is shown in Fig. 40. As in 2012, the results agree within uncertainties, although a bias of one standard deviation is observed for .
The energy-dependent analysis is illustrated in Fig. 41. The analysis is performed in four bins, namely 27–35–42–50–100 GeV. For , an observed energy dependence of the energy scale of about 1% leads to an increased systematic uncertainty in this region; outside of the transition region, the results are consistent with the -based calibration independently of and .
The radiative photon energy scale derived using is shown in Fig. 42. For unconverted photons, the results agree with expectations. The discrepancy between the energy scales obtained for converted photons and the -based calibration is within two standard deviations.
References
- (1) ATLAS Collaboration, Phys. Lett. B716, 1 (2012), arXiv:1207.7214[hep-ex]
- (2) CMS Collaboration, Phys. Lett. B716, 30 (2012), arXiv:1207.7235[hep-ex]
- (3) ATLAS Collaboration, Eur. Phys. J. C72, 1909 (2012), arXiv:1110.3174
- (4) ATLAS Collaboration, JINST 3, S08003 (2008)
- (5) ATLAS Collaboration, ATL-PHYS-PUB-2011-007, https://cdsweb.cern.ch/record/1345329
- (6) H. Abreu et al., JINST 5, 09, P09003 (2010), http://stacks.iop.org/1748-0221/5/i=09/a=P09003
- (7) ATLAS Collaboration, Eur. Phys. J. C70, 3, 723 (2010), http://dx.doi.org/10.1140/epjc/s10052-010-1354-y
- (8) W. E. Cleland and E. G. Stern, Nucl. Inst. Methods A338, 467 (1994)
- (9) M. Aharrouche et al., Nucl. Inst. Methods A614, 400 (2010)
- (10) W. Lampl et al., ATL-LARG-PUB-2008-002, https://cds.cern.ch/record/1099735
- (11) ATLAS Collaboration, submitted to JINST, arXiv:1405.3768[hep-ex]
- (12) ATLAS Collaboration, submitted to Eur. Phys. J. C, arXiv:1404.2240[hep-ex]
- (13) ATLAS Collaboration, ATLAS-CONF-2014-032, https://cds.cern.ch/record/1700316
- (14) ATLAS Collaboration, ATLAS-CONF-2012-123, https://cds.cern.ch/record/1473426
- (15) M. Cacciari, G. Salam and S. Sapeta, JHEP 04, 065 (2010), http://dx.doi.org/10.1007/JHEP04%282010%29065
- (16) ATLAS Collaboration, Phys. Rev. D83, 052005 (2011), arXiv:1012.4389[hep-ex]
- (17) A. Hoecker et al., PoS ACAT, 040 (2007), arXiv:0703039[physics], http://tmva.sourceforge.net/
- (18) T. Gleisberg et al., JHEP 0902, 007 (2009), arXiv:0811.4622[hep-ex]
- (19) P. Nason, JHEP 0411, 040 (2004), arXiv:0409146[hep-ph]
- (20) S. Frixione, P. Nason and C. Oleari, JHEP 0711, 070 (2007), arXiv:0709.2092[hep-ph]
- (21) S. Alioli et al., JHEP 1006, 043 (2010), arXiv:1002.2581[hep-ph]
- (22) S. Alioli et al., JHEP 0807, 060 (2008), arXiv:0805.4802[hep-ph]
- (23) T. Sjostrand, S. Mrenna and P. Z. Skands, Comput. Phys. Commun. 178, 852 (2008), arXiv:0710.3820[hep-ph]
- (24) ATLAS Collaboration, Eur. Phys. J. C70, 823 (2010), arXiv:1005.4568[physics.ins-det]
- (25) J. Allison et al., Nuclear Science, IEEE Transactions on 53, 1, 270 (2006)
- (26) ATLAS Collaboration, Phys. Lett. B688, 21 (2010), arXiv:1003.3124[hep-ex]
- (27) ATLAS Collaboration, New J. Phys. 13, 053033 (2011), arXiv:1012.5104[hep-ex]
- (28) ATLAS Collaboration, ATLAS-CONF-2010-019, https://cds.cern.ch/record/1277651
- (29) ATLAS Collaboration, JINST 7, P01013 (2012), arXiv:1110.6191[hep-ex]
- (30) ATLAS Collaboration, ATLAS-CONF-2010-007 https://cds.cern.ch/record/1274001
- (31) ATLAS Collaboration, ATLAS-CONF-2010-037, https://cds.cern.ch/record/1277677
- (32) S. Frixione and B. R. Webber, JHEP 06, 029 (2002)
- (33) ATLAS Collaboration, arXiv:0901.0512[hep-ex]
- (34) J. Colas et al., Nucl. Inst. Methods A582, 429 (2007), arXiv:0709.1094[physics.ins-det]
- (35) M. Aharrouche et al., Nucl. Inst. Methods A568, 601 (2006), arXiv:0608012[physics]
- (36) ATLAS Collaboration, submitted to Phys. Rev. D, arXiv:1406.3827[hep-ex]
- (37) ATLAS Collaboration, ATLAS-CONF-2012-143, https://cds.cern.ch/record/1491697
The ATLAS Collaboration
G. Aad84, B. Abbott112, J. Abdallah152, S. Abdel Khalek116, O. Abdinov11, R. Aben106, B. Abi113, M. Abolins89, O.S. AbouZeid159, H. Abramowicz154, H. Abreu153, R. Abreu30, Y. Abulaiti147a,147b, B.S. Acharya165a,165b,a, L. Adamczyk38a, D.L. Adams25, J. Adelman177, S. Adomeit99, T. Adye130, T. Agatonovic-Jovin13a, J.A. Aguilar-Saavedra125a,125f, M. Agustoni17, S.P. Ahlen22, F. Ahmadov64,b, G. Aielli134a,134b, H. Akerstedt147a,147b, T.P.A. Åkesson80, G. Akimoto156, A.V. Akimov95, G.L. Alberghi20a,20b, J. Albert170, S. Albrand55, M.J. Alconada Verzini70, M. Aleksa30, I.N. Aleksandrov64, C. Alexa26a, G. Alexander154, G. Alexandre49, T. Alexopoulos10, M. Alhroob165a,165c, G. Alimonti90a, L. Alio84, J. Alison31, B.M.M. Allbrooke18, L.J. Allison71, P.P. Allport73, J. Almond83, A. Aloisio103a,103b, A. Alonso36, F. Alonso70, C. Alpigiani75, A. Altheimer35, B. Alvarez Gonzalez89, M.G. Alviggi103a,103b, K. Amako65, Y. Amaral Coutinho24a, C. Amelung23, D. Amidei88, S.P. Amor Dos Santos125a,125c, A. Amorim125a,125b, S. Amoroso48, N. Amram154, G. Amundsen23, C. Anastopoulos140, L.S. Ancu49, N. Andari30, T. Andeen35, C.F. Anders58b, G. Anders30, K.J. Anderson31, A. Andreazza90a,90b, V. Andrei58a, X.S. Anduaga70, S. Angelidakis9, I. Angelozzi106, P. Anger44, A. Angerami35, F. Anghinolfi30, A.V. Anisenkov108, N. Anjos125a, A. Annovi47, A. Antonaki9, M. Antonelli47, A. Antonov97, J. Antos145b, F. Anulli133a, M. Aoki65, L. Aperio Bella18, R. Apolle119,c, G. Arabidze89, I. Aracena144, Y. Arai65, J.P. Araque125a, A.T.H. Arce45, J-F. Arguin94, S. Argyropoulos42, M. Arik19a, A.J. Armbruster30, O. Arnaez30, V. Arnal81, H. Arnold48, M. Arratia28, O. Arslan21, A. Artamonov96, G. Artoni23, S. Asai156, N. Asbah42, A. Ashkenazi154, B. Åsman147a,147b, L. Asquith6, K. Assamagan25, R. Astalos145a, M. Atkinson166, N.B. Atlay142, B. Auerbach6, K. Augsten127, M. Aurousseau146b, G. Avolio30, G. Azuelos94,d, Y. Azuma156, M.A. Baak30, A. Baas58a, C. Bacci135a,135b, H. Bachacou137, K. Bachas155, M. Backes30, M. Backhaus30, J. Backus Mayes144, E. Badescu26a, P. Bagiacchi133a,133b, P. Bagnaia133a,133b, Y. Bai33a, T. Bain35, J.T. Baines130, O.K. Baker177, P. Balek128, F. Balli137, E. Banas39, Sw. Banerjee174, A.A.E. Bannoura176, V. Bansal170, H.S. Bansil18, L. Barak173, S.P. Baranov95, E.L. Barberio87, D. Barberis50a,50b, M. Barbero84, T. Barillari100, M. Barisonzi176, T. Barklow144, N. Barlow28, B.M. Barnett130, R.M. Barnett15, Z. Barnovska5, A. Baroncelli135a, G. Barone49, A.J. Barr119, F. Barreiro81, J. Barreiro Guimarães da Costa57, R. Bartoldus144, A.E. Barton71, P. Bartos145a, V. Bartsch150, A. Bassalat116, A. Basye166, R.L. Bates53, J.R. Batley28, M. Battaglia138, M. Battistin30, F. Bauer137, H.S. Bawa144,e, M.D. Beattie71, T. Beau79, P.H. Beauchemin162, R. Beccherle123a,123b, P. Bechtle21, H.P. Beck17, K. Becker176, S. Becker99, M. Beckingham171, C. Becot116, A.J. Beddall19c, A. Beddall19c, S. Bedikian177, V.A. Bednyakov64, C.P. Bee149, L.J. Beemster106, T.A. Beermann176, M. Begel25, K. Behr119, C. Belanger-Champagne86, P.J. Bell49, W.H. Bell49, G. Bella154, L. Bellagamba20a, A. Bellerive29, M. Bellomo85, K. Belotskiy97, O. Beltramello30, O. Benary154, D. Benchekroun136a, K. Bendtz147a,147b, N. Benekos166, Y. Benhammou154, E. Benhar Noccioli49, J.A. Benitez Garcia160b, D.P. Benjamin45, J.R. Bensinger23, K. Benslama131, S. Bentvelsen106, D. Berge106, E. Bergeaas Kuutmann16, N. Berger5, F. Berghaus170, J. Beringer15, C. Bernard22, P. Bernat77, C. Bernius78, F.U. Bernlochner170, T. Berry76, P. Berta128, C. Bertella84, G. Bertoli147a,147b, F. Bertolucci123a,123b, C. Bertsche112, D. Bertsche112, M.I. Besana90a, G.J. Besjes105, O. Bessidskaia147a,147b, M. Bessner42, N. Besson137, C. Betancourt48, S. Bethke100, W. Bhimji46, R.M. Bianchi124, L. Bianchini23, M. Bianco30, O. Biebel99, S.P. Bieniek77, K. Bierwagen54, J. Biesiada15, M. Biglietti135a, J. Bilbao De Mendizabal49, H. Bilokon47, M. Bindi54, S. Binet116, A. Bingul19c, C. Bini133a,133b, C.W. Black151, J.E. Black144, K.M. Black22, D. Blackburn139, R.E. Blair6, J.-B. Blanchard137, T. Blazek145a, I. Bloch42, C. Blocker23, W. Blum82,∗, U. Blumenschein54, G.J. Bobbink106, V.S. Bobrovnikov108, S.S. Bocchetta80, A. Bocci45, C. Bock99, C.R. Boddy119, M. Boehler48, T.T. Boek176, J.A. Bogaerts30, A.G. Bogdanchikov108, A. Bogouch91,∗, C. Bohm147a, J. Bohm126, V. Boisvert76, T. Bold38a, V. Boldea26a, A.S. Boldyrev98, M. Bomben79, M. Bona75, M. Boonekamp137, A. Borisov129, G. Borissov71, M. Borri83, S. Borroni42, J. Bortfeldt99, V. Bortolotto135a,135b, K. Bos106, D. Boscherini20a, M. Bosman12, H. Boterenbrood106, J. Boudreau124, J. Bouffard2, E.V. Bouhova-Thacker71, D. Boumediene34, C. Bourdarios116, N. Bousson113, S. Boutouil136d, A. Boveia31, J. Boyd30, I.R. Boyko64, J. Bracinik18, A. Brandt8, G. Brandt15, O. Brandt58a, U. Bratzler157, B. Brau85, J.E. Brau115, H.M. Braun176,∗, S.F. Brazzale165a,165c, B. Brelier159, K. Brendlinger121, A.J. Brennan87, R. Brenner167, S. Bressler173, K. Bristow146c, T.M. Bristow46, D. Britton53, F.M. Brochu28, I. Brock21, R. Brock89, C. Bromberg89, J. Bronner100, G. Brooijmans35, T. Brooks76, W.K. Brooks32b, J. Brosamer15, E. Brost115, J. Brown55, P.A. Bruckman de Renstrom39, D. Bruncko145b, R. Bruneliere48, S. Brunet60, A. Bruni20a, G. Bruni20a, M. Bruschi20a, L. Bryngemark80, T. Buanes14, Q. Buat143, F. Bucci49, P. Buchholz142, R.M. Buckingham119, A.G. Buckley53, S.I. Buda26a, I.A. Budagov64, F. Buehrer48, L. Bugge118, M.K. Bugge118, O. Bulekov97, A.C. Bundock73, H. Burckhart30, S. Burdin73, B. Burghgrave107, S. Burke130, I. Burmeister43, E. Busato34, D. Büscher48, V. Büscher82, P. Bussey53, C.P. Buszello167, B. Butler57, J.M. Butler22, A.I. Butt3, C.M. Buttar53, J.M. Butterworth77, P. Butti106, W. Buttinger28, A. Buzatu53, M. Byszewski10, S. Cabrera Urbán168, D. Caforio20a,20b, O. Cakir4a, P. Calafiura15, A. Calandri137, G. Calderini79, P. Calfayan99, R. Calkins107, L.P. Caloba24a, D. Calvet34, S. Calvet34, R. Camacho Toro49, S. Camarda42, D. Cameron118, L.M. Caminada15, R. Caminal Armadans12, S. Campana30, M. Campanelli77, A. Campoverde149, V. Canale103a,103b, A. Canepa160a, M. Cano Bret75, J. Cantero81, R. Cantrill125a, T. Cao40, M.D.M. Capeans Garrido30, I. Caprini26a, M. Caprini26a, M. Capua37a,37b, R. Caputo82, R. Cardarelli134a, T. Carli30, G. Carlino103a, L. Carminati90a,90b, S. Caron105, E. Carquin32a, G.D. Carrillo-Montoya146c, J.R. Carter28, J. Carvalho125a,125c, D. Casadei77, M.P. Casado12, M. Casolino12, E. Castaneda-Miranda146b, A. Castelli106, V. Castillo Gimenez168, N.F. Castro125a, P. Catastini57, A. Catinaccio30, J.R. Catmore118, A. Cattai30, G. Cattani134a,134b, S. Caughron89, V. Cavaliere166, D. Cavalli90a, M. Cavalli-Sforza12, V. Cavasinni123a,123b, F. Ceradini135a,135b, B. Cerio45, K. Cerny128, A.S. Cerqueira24b, A. Cerri150, L. Cerrito75, F. Cerutti15, M. Cerv30, A. Cervelli17, S.A. Cetin19b, A. Chafaq136a, D. Chakraborty107, I. Chalupkova128, P. Chang166, B. Chapleau86, J.D. Chapman28, D. Charfeddine116, D.G. Charlton18, C.C. Chau159, C.A. Chavez Barajas150, S. Cheatham86, A. Chegwidden89, S. Chekanov6, S.V. Chekulaev160a, G.A. Chelkov64,f, M.A. Chelstowska88, C. Chen63, H. Chen25, K. Chen149, L. Chen33d,g, S. Chen33c, X. Chen146c, Y. Chen66, Y. Chen35, H.C. Cheng88, Y. Cheng31, A. Cheplakov64, R. Cherkaoui El Moursli136e, V. Chernyatin25,∗, E. Cheu7, L. Chevalier137, V. Chiarella47, G. Chiefari103a,103b, J.T. Childers6, A. Chilingarov71, G. Chiodini72a, A.S. Chisholm18, R.T. Chislett77, A. Chitan26a, M.V. Chizhov64, S. Chouridou9, B.K.B. Chow99, D. Chromek-Burckhart30, M.L. Chu152, J. Chudoba126, J.J. Chwastowski39, L. Chytka114, G. Ciapetti133a,133b, A.K. Ciftci4a, R. Ciftci4a, D. Cinca53, V. Cindro74, A. Ciocio15, P. Cirkovic13b, Z.H. Citron173, M. Citterio90a, M. Ciubancan26a, A. Clark49, P.J. Clark46, R.N. Clarke15, W. Cleland124, J.C. Clemens84, C. Clement147a,147b, Y. Coadou84, M. Cobal165a,165c, A. Coccaro139, J. Cochran63, L. Coffey23, J.G. Cogan144, J. Coggeshall166, B. Cole35, S. Cole107, A.P. Colijn106, J. Collot55, T. Colombo58c, G. Colon85, G. Compostella100, P. Conde Muiño125a,125b, E. Coniavitis48, M.C. Conidi12, S.H. Connell146b, I.A. Connelly76, S.M. Consonni90a,90b, V. Consorti48, S. Constantinescu26a, C. Conta120a,120b, G. Conti57, F. Conventi103a,h, M. Cooke15, B.D. Cooper77, A.M. Cooper-Sarkar119, N.J. Cooper-Smith76, K. Copic15, T. Cornelissen176, M. Corradi20a, F. Corriveau86,i, A. Corso-Radu164, A. Cortes-Gonzalez12, G. Cortiana100, G. Costa90a, M.J. Costa168, D. Costanzo140, D. Côté8, G. Cottin28, G. Cowan76, B.E. Cox83, K. Cranmer109, G. Cree29, S. Crépé-Renaudin55, F. Crescioli79, W.A. Cribbs147a,147b, M. Crispin Ortuzar119, M. Cristinziani21, V. Croft105, G. Crosetti37a,37b, C.-M. Cuciuc26a, T. Cuhadar Donszelmann140, J. Cummings177, M. Curatolo47, C. Cuthbert151, H. Czirr142, P. Czodrowski3, Z. Czyczula177, S. D’Auria53, M. D’Onofrio73, M.J. Da Cunha Sargedas De Sousa125a,125b, C. Da Via83, W. Dabrowski38a, A. Dafinca119, T. Dai88, O. Dale14, F. Dallaire94, C. Dallapiccola85, M. Dam36, A.C. Daniells18, M. Dano Hoffmann137, V. Dao48, G. Darbo50a, S. Darmora8, J.A. Dassoulas42, A. Dattagupta60, W. Davey21, C. David170, T. Davidek128, E. Davies119,c, M. Davies154, O. Davignon79, A.R. Davison77, P. Davison77, Y. Davygora58a, E. Dawe143, I. Dawson140, R.K. Daya-Ishmukhametova85, K. De8, R. de Asmundis103a, S. De Castro20a,20b, S. De Cecco79, N. De Groot105, P. de Jong106, H. De la Torre81, F. De Lorenzi63, L. De Nooij106, D. De Pedis133a, A. De Salvo133a, U. De Sanctis165a,165b, A. De Santo150, J.B. De Vivie De Regie116, W.J. Dearnaley71, R. Debbe25, C. Debenedetti138, B. Dechenaux55, D.V. Dedovich64, I. Deigaard106, J. Del Peso81, T. Del Prete123a,123b, F. Deliot137, C.M. Delitzsch49, M. Deliyergiyev74, A. Dell’Acqua30, L. Dell’Asta22, M. Dell’Orso123a,123b, M. Della Pietra103a,h, D. della Volpe49, M. Delmastro5, P.A. Delsart55, C. Deluca106, S. Demers177, M. Demichev64, A. Demilly79, S.P. Denisov129, D. Derendarz39, J.E. Derkaoui136d, F. Derue79, P. Dervan73, K. Desch21, C. Deterre42, P.O. Deviveiros106, A. Dewhurst130, S. Dhaliwal106, A. Di Ciaccio134a,134b, L. Di Ciaccio5, A. Di Domenico133a,133b, C. Di Donato103a,103b, A. Di Girolamo30, B. Di Girolamo30, A. Di Mattia153, B. Di Micco135a,135b, R. Di Nardo47, A. Di Simone48, R. Di Sipio20a,20b, D. Di Valentino29, F.A. Dias46, M.A. Diaz32a, E.B. Diehl88, J. Dietrich42, T.A. Dietzsch58a, S. Diglio84, A. Dimitrievska13a, J. Dingfelder21, C. Dionisi133a,133b, P. Dita26a, S. Dita26a, F. Dittus30, F. Djama84, T. Djobava51b, M.A.B. do Vale24c, A. Do Valle Wemans125a,125g, T.K.O. Doan5, D. Dobos30, C. Doglioni49, T. Doherty53, T. Dohmae156, J. Dolejsi128, Z. Dolezal128, B.A. Dolgoshein97,∗, M. Donadelli24d, S. Donati123a,123b, P. Dondero120a,120b, J. Donini34, J. Dopke130, A. Doria103a, M.T. Dova70, A.T. Doyle53, M. Dris10, J. Dubbert88, S. Dube15, E. Dubreuil34, E. Duchovni173, G. Duckeck99, O.A. Ducu26a, D. Duda176, A. Dudarev30, F. Dudziak63, L. Duflot116, L. Duguid76, M. Dührssen30, M. Dunford58a, H. Duran Yildiz4a, M. Düren52, A. Durglishvili51b, M. Dwuznik38a, M. Dyndal38a, J. Ebke99, W. Edson2, N.C. Edwards46, W. Ehrenfeld21, T. Eifert144, G. Eigen14, K. Einsweiler15, T. Ekelof167, M. El Kacimi136c, M. Ellert167, S. Elles5, F. Ellinghaus82, N. Ellis30, J. Elmsheuser99, M. Elsing30, D. Emeliyanov130, Y. Enari156, O.C. Endner82, M. Endo117, R. Engelmann149, J. Erdmann177, A. Ereditato17, D. Eriksson147a, G. Ernis176, J. Ernst2, M. Ernst25, J. Ernwein137, D. Errede166, S. Errede166, E. Ertel82, M. Escalier116, H. Esch43, C. Escobar124, B. Esposito47, A.I. Etienvre137, E. Etzion154, H. Evans60, A. Ezhilov122, L. Fabbri20a,20b, G. Facini31, R.M. Fakhrutdinov129, S. Falciano133a, R.J. Falla77, J. Faltova128, Y. Fang33a, M. Fanti90a,90b, A. Farbin8, A. Farilla135a, T. Farooque12, S. Farrell15, S.M. Farrington171, P. Farthouat30, F. Fassi136e, P. Fassnacht30, D. Fassouliotis9, A. Favareto50a,50b, L. Fayard116, P. Federic145a, O.L. Fedin122,j, W. Fedorko169, M. Fehling-Kaschek48, S. Feigl30, L. Feligioni84, C. Feng33d, E.J. Feng6, H. Feng88, A.B. Fenyuk129, S. Fernandez Perez30, S. Ferrag53, J. Ferrando53, A. Ferrari167, P. Ferrari106, R. Ferrari120a, D.E. Ferreira de Lima53, A. Ferrer168, D. Ferrere49, C. Ferretti88, A. Ferretto Parodi50a,50b, M. Fiascaris31, F. Fiedler82, A. Filipčič74, M. Filipuzzi42, F. Filthaut105, M. Fincke-Keeler170, K.D. Finelli151, M.C.N. Fiolhais125a,125c, L. Fiorini168, A. Firan40, A. Fischer2, J. Fischer176, W.C. Fisher89, E.A. Fitzgerald23, M. Flechl48, I. Fleck142, P. Fleischmann88, S. Fleischmann176, G.T. Fletcher140, G. Fletcher75, T. Flick176, A. Floderus80, L.R. Flores Castillo174,k, A.C. Florez Bustos160b, M.J. Flowerdew100, A. Formica137, A. Forti83, D. Fortin160a, D. Fournier116, H. Fox71, S. Fracchia12, P. Francavilla79, M. Franchini20a,20b, S. Franchino30, D. Francis30, L. Franconi118, M. Franklin57, S. Franz61, M. Fraternali120a,120b, S.T. French28, C. Friedrich42, F. Friedrich44, D. Froidevaux30, J.A. Frost28, C. Fukunaga157, E. Fullana Torregrosa82, B.G. Fulsom144, J. Fuster168, C. Gabaldon55, O. Gabizon173, A. Gabrielli20a,20b, A. Gabrielli133a,133b, S. Gadatsch106, S. Gadomski49, G. Gagliardi50a,50b, P. Gagnon60, C. Galea105, B. Galhardo125a,125c, E.J. Gallas119, V. Gallo17, B.J. Gallop130, P. Gallus127, G. Galster36, K.K. Gan110, J. Gao33b,g, Y.S. Gao144,e, F.M. Garay Walls46, F. Garberson177, C. García168, J.E. García Navarro168, M. Garcia-Sciveres15, R.W. Gardner31, N. Garelli144, V. Garonne30, C. Gatti47, G. Gaudio120a, B. Gaur142, L. Gauthier94, P. Gauzzi133a,133b, I.L. Gavrilenko95, C. Gay169, G. Gaycken21, E.N. Gazis10, P. Ge33d, Z. Gecse169, C.N.P. Gee130, D.A.A. Geerts106, Ch. Geich-Gimbel21, K. Gellerstedt147a,147b, C. Gemme50a, A. Gemmell53, M.H. Genest55, S. Gentile133a,133b, M. George54, S. George76, D. Gerbaudo164, A. Gershon154, H. Ghazlane136b, N. Ghodbane34, B. Giacobbe20a, S. Giagu133a,133b, V. Giangiobbe12, P. Giannetti123a,123b, F. Gianotti30, B. Gibbard25, S.M. Gibson76, M. Gilchriese15, T.P.S. Gillam28, D. Gillberg30, G. Gilles34, D.M. Gingrich3,d, N. Giokaris9, M.P. Giordani165a,165c, R. Giordano103a,103b, F.M. Giorgi20a, F.M. Giorgi16, P.F. Giraud137, D. Giugni90a, C. Giuliani48, M. Giulini58b, B.K. Gjelsten118, S. Gkaitatzis155, I. Gkialas155,l, L.K. Gladilin98, C. Glasman81, J. Glatzer30, P.C.F. Glaysher46, A. Glazov42, G.L. Glonti64, M. Goblirsch-Kolb100, J.R. Goddard75, J. Godfrey143, J. Godlewski30, C. Goeringer82, S. Goldfarb88, T. Golling177, D. Golubkov129, A. Gomes125a,125b,125d, L.S. Gomez Fajardo42, R. Gonçalo125a, J. Goncalves Pinto Firmino Da Costa137, L. Gonella21, S. González de la Hoz168, G. Gonzalez Parra12, S. Gonzalez-Sevilla49, L. Goossens30, P.A. Gorbounov96, H.A. Gordon25, I. Gorelov104, B. Gorini30, E. Gorini72a,72b, A. Gorišek74, E. Gornicki39, A.T. Goshaw6, C. Gössling43, M.I. Gostkin64, M. Gouighri136a, D. Goujdami136c, M.P. Goulette49, A.G. Goussiou139, C. Goy5, S. Gozpinar23, H.M.X. Grabas137, L. Graber54, I. Grabowska-Bold38a, P. Grafström20a,20b, K-J. Grahn42, J. Gramling49, E. Gramstad118, S. Grancagnolo16, V. Grassi149, V. Gratchev122, H.M. Gray30, E. Graziani135a, O.G. Grebenyuk122, Z.D. Greenwood78,m, K. Gregersen77, I.M. Gregor42, P. Grenier144, J. Griffiths8, A.A. Grillo138, K. Grimm71, S. Grinstein12,n, Ph. Gris34, Y.V. Grishkevich98, J.-F. Grivaz116, J.P. Grohs44, A. Grohsjean42, E. Gross173, J. Grosse-Knetter54, G.C. Grossi134a,134b, J. Groth-Jensen173, Z.J. Grout150, L. Guan33b, F. Guescini49, D. Guest177, O. Gueta154, C. Guicheney34, E. Guido50a,50b, T. Guillemin116, S. Guindon2, U. Gul53, C. Gumpert44, J. Gunther127, J. Guo35, S. Gupta119, P. Gutierrez112, N.G. Gutierrez Ortiz53, C. Gutschow77, N. Guttman154, C. Guyot137, C. Gwenlan119, C.B. Gwilliam73, A. Haas109, C. Haber15, H.K. Hadavand8, N. Haddad136e, P. Haefner21, S. Hageböck21, Z. Hajduk39, H. Hakobyan178, M. Haleem42, D. Hall119, G. Halladjian89, K. Hamacher176, P. Hamal114, K. Hamano170, M. Hamer54, A. Hamilton146a, S. Hamilton162, G.N. Hamity146c, P.G. Hamnett42, L. Han33b, K. Hanagaki117, K. Hanawa156, M. Hance15, P. Hanke58a, R. Hanna137, J.B. Hansen36, J.D. Hansen36, P.H. Hansen36, K. Hara161, A.S. Hard174, T. Harenberg176, F. Hariri116, S. Harkusha91, D. Harper88, R.D. Harrington46, O.M. Harris139, P.F. Harrison171, F. Hartjes106, M. Hasegawa66, S. Hasegawa102, Y. Hasegawa141, A. Hasib112, S. Hassani137, S. Haug17, M. Hauschild30, R. Hauser89, M. Havranek126, C.M. Hawkes18, R.J. Hawkings30, A.D. Hawkins80, T. Hayashi161, D. Hayden89, C.P. Hays119, H.S. Hayward73, S.J. Haywood130, S.J. Head18, T. Heck82, V. Hedberg80, L. Heelan8, S. Heim121, T. Heim176, B. Heinemann15, L. Heinrich109, J. Hejbal126, L. Helary22, C. Heller99, M. Heller30, S. Hellman147a,147b, D. Hellmich21, C. Helsens30, J. Henderson119, R.C.W. Henderson71, Y. Heng174, C. Hengler42, A. Henrichs177, A.M. Henriques Correia30, S. Henrot-Versille116, C. Hensel54, G.H. Herbert16, Y. Hernández Jiménez168, R. Herrberg-Schubert16, G. Herten48, R. Hertenberger99, L. Hervas30, G.G. Hesketh77, N.P. Hessey106, R. Hickling75, E. Higón-Rodriguez168, E. Hill170, J.C. Hill28, K.H. Hiller42, S. Hillert21, S.J. Hillier18, I. Hinchliffe15, E. Hines121, M. Hirose158, D. Hirschbuehl176, J. Hobbs149, N. Hod106, M.C. Hodgkinson140, P. Hodgson140, A. Hoecker30, M.R. Hoeferkamp104, F. Hoenig99, J. Hoffman40, D. Hoffmann84, J.I. Hofmann58a, M. Hohlfeld82, T.R. Holmes15, T.M. Hong121, L. Hooft van Huysduynen109, Y. Horii102, J-Y. Hostachy55, S. Hou152, A. Hoummada136a, J. Howard119, J. Howarth42, M. Hrabovsky114, I. Hristova16, J. Hrivnac116, T. Hryn’ova5, C. Hsu146c, P.J. Hsu82, S.-C. Hsu139, D. Hu35, X. Hu25, Y. Huang42, Z. Hubacek30, F. Hubaut84, F. Huegging21, T.B. Huffman119, E.W. Hughes35, G. Hughes71, M. Huhtinen30, T.A. Hülsing82, M. Hurwitz15, N. Huseynov64,b, J. Huston89, J. Huth57, G. Iacobucci49, G. Iakovidis10, I. Ibragimov142, L. Iconomidou-Fayard116, E. Ideal177, P. Iengo103a, O. Igonkina106, T. Iizawa172, Y. Ikegami65, K. Ikematsu142, M. Ikeno65, Y. Ilchenko31,o, D. Iliadis155, N. Ilic159, Y. Inamaru66, T. Ince100, P. Ioannou9, M. Iodice135a, K. Iordanidou9, V. Ippolito57, A. Irles Quiles168, C. Isaksson167, M. Ishino67, M. Ishitsuka158, R. Ishmukhametov110, C. Issever119, S. Istin19a, J.M. Iturbe Ponce83, R. Iuppa134a,134b, J. Ivarsson80, W. Iwanski39, H. Iwasaki65, J.M. Izen41, V. Izzo103a, B. Jackson121, M. Jackson73, P. Jackson1, M.R. Jaekel30, V. Jain2, K. Jakobs48, S. Jakobsen30, T. Jakoubek126, J. Jakubek127, D.O. Jamin152, D.K. Jana78, E. Jansen77, H. Jansen30, J. Janssen21, M. Janus171, G. Jarlskog80, N. Javadov64,b, T. Javůrek48, L. Jeanty15, J. Jejelava51a,p, G.-Y. Jeng151, D. Jennens87, P. Jenni48,q, J. Jentzsch43, C. Jeske171, S. Jézéquel5, H. Ji174, J. Jia149, Y. Jiang33b, M. Jimenez Belenguer42, S. Jin33a, A. Jinaru26a, O. Jinnouchi158, M.D. Joergensen36, K.E. Johansson147a,147b, P. Johansson140, K.A. Johns7, K. Jon-And147a,147b, G. Jones171, R.W.L. Jones71, T.J. Jones73, J. Jongmanns58a, P.M. Jorge125a,125b, K.D. Joshi83, J. Jovicevic148, X. Ju174, C.A. Jung43, R.M. Jungst30, P. Jussel61, A. Juste Rozas12,n, M. Kaci168, A. Kaczmarska39, M. Kado116, H. Kagan110, M. Kagan144, E. Kajomovitz45, C.W. Kalderon119, S. Kama40, A. Kamenshchikov129, N. Kanaya156, M. Kaneda30, S. Kaneti28, V.A. Kantserov97, J. Kanzaki65, B. Kaplan109, A. Kapliy31, D. Kar53, K. Karakostas10, N. Karastathis10, M. Karnevskiy82, S.N. Karpov64, Z.M. Karpova64, K. Karthik109, V. Kartvelishvili71, A.N. Karyukhin129, L. Kashif174, G. Kasieczka58b, R.D. Kass110, A. Kastanas14, Y. Kataoka156, A. Katre49, J. Katzy42, V. Kaushik7, K. Kawagoe69, T. Kawamoto156, G. Kawamura54, S. Kazama156, V.F. Kazanin108, M.Y. Kazarinov64, R. Keeler170, R. Kehoe40, M. Keil54, J.S. Keller42, J.J. Kempster76, H. Keoshkerian5, O. Kepka126, B.P. Kerševan74, S. Kersten176, K. Kessoku156, J. Keung159, F. Khalil-zada11, H. Khandanyan147a,147b, A. Khanov113, A. Khodinov97, A. Khomich58a, T.J. Khoo28, G. Khoriauli21, A. Khoroshilov176, V. Khovanskiy96, E. Khramov64, J. Khubua51b, H.Y. Kim8, H. Kim147a,147b, S.H. Kim161, N. Kimura172, O. Kind16, B.T. King73, M. King168, R.S.B. King119, S.B. King169, J. Kirk130, A.E. Kiryunin100, T. Kishimoto66, D. Kisielewska38a, F. Kiss48, T. Kittelmann124, K. Kiuchi161, E. Kladiva145b, M. Klein73, U. Klein73, K. Kleinknecht82, P. Klimek147a,147b, A. Klimentov25, R. Klingenberg43, J.A. Klinger83, T. Klioutchnikova30, P.F. Klok105, E.-E. Kluge58a, P. Kluit106, S. Kluth100, E. Kneringer61, E.B.F.G. Knoops84, A. Knue53, D. Kobayashi158, T. Kobayashi156, M. Kobel44, M. Kocian144, P. Kodys128, P. Koevesarki21, T. Koffas29, E. Koffeman106, L.A. Kogan119, S. Kohlmann176, Z. Kohout127, T. Kohriki65, T. Koi144, H. Kolanoski16, I. Koletsou5, J. Koll89, A.A. Komar95,∗, Y. Komori156, T. Kondo65, N. Kondrashova42, K. Köneke48, A.C. König105, S. König82, T. Kono65,r, R. Konoplich109,s, N. Konstantinidis77, R. Kopeliansky153, S. Koperny38a, L. Köpke82, A.K. Kopp48, K. Korcyl39, K. Kordas155, A. Korn77, A.A. Korol108,t, I. Korolkov12, E.V. Korolkova140, V.A. Korotkov129, O. Kortner100, S. Kortner100, V.V. Kostyukhin21, V.M. Kotov64, A. Kotwal45, C. Kourkoumelis9, V. Kouskoura155, A. Koutsman160a, R. Kowalewski170, T.Z. Kowalski38a, W. Kozanecki137, A.S. Kozhin129, V. Kral127, V.A. Kramarenko98, G. Kramberger74, D. Krasnopevtsev97, M.W. Krasny79, A. Krasznahorkay30, J.K. Kraus21, A. Kravchenko25, S. Kreiss109, M. Kretz58c, J. Kretzschmar73, K. Kreutzfeldt52, P. Krieger159, K. Kroeninger54, H. Kroha100, J. Kroll121, J. Kroseberg21, J. Krstic13a, U. Kruchonak64, H. Krüger21, T. Kruker17, N. Krumnack63, Z.V. Krumshteyn64, A. Kruse174, M.C. Kruse45, M. Kruskal22, T. Kubota87, S. Kuday4a, S. Kuehn48, A. Kugel58c, A. Kuhl138, T. Kuhl42, V. Kukhtin64, Y. Kulchitsky91, S. Kuleshov32b, M. Kuna133a,133b, J. Kunkle121, A. Kupco126, H. Kurashige66, Y.A. Kurochkin91, R. Kurumida66, V. Kus126, E.S. Kuwertz148, M. Kuze158, J. Kvita114, A. La Rosa49, L. La Rotonda37a,37b, C. Lacasta168, F. Lacava133a,133b, J. Lacey29, H. Lacker16, D. Lacour79, V.R. Lacuesta168, E. Ladygin64, R. Lafaye5, B. Laforge79, T. Lagouri177, S. Lai48, H. Laier58a, L. Lambourne77, S. Lammers60, C.L. Lampen7, W. Lampl7, E. Lançon137, U. Landgraf48, M.P.J. Landon75, V.S. Lang58a, A.J. Lankford164, F. Lanni25, K. Lantzsch30, S. Laplace79, C. Lapoire21, J.F. Laporte137, T. Lari90a, M. Lassnig30, P. Laurelli47, W. Lavrijsen15, A.T. Law138, P. Laycock73, O. Le Dortz79, E. Le Guirriec84, E. Le Menedeu12, T. LeCompte6, F. Ledroit-Guillon55, C.A. Lee152, H. Lee106, J.S.H. Lee117, S.C. Lee152, L. Lee1, G. Lefebvre79, M. Lefebvre170, F. Legger99, C. Leggett15, A. Lehan73, M. Lehmacher21, G. Lehmann Miotto30, X. Lei7, W.A. Leight29, A. Leisos155, A.G. Leister177, M.A.L. Leite24d, R. Leitner128, D. Lellouch173, B. Lemmer54, K.J.C. Leney77, T. Lenz21, G. Lenzen176, B. Lenzi30, R. Leone7, S. Leone123a,123b, K. Leonhardt44, C. Leonidopoulos46, S. Leontsinis10, C. Leroy94, C.G. Lester28, C.M. Lester121, M. Levchenko122, J. Levêque5, D. Levin88, L.J. Levinson173, M. Levy18, A. Lewis119, G.H. Lewis109, A.M. Leyko21, M. Leyton41, B. Li33b,u, B. Li84, H. Li149, H.L. Li31, L. Li45, L. Li33e, S. Li45, Y. Li33c,v, Z. Liang138, H. Liao34, B. Liberti134a, P. Lichard30, K. Lie166, J. Liebal21, W. Liebig14, C. Limbach21, A. Limosani87, S.C. Lin152,w, T.H. Lin82, F. Linde106, B.E. Lindquist149, J.T. Linnemann89, E. Lipeles121, A. Lipniacka14, M. Lisovyi42, T.M. Liss166, D. Lissauer25, A. Lister169, A.M. Litke138, B. Liu152, D. Liu152, J.B. Liu33b, K. Liu33b,x, L. Liu88, M. Liu45, M. Liu33b, Y. Liu33b, M. Livan120a,120b, S.S.A. Livermore119, A. Lleres55, J. Llorente Merino81, S.L. Lloyd75, F. Lo Sterzo152, E. Lobodzinska42, P. Loch7, W.S. Lockman138, T. Loddenkoetter21, F.K. Loebinger83, A.E. Loevschall-Jensen36, A. Loginov177, T. Lohse16, K. Lohwasser42, M. Lokajicek126, V.P. Lombardo5, B.A. Long22, J.D. Long88, R.E. Long71, L. Lopes125a, D. Lopez Mateos57, B. Lopez Paredes140, I. Lopez Paz12, J. Lorenz99, N. Lorenzo Martinez60, M. Losada163, P. Loscutoff15, X. Lou41, A. Lounis116, J. Love6, P.A. Love71, A.J. Lowe144,e, F. Lu33a, N. Lu88, H.J. Lubatti139, C. Luci133a,133b, A. Lucotte55, F. Luehring60, W. Lukas61, L. Luminari133a, O. Lundberg147a,147b, B. Lund-Jensen148, M. Lungwitz82, D. Lynn25, R. Lysak126, E. Lytken80, H. Ma25, L.L. Ma33d, G. Maccarrone47, A. Macchiolo100, J. Machado Miguens125a,125b, D. Macina30, D. Madaffari84, R. Madar48, H.J. Maddocks71, W.F. Mader44, A. Madsen167, M. Maeno8, T. Maeno25, E. Magradze54, K. Mahboubi48, J. Mahlstedt106, S. Mahmoud73, C. Maiani137, C. Maidantchik24a, A.A. Maier100, A. Maio125a,125b,125d, S. Majewski115, Y. Makida65, N. Makovec116, P. Mal137,y, B. Malaescu79, Pa. Malecki39, V.P. Maleev122, F. Malek55, U. Mallik62, D. Malon6, C. Malone144, S. Maltezos10, V.M. Malyshev108, S. Malyukov30, J. Mamuzic13b, B. Mandelli30, L. Mandelli90a, I. Mandić74, R. Mandrysch62, J. Maneira125a,125b, A. Manfredini100, L. Manhaes de Andrade Filho24b, J.A. Manjarres Ramos160b, A. Mann99, P.M. Manning138, A. Manousakis-Katsikakis9, B. Mansoulie137, R. Mantifel86, L. Mapelli30, L. March168, J.F. Marchand29, G. Marchiori79, M. Marcisovsky126, C.P. Marino170, M. Marjanovic13a, C.N. Marques125a, F. Marroquim24a, S.P. Marsden83, Z. Marshall15, L.F. Marti17, S. Marti-Garcia168, B. Martin30, B. Martin89, T.A. Martin171, V.J. Martin46, B. Martin dit Latour14, H. Martinez137, M. Martinez12,n, S. Martin-Haugh130, A.C. Martyniuk77, M. Marx139, F. Marzano133a, A. Marzin30, L. Masetti82, T. Mashimo156, R. Mashinistov95, J. Masik83, A.L. Maslennikov108, I. Massa20a,20b, L. Massa20a,20b, N. Massol5, P. Mastrandrea149, A. Mastroberardino37a,37b, T. Masubuchi156, P. Mättig176, J. Mattmann82, J. Maurer26a, S.J. Maxfield73, D.A. Maximov108,t, R. Mazini152, L. Mazzaferro134a,134b, G. Mc Goldrick159, S.P. Mc Kee88, A. McCarn88, R.L. McCarthy149, T.G. McCarthy29, N.A. McCubbin130, K.W. McFarlane56,∗, J.A. Mcfayden77, G. Mchedlidze54, S.J. McMahon130, R.A. McPherson170,i, A. Meade85, J. Mechnich106, M. Medinnis42, S. Meehan31, S. Mehlhase99, A. Mehta73, K. Meier58a, C. Meineck99, B. Meirose80, C. Melachrinos31, B.R. Mellado Garcia146c, F. Meloni17, A. Mengarelli20a,20b, S. Menke100, E. Meoni162, K.M. Mercurio57, S. Mergelmeyer21, N. Meric137, P. Mermod49, L. Merola103a,103b, C. Meroni90a, F.S. Merritt31, H. Merritt110, A. Messina30,z, J. Metcalfe25, A.S. Mete164, C. Meyer82, C. Meyer121, J-P. Meyer137, J. Meyer30, R.P. Middleton130, S. Migas73, L. Mijović21, G. Mikenberg173, M. Mikestikova126, M. Mikuž74, A. Milic30, D.W. Miller31, C. Mills46, A. Milov173, D.A. Milstead147a,147b, D. Milstein173, A.A. Minaenko129, I.A. Minashvili64, A.I. Mincer109, B. Mindur38a, M. Mineev64, Y. Ming174, L.M. Mir12, G. Mirabelli133a, T. Mitani172, J. Mitrevski99, V.A. Mitsou168, S. Mitsui65, A. Miucci49, P.S. Miyagawa140, J.U. Mjörnmark80, T. Moa147a,147b, K. Mochizuki84, S. Mohapatra35, W. Mohr48, S. Molander147a,147b, R. Moles-Valls168, K. Mönig42, C. Monini55, J. Monk36, E. Monnier84, J. Montejo Berlingen12, F. Monticelli70, S. Monzani133a,133b, R.W. Moore3, N. Morange62, D. Moreno82, M. Moreno Llácer54, P. Morettini50a, M. Morgenstern44, M. Morii57, S. Moritz82, A.K. Morley148, G. Mornacchi30, J.D. Morris75, L. Morvaj102, H.G. Moser100, M. Mosidze51b, J. Moss110, K. Motohashi158, R. Mount144, E. Mountricha25, S.V. Mouraviev95,∗, E.J.W. Moyse85, S. Muanza84, R.D. Mudd18, F. Mueller58a, J. Mueller124, K. Mueller21, T. Mueller28, T. Mueller82, D. Muenstermann49, Y. Munwes154, J.A. Murillo Quijada18, W.J. Murray171,130, H. Musheghyan54, E. Musto153, A.G. Myagkov129,aa, M. Myska127, O. Nackenhorst54, J. Nadal54, K. Nagai61, R. Nagai158, Y. Nagai84, K. Nagano65, A. Nagarkar110, Y. Nagasaka59, M. Nagel100, A.M. Nairz30, Y. Nakahama30, K. Nakamura65, T. Nakamura156, I. Nakano111, H. Namasivayam41, G. Nanava21, R. Narayan58b, T. Nattermann21, T. Naumann42, G. Navarro163, R. Nayyar7, H.A. Neal88, P.Yu. Nechaeva95, T.J. Neep83, P.D. Nef144, A. Negri120a,120b, G. Negri30, M. Negrini20a, S. Nektarijevic49, A. Nelson164, T.K. Nelson144, S. Nemecek126, P. Nemethy109, A.A. Nepomuceno24a, M. Nessi30,ab, M.S. Neubauer166, M. Neumann176, R.M. Neves109, P. Nevski25, P.R. Newman18, D.H. Nguyen6, R.B. Nickerson119, R. Nicolaidou137, B. Nicquevert30, J. Nielsen138, N. Nikiforou35, A. Nikiforov16, V. Nikolaenko129,aa, I. Nikolic-Audit79, K. Nikolics49, K. Nikolopoulos18, P. Nilsson8, Y. Ninomiya156, A. Nisati133a, R. Nisius100, T. Nobe158, L. Nodulman6, M. Nomachi117, I. Nomidis29, S. Norberg112, M. Nordberg30, O. Novgorodova44, S. Nowak100, M. Nozaki65, L. Nozka114, K. Ntekas10, G. Nunes Hanninger87, T. Nunnemann99, E. Nurse77, F. Nuti87, B.J. O’Brien46, F. O’grady7, D.C. O’Neil143, V. O’Shea53, F.G. Oakham29,d, H. Oberlack100, T. Obermann21, J. Ocariz79, A. Ochi66, M.I. Ochoa77, S. Oda69, S. Odaka65, H. Ogren60, A. Oh83, S.H. Oh45, C.C. Ohm15, H. Ohman167, W. Okamura117, H. Okawa25, Y. Okumura31, T. Okuyama156, A. Olariu26a, A.G. Olchevski64, S.A. Olivares Pino46, D. Oliveira Damazio25, E. Oliver Garcia168, A. Olszewski39, J. Olszowska39, A. Onofre125a,125e, P.U.E. Onyisi31,o, C.J. Oram160a, M.J. Oreglia31, Y. Oren154, D. Orestano135a,135b, N. Orlando72a,72b, C. Oropeza Barrera53, R.S. Orr159, B. Osculati50a,50b, R. Ospanov121, G. Otero y Garzon27, H. Otono69, M. Ouchrif136d, E.A. Ouellette170, F. Ould-Saada118, A. Ouraou137, K.P. Oussoren106, Q. Ouyang33a, A. Ovcharova15, M. Owen83, V.E. Ozcan19a, N. Ozturk8, K. Pachal119, A. Pacheco Pages12, C. Padilla Aranda12, M. Pagáčová48, S. Pagan Griso15, E. Paganis140, C. Pahl100, F. Paige25, P. Pais85, K. Pajchel118, G. Palacino160b, S. Palestini30, M. Palka38b, D. Pallin34, A. Palma125a,125b, J.D. Palmer18, Y.B. Pan174, E. Panagiotopoulou10, J.G. Panduro Vazquez76, P. Pani106, N. Panikashvili88, S. Panitkin25, D. Pantea26a, L. Paolozzi134a,134b, Th.D. Papadopoulou10, K. Papageorgiou155,l, A. Paramonov6, D. Paredes Hernandez34, M.A. Parker28, F. Parodi50a,50b, J.A. Parsons35, U. Parzefall48, E. Pasqualucci133a, S. Passaggio50a, A. Passeri135a, F. Pastore135a,135b,∗, Fr. Pastore76, G. Pásztor29, S. Pataraia176, N.D. Patel151, J.R. Pater83, S. Patricelli103a,103b, T. Pauly30, J. Pearce170, L.E. Pedersen36, M. Pedersen118, S. Pedraza Lopez168, R. Pedro125a,125b, S.V. Peleganchuk108, D. Pelikan167, H. Peng33b, B. Penning31, J. Penwell60, D.V. Perepelitsa25, E. Perez Codina160a, M.T. Pérez García-Estañ168, V. Perez Reale35, L. Perini90a,90b, H. Pernegger30, R. Perrino72a, R. Peschke42, V.D. Peshekhonov64, K. Peters30, R.F.Y. Peters83, B.A. Petersen30, T.C. Petersen36, E. Petit42, A. Petridis147a,147b, C. Petridou155, E. Petrolo133a, F. Petrucci135a,135b, N.E. Pettersson158, R. Pezoa32b, P.W. Phillips130, G. Piacquadio144, E. Pianori171, A. Picazio49, E. Piccaro75, M. Piccinini20a,20b, R. Piegaia27, D.T. Pignotti110, J.E. Pilcher31, A.D. Pilkington77, J. Pina125a,125b,125d, M. Pinamonti165a,165c,ac, A. Pinder119, J.L. Pinfold3, A. Pingel36, B. Pinto125a, S. Pires79, M. Pitt173, C. Pizio90a,90b, L. Plazak145a, M.-A. Pleier25, V. Pleskot128, E. Plotnikova64, P. Plucinski147a,147b, S. Poddar58a, F. Podlyski34, R. Poettgen82, L. Poggioli116, D. Pohl21, M. Pohl49, G. Polesello120a, A. Policicchio37a,37b, R. Polifka159, A. Polini20a, C.S. Pollard45, V. Polychronakos25, K. Pommès30, L. Pontecorvo133a, B.G. Pope89, G.A. Popeneciu26b, D.S. Popovic13a, A. Poppleton30, X. Portell Bueso12, S. Pospisil127, K. Potamianos15, I.N. Potrap64, C.J. Potter150, C.T. Potter115, G. Poulard30, J. Poveda60, V. Pozdnyakov64, P. Pralavorio84, A. Pranko15, S. Prasad30, R. Pravahan8, S. Prell63, D. Price83, J. Price73, L.E. Price6, D. Prieur124, M. Primavera72a, M. Proissl46, K. Prokofiev47, F. Prokoshin32b, E. Protopapadaki137, S. Protopopescu25, J. Proudfoot6, M. Przybycien38a, H. Przysiezniak5, E. Ptacek115, D. Puddu135a,135b, E. Pueschel85, D. Puldon149, M. Purohit25,ad, P. Puzo116, J. Qian88, G. Qin53, Y. Qin83, A. Quadt54, D.R. Quarrie15, W.B. Quayle165a,165b, M. Queitsch-Maitland83, D. Quilty53, A. Qureshi160b, V. Radeka25, V. Radescu42, S.K. Radhakrishnan149, P. Radloff115, P. Rados87, F. Ragusa90a,90b, G. Rahal179, S. Rajagopalan25, M. Rammensee30, A.S. Randle-Conde40, C. Rangel-Smith167, K. Rao164, F. Rauscher99, T.C. Rave48, T. Ravenscroft53, M. Raymond30, A.L. Read118, N.P. Readioff73, D.M. Rebuzzi120a,120b, A. Redelbach175, G. Redlinger25, R. Reece138, K. Reeves41, L. Rehnisch16, H. Reisin27, M. Relich164, C. Rembser30, H. Ren33a, Z.L. Ren152, A. Renaud116, M. Rescigno133a, S. Resconi90a, O.L. Rezanova108,t, P. Reznicek128, R. Rezvani94, R. Richter100, M. Ridel79, P. Rieck16, J. Rieger54, M. Rijssenbeek149, A. Rimoldi120a,120b, L. Rinaldi20a, E. Ritsch61, I. Riu12, F. Rizatdinova113, E. Rizvi75, S.H. Robertson86,i, A. Robichaud-Veronneau86, D. Robinson28, J.E.M. Robinson83, A. Robson53, C. Roda123a,123b, L. Rodrigues30, S. Roe30, O. Røhne118, S. Rolli162, A. Romaniouk97, M. Romano20a,20b, E. Romero Adam168, N. Rompotis139, M. Ronzani48, L. Roos79, E. Ros168, S. Rosati133a, K. Rosbach49, M. Rose76, P. Rose138, P.L. Rosendahl14, O. Rosenthal142, V. Rossetti147a,147b, E. Rossi103a,103b, L.P. Rossi50a, R. Rosten139, M. Rotaru26a, I. Roth173, J. Rothberg139, D. Rousseau116, C.R. Royon137, A. Rozanov84, Y. Rozen153, X. Ruan146c, F. Rubbo12, I. Rubinskiy42, V.I. Rud98, C. Rudolph44, M.S. Rudolph159, F. Rühr48, A. Ruiz-Martinez30, Z. Rurikova48, N.A. Rusakovich64, A. Ruschke99, J.P. Rutherfoord7, N. Ruthmann48, Y.F. Ryabov122, M. Rybar128, G. Rybkin116, N.C. Ryder119, A.F. Saavedra151, S. Sacerdoti27, A. Saddique3, I. Sadeh154, H.F-W. Sadrozinski138, R. Sadykov64, F. Safai Tehrani133a, H. Sakamoto156, Y. Sakurai172, G. Salamanna135a,135b, A. Salamon134a, M. Saleem112, D. Salek106, P.H. Sales De Bruin139, D. Salihagic100, A. Salnikov144, J. Salt168, D. Salvatore37a,37b, F. Salvatore150, A. Salvucci105, A. Salzburger30, D. Sampsonidis155, A. Sanchez103a,103b, J. Sánchez168, V. Sanchez Martinez168, H. Sandaker14, R.L. Sandbach75, H.G. Sander82, M.P. Sanders99, M. Sandhoff176, T. Sandoval28, C. Sandoval163, R. Sandstroem100, D.P.C. Sankey130, A. Sansoni47, C. Santoni34, R. Santonico134a,134b, H. Santos125a, I. Santoyo Castillo150, K. Sapp124, A. Sapronov64, J.G. Saraiva125a,125d, B. Sarrazin21, G. Sartisohn176, O. Sasaki65, Y. Sasaki156, G. Sauvage5,∗, E. Sauvan5, P. Savard159,d, D.O. Savu30, C. Sawyer119, L. Sawyer78,m, D.H. Saxon53, J. Saxon121, C. Sbarra20a, A. Sbrizzi3, T. Scanlon77, D.A. Scannicchio164, M. Scarcella151, V. Scarfone37a,37b, J. Schaarschmidt173, P. Schacht100, D. Schaefer30, R. Schaefer42, S. Schaepe21, S. Schaetzel58b, U. Schäfer82, A.C. Schaffer116, D. Schaile99, R.D. Schamberger149, V. Scharf58a, V.A. Schegelsky122, D. Scheirich128, M. Schernau164, M.I. Scherzer35, C. Schiavi50a,50b, J. Schieck99, C. Schillo48, M. Schioppa37a,37b, S. Schlenker30, E. Schmidt48, K. Schmieden30, C. Schmitt82, S. Schmitt58b, B. Schneider17, Y.J. Schnellbach73, U. Schnoor44, L. Schoeffel137, A. Schoening58b, B.D. Schoenrock89, A.L.S. Schorlemmer54, M. Schott82, D. Schouten160a, J. Schovancova25, S. Schramm159, M. Schreyer175, C. Schroeder82, N. Schuh82, M.J. Schultens21, H.-C. Schultz-Coulon58a, H. Schulz16, M. Schumacher48, B.A. Schumm138, Ph. Schune137, C. Schwanenberger83, A. Schwartzman144, Ph. Schwegler100, Ph. Schwemling137, R. Schwienhorst89, J. Schwindling137, T. Schwindt21, M. Schwoerer5, F.G. Sciacca17, E. Scifo116, G. Sciolla23, W.G. Scott130, F. Scuri123a,123b, F. Scutti21, J. Searcy88, G. Sedov42, E. Sedykh122, S.C. Seidel104, A. Seiden138, F. Seifert127, J.M. Seixas24a, G. Sekhniaidze103a, S.J. Sekula40, K.E. Selbach46, D.M. Seliverstov122,∗, G. Sellers73, N. Semprini-Cesari20a,20b, C. Serfon30, L. Serin116, L. Serkin54, T. Serre84, R. Seuster160a, H. Severini112, T. Sfiligoj74, F. Sforza100, A. Sfyrla30, E. Shabalina54, M. Shamim115, L.Y. Shan33a, R. Shang166, J.T. Shank22, M. Shapiro15, P.B. Shatalov96, K. Shaw165a,165b, C.Y. Shehu150, P. Sherwood77, L. Shi152,ae, S. Shimizu66, C.O. Shimmin164, M. Shimojima101, M. Shiyakova64, A. Shmeleva95, M.J. Shochet31, D. Short119, S. Shrestha63, E. Shulga97, M.A. Shupe7, S. Shushkevich42, P. Sicho126, O. Sidiropoulou155, D. Sidorov113, A. Sidoti133a, F. Siegert44, Dj. Sijacki13a, J. Silva125a,125d, Y. Silver154, D. Silverstein144, S.B. Silverstein147a, V. Simak127, O. Simard5, Lj. Simic13a, S. Simion116, E. Simioni82, B. Simmons77, R. Simoniello90a,90b, M. Simonyan36, P. Sinervo159, N.B. Sinev115, V. Sipica142, G. Siragusa175, A. Sircar78, A.N. Sisakyan64,∗, S.Yu. Sivoklokov98, J. Sjölin147a,147b, T.B. Sjursen14, H.P. Skottowe57, K.Yu. Skovpen108, P. Skubic112, M. Slater18, T. Slavicek127, K. Sliwa162, V. Smakhtin173, B.H. Smart46, L. Smestad14, S.Yu. Smirnov97, Y. Smirnov97, L.N. Smirnova98,af, O. Smirnova80, K.M. Smith53, M. Smizanska71, K. Smolek127, A.A. Snesarev95, G. Snidero75, S. Snyder25, R. Sobie170,i, F. Socher44, A. Soffer154, D.A. Soh152,ae, C.A. Solans30, M. Solar127, J. Solc127, E.Yu. Soldatov97, U. Soldevila168, A.A. Solodkov129, A. Soloshenko64, O.V. Solovyanov129, V. Solovyev122, P. Sommer48, H.Y. Song33b, N. Soni1, A. Sood15, A. Sopczak127, B. Sopko127, V. Sopko127, V. Sorin12, M. Sosebee8, R. Soualah165a,165c, P. Soueid94, A.M. Soukharev108, D. South42, S. Spagnolo72a,72b, F. Spanò76, W.R. Spearman57, F. Spettel100, R. Spighi20a, G. Spigo30, L.A. Spiller87, M. Spousta128, T. Spreitzer159, B. Spurlock8, R.D. St. Denis53,∗, S. Staerz44, J. Stahlman121, R. Stamen58a, S. Stamm16, E. Stanecka39, R.W. Stanek6, C. Stanescu135a, M. Stanescu-Bellu42, M.M. Stanitzki42, S. Stapnes118, E.A. Starchenko129, J. Stark55, P. Staroba126, P. Starovoitov42, R. Staszewski39, P. Stavina145a,∗, P. Steinberg25, B. Stelzer143, H.J. Stelzer30, O. Stelzer-Chilton160a, H. Stenzel52, S. Stern100, G.A. Stewart53, J.A. Stillings21, M.C. Stockton86, M. Stoebe86, G. Stoicea26a, P. Stolte54, S. Stonjek100, A.R. Stradling8, A. Straessner44, M.E. Stramaglia17, J. Strandberg148, S. Strandberg147a,147b, A. Strandlie118, E. Strauss144, M. Strauss112, P. Strizenec145b, R. Ströhmer175, D.M. Strom115, R. Stroynowski40, A. Struebig105, S.A. Stucci17, B. Stugu14, N.A. Styles42, D. Su144, J. Su124, R. Subramaniam78, A. Succurro12, Y. Sugaya117, C. Suhr107, M. Suk127, V.V. Sulin95, S. Sultansoy4c, T. Sumida67, S. Sun57, X. Sun33a, J.E. Sundermann48, K. Suruliz140, G. Susinno37a,37b, M.R. Sutton150, Y. Suzuki65, M. Svatos126, S. Swedish169, M. Swiatlowski144, I. Sykora145a, T. Sykora128, D. Ta89, C. Taccini135a,135b, K. Tackmann42, J. Taenzer159, A. Taffard164, R. Tafirout160a, N. Taiblum154, H. Takai25, R. Takashima68, H. Takeda66, T. Takeshita141, Y. Takubo65, M. Talby84, A.A. Talyshev108,t, J.Y.C. Tam175, K.G. Tan87, J. Tanaka156, R. Tanaka116, S. Tanaka132, S. Tanaka65, A.J. Tanasijczuk143, B.B. Tannenwald110, N. Tannoury21, S. Tapprogge82, S. Tarem153, F. Tarrade29, G.F. Tartarelli90a, P. Tas128, M. Tasevsky126, T. Tashiro67, E. Tassi37a,37b, A. Tavares Delgado125a,125b, Y. Tayalati136d, F.E. Taylor93, G.N. Taylor87, W. Taylor160b, F.A. Teischinger30, M. Teixeira Dias Castanheira75, P. Teixeira-Dias76, K.K. Temming48, H. Ten Kate30, P.K. Teng152, J.J. Teoh117, S. Terada65, K. Terashi156, J. Terron81, S. Terzo100, M. Testa47, R.J. Teuscher159,i, J. Therhaag21, T. Theveneaux-Pelzer34, J.P. Thomas18, J. Thomas-Wilsker76, E.N. Thompson35, P.D. Thompson18, P.D. Thompson159, R.J. Thompson83, A.S. Thompson53, L.A. Thomsen36, E. Thomson121, M. Thomson28, W.M. Thong87, R.P. Thun88,∗, F. Tian35, M.J. Tibbetts15, V.O. Tikhomirov95,ag, Yu.A. Tikhonov108,t, S. Timoshenko97, E. Tiouchichine84, P. Tipton177, S. Tisserant84, T. Todorov5, S. Todorova-Nova128, B. Toggerson7, J. Tojo69, S. Tokár145a, K. Tokushuku65, K. Tollefson89, L. Tomlinson83, M. Tomoto102, L. Tompkins31, K. Toms104, N.D. Topilin64, E. Torrence115, H. Torres143, E. Torró Pastor168, J. Toth84,ah, F. Touchard84, D.R. Tovey140, H.L. Tran116, T. Trefzger175, L. Tremblet30, A. Tricoli30, I.M. Trigger160a, S. Trincaz-Duvoid79, M.F. Tripiana12, W. Trischuk159, B. Trocmé55, C. Troncon90a, M. Trottier-McDonald143, M. Trovatelli135a,135b, P. True89, M. Trzebinski39, A. Trzupek39, C. Tsarouchas30, J.C-L. Tseng119, P.V. Tsiareshka91, D. Tsionou137, G. Tsipolitis10, N. Tsirintanis9, S. Tsiskaridze12, V. Tsiskaridze48, E.G. Tskhadadze51a, I.I. Tsukerman96, V. Tsulaia15, S. Tsuno65, D. Tsybychev149, A. Tudorache26a, V. Tudorache26a, A.N. Tuna121, S.A. Tupputi20a,20b, S. Turchikhin98,af, D. Turecek127, I. Turk Cakir4d, R. Turra90a,90b, P.M. Tuts35, A. Tykhonov49, M. Tylmad147a,147b, M. Tyndel130, K. Uchida21, I. Ueda156, R. Ueno29, M. Ughetto84, M. Ugland14, M. Uhlenbrock21, F. Ukegawa161, G. Unal30, A. Undrus25, G. Unel164, F.C. Ungaro48, Y. Unno65, C. Unverdorben99, D. Urbaniec35, P. Urquijo87, G. Usai8, A. Usanova61, L. Vacavant84, V. Vacek127, B. Vachon86, N. Valencic106, S. Valentinetti20a,20b, A. Valero168, L. Valery34, S. Valkar128, E. Valladolid Gallego168, S. Vallecorsa49, J.A. Valls Ferrer168, W. Van Den Wollenberg106, P.C. Van Der Deijl106, R. van der Geer106, H. van der Graaf106, R. Van Der Leeuw106, D. van der Ster30, N. van Eldik30, P. van Gemmeren6, J. Van Nieuwkoop143, I. van Vulpen106, M.C. van Woerden30, M. Vanadia133a,133b, W. Vandelli30, R. Vanguri121, A. Vaniachine6, P. Vankov42, F. Vannucci79, G. Vardanyan178, R. Vari133a, E.W. Varnes7, T. Varol85, D. Varouchas79, A. Vartapetian8, K.E. Varvell151, F. Vazeille34, T. Vazquez Schroeder54, J. Veatch7, F. Veloso125a,125c, S. Veneziano133a, A. Ventura72a,72b, D. Ventura85, M. Venturi170, N. Venturi159, A. Venturini23, V. Vercesi120a, M. Verducci133a,133b, W. Verkerke106, J.C. Vermeulen106, A. Vest44, M.C. Vetterli143,d, O. Viazlo80, I. Vichou166, T. Vickey146c,ai, O.E. Vickey Boeriu146c, G.H.A. Viehhauser119, S. Viel169, R. Vigne30, M. Villa20a,20b, M. Villaplana Perez90a,90b, E. Vilucchi47, M.G. Vincter29, V.B. Vinogradov64, J. Virzi15, I. Vivarelli150, F. Vives Vaque3, S. Vlachos10, D. Vladoiu99, M. Vlasak127, A. Vogel21, M. Vogel32a, P. Vokac127, G. Volpi123a,123b, M. Volpi87, H. von der Schmitt100, H. von Radziewski48, E. von Toerne21, V. Vorobel128, K. Vorobev97, M. Vos168, R. Voss30, J.H. Vossebeld73, N. Vranjes137, M. Vranjes Milosavljevic13a, V. Vrba126, M. Vreeswijk106, T. Vu Anh48, R. Vuillermet30, I. Vukotic31, Z. Vykydal127, P. Wagner21, W. Wagner176, H. Wahlberg70, S. Wahrmund44, J. Wakabayashi102, J. Walder71, R. Walker99, W. Walkowiak142, R. Wall177, P. Waller73, B. Walsh177, C. Wang152,aj, C. Wang45, F. Wang174, H. Wang15, H. Wang40, J. Wang42, J. Wang33a, K. Wang86, R. Wang104, S.M. Wang152, T. Wang21, X. Wang177, C. Wanotayaroj115, A. Warburton86, C.P. Ward28, D.R. Wardrope77, M. Warsinsky48, A. Washbrook46, C. Wasicki42, P.M. Watkins18, A.T. Watson18, I.J. Watson151, M.F. Watson18, G. Watts139, S. Watts83, B.M. Waugh77, S. Webb83, M.S. Weber17, S.W. Weber175, J.S. Webster31, A.R. Weidberg119, P. Weigell100, B. Weinert60, J. Weingarten54, C. Weiser48, H. Weits106, P.S. Wells30, T. Wenaus25, D. Wendland16, Z. Weng152,ae, T. Wengler30, S. Wenig30, N. Wermes21, M. Werner48, P. Werner30, M. Wessels58a, J. Wetter162, K. Whalen29, A. White8, M.J. White1, R. White32b, S. White123a,123b, D. Whiteson164, D. Wicke176, F.J. Wickens130, W. Wiedenmann174, M. Wielers130, P. Wienemann21, C. Wiglesworth36, L.A.M. Wiik-Fuchs21, P.A. Wijeratne77, A. Wildauer100, M.A. Wildt42,ak, H.G. Wilkens30, J.Z. Will99, H.H. Williams121, S. Williams28, C. Willis89, S. Willocq85, A. Wilson88, J.A. Wilson18, I. Wingerter-Seez5, F. Winklmeier115, B.T. Winter21, M. Wittgen144, T. Wittig43, J. Wittkowski99, S.J. Wollstadt82, M.W. Wolter39, H. Wolters125a,125c, B.K. Wosiek39, J. Wotschack30, M.J. Woudstra83, K.W. Wozniak39, M. Wright53, M. Wu55, S.L. Wu174, X. Wu49, Y. Wu88, E. Wulf35, T.R. Wyatt83, B.M. Wynne46, S. Xella36, M. Xiao137, D. Xu33a, L. Xu33b,al, B. Yabsley151, S. Yacoob146b,am, R. Yakabe66, M. Yamada65, H. Yamaguchi156, Y. Yamaguchi117, A. Yamamoto65, K. Yamamoto63, S. Yamamoto156, T. Yamamura156, T. Yamanaka156, K. Yamauchi102, Y. Yamazaki66, Z. Yan22, H. Yang33e, H. Yang174, U.K. Yang83, Y. Yang110, S. Yanush92, L. Yao33a, W-M. Yao15, Y. Yasu65, E. Yatsenko42, K.H. Yau Wong21, J. Ye40, S. Ye25, I. Yeletskikh64, A.L. Yen57, E. Yildirim42, M. Yilmaz4b, R. Yoosoofmiya124, K. Yorita172, R. Yoshida6, K. Yoshihara156, C. Young144, C.J.S. Young30, S. Youssef22, D.R. Yu15, J. Yu8, J.M. Yu88, J. Yu113, L. Yuan66, A. Yurkewicz107, I. Yusuff28,an, B. Zabinski39, R. Zaidan62, A.M. Zaitsev129,aa, A. Zaman149, S. Zambito23, L. Zanello133a,133b, D. Zanzi100, C. Zeitnitz176, M. Zeman127, A. Zemla38a, K. Zengel23, O. Zenin129, T. Ženiš145a, D. Zerwas116, G. Zevi della Porta57, D. Zhang88, F. Zhang174, H. Zhang89, J. Zhang6, L. Zhang152, X. Zhang33d, Z. Zhang116, Z. Zhao33b, A. Zhemchugov64, J. Zhong119, B. Zhou88, L. Zhou35, N. Zhou164, C.G. Zhu33d, H. Zhu33a, J. Zhu88, Y. Zhu33b, X. Zhuang33a, K. Zhukov95, A. Zibell175, D. Zieminska60, N.I. Zimine64, C. Zimmermann82, R. Zimmermann21, S. Zimmermann21, S. Zimmermann48, Z. Zinonos54, M. Ziolkowski142, G. Zobernig174, A. Zoccoli20a,20b, M. zur Nedden16, G. Zurzolo103a,103b, V. Zutshi107, L. Zwalinski30.
1 Department of Physics, University of Adelaide, Adelaide, Australia
2 Physics Department, SUNY Albany, Albany NY, United States of America
3 Department of Physics, University of Alberta, Edmonton AB, Canada
4 (a) Department of Physics, Ankara University, Ankara; (b) Department of Physics, Gazi University, Ankara; (c) Division of Physics, TOBB University of Economics and Technology, Ankara; (d) Turkish Atomic Energy Authority, Ankara, Turkey
5 LAPP, CNRS/IN2P3 and Université de Savoie, Annecy-le-Vieux, France
6 High Energy Physics Division, Argonne National Laboratory, Argonne IL, United States of America
7 Department of Physics, University of Arizona, Tucson AZ, United States of America
8 Department of Physics, The University of Texas at Arlington, Arlington TX, United States of America
9 Physics Department, University of Athens, Athens, Greece
10 Physics Department, National Technical University of Athens, Zografou, Greece
11 Institute of Physics, Azerbaijan Academy of Sciences, Baku, Azerbaijan
12 Institut de Física d’Altes Energies and Departament de Física de la Universitat Autònoma de Barcelona, Barcelona, Spain
13 (a) Institute of Physics, University of Belgrade, Belgrade; (b) Vinca Institute of Nuclear Sciences, University of Belgrade, Belgrade, Serbia
14 Department for Physics and Technology, University of Bergen, Bergen, Norway
15 Physics Division, Lawrence Berkeley National Laboratory and University of California, Berkeley CA, United States of America
16 Department of Physics, Humboldt University, Berlin, Germany
17 Albert Einstein Center for Fundamental Physics and Laboratory for High Energy Physics, University of Bern, Bern, Switzerland
18 School of Physics and Astronomy, University of Birmingham, Birmingham, United Kingdom
19 (a) Department of Physics, Bogazici University, Istanbul; (b) Department of Physics, Dogus University, Istanbul; (c) Department of Physics Engineering, Gaziantep University, Gaziantep, Turkey
20 (a) INFN Sezione di Bologna; (b) Dipartimento di Fisica e Astronomia, Università di Bologna, Bologna, Italy
21 Physikalisches Institut, University of Bonn, Bonn, Germany
22 Department of Physics, Boston University, Boston MA, United States of America
23 Department of Physics, Brandeis University, Waltham MA, United States of America
24 (a) Universidade Federal do Rio De Janeiro COPPE/EE/IF, Rio de Janeiro; (b) Federal University of Juiz de Fora (UFJF), Juiz de Fora; (c) Federal University of Sao Joao del Rei (UFSJ), Sao Joao del Rei; (d) Instituto de Fisica, Universidade de Sao Paulo, Sao Paulo, Brazil
25 Physics Department, Brookhaven National Laboratory, Upton NY, United States of America
26 (a) National Institute of Physics and Nuclear Engineering, Bucharest; (b) National Institute for Research and Development of Isotopic and Molecular Technologies, Physics Department, Cluj Napoca; (c) University Politehnica Bucharest, Bucharest; (d) West University in Timisoara, Timisoara, Romania
27 Departamento de Física, Universidad de Buenos Aires, Buenos Aires, Argentina
28 Cavendish Laboratory, University of Cambridge, Cambridge, United Kingdom
29 Department of Physics, Carleton University, Ottawa ON, Canada
30 CERN, Geneva, Switzerland
31 Enrico Fermi Institute, University of Chicago, Chicago IL, United States of America
32 (a) Departamento de Física, Pontificia Universidad Católica de Chile, Santiago; (b) Departamento de Física, Universidad Técnica Federico Santa María, Valparaíso, Chile
33 (a) Institute of High Energy Physics, Chinese Academy of Sciences, Beijing; (b) Department of Modern Physics, University of Science and Technology of China, Anhui; (c) Department of Physics, Nanjing University, Jiangsu; (d) School of Physics, Shandong University, Shandong; (e) Physics Department, Shanghai Jiao Tong University, Shanghai, China
34 Laboratoire de Physique Corpusculaire, Clermont Université and Université Blaise Pascal and CNRS/IN2P3, Clermont-Ferrand, France
35 Nevis Laboratory, Columbia University, Irvington NY, United States of America
36 Niels Bohr Institute, University of Copenhagen, Kobenhavn, Denmark
37 (a) INFN Gruppo Collegato di Cosenza, Laboratori Nazionali di Frascati; (b) Dipartimento di Fisica, Università della Calabria, Rende, Italy
38 (a) AGH University of Science and Technology, Faculty of Physics and Applied Computer Science, Krakow; (b) Marian Smoluchowski Institute of Physics, Jagiellonian University, Krakow, Poland
39 The Henryk Niewodniczanski Institute of Nuclear Physics, Polish Academy of Sciences, Krakow, Poland
40 Physics Department, Southern Methodist University, Dallas TX, United States of America
41 Physics Department, University of Texas at Dallas, Richardson TX, United States of America
42 DESY, Hamburg and Zeuthen, Germany
43 Institut für Experimentelle Physik IV, Technische Universität Dortmund, Dortmund, Germany
44 Institut für Kern- und Teilchenphysik, Technische Universität Dresden, Dresden, Germany
45 Department of Physics, Duke University, Durham NC, United States of America
46 SUPA - School of Physics and Astronomy, University of Edinburgh, Edinburgh, United Kingdom
47 INFN Laboratori Nazionali di Frascati, Frascati, Italy
48 Fakultät für Mathematik und Physik, Albert-Ludwigs-Universität, Freiburg, Germany
49 Section de Physique, Université de Genève, Geneva, Switzerland
50 (a) INFN Sezione di Genova; (b) Dipartimento di Fisica, Università di Genova, Genova, Italy
51 (a) E. Andronikashvili Institute of Physics, Iv. Javakhishvili Tbilisi State University, Tbilisi; (b) High Energy Physics Institute, Tbilisi State University, Tbilisi, Georgia
52 II Physikalisches Institut, Justus-Liebig-Universität Giessen, Giessen, Germany
53 SUPA - School of Physics and Astronomy, University of Glasgow, Glasgow, United Kingdom
54 II Physikalisches Institut, Georg-August-Universität, Göttingen, Germany
55 Laboratoire de Physique Subatomique et de Cosmologie, Université Grenoble-Alpes, CNRS/IN2P3, Grenoble, France
56 Department of Physics, Hampton University, Hampton VA, United States of America
57 Laboratory for Particle Physics and Cosmology, Harvard University, Cambridge MA, United States of America
58 (a) Kirchhoff-Institut für Physik, Ruprecht-Karls-Universität Heidelberg, Heidelberg; (b) Physikalisches Institut, Ruprecht-Karls-Universität Heidelberg, Heidelberg; (c) ZITI Institut für technische Informatik, Ruprecht-Karls-Universität Heidelberg, Mannheim, Germany
59 Faculty of Applied Information Science, Hiroshima Institute of Technology, Hiroshima, Japan
60 Department of Physics, Indiana University, Bloomington IN, United States of America
61 Institut für Astro- und Teilchenphysik, Leopold-Franzens-Universität, Innsbruck, Austria
62 University of Iowa, Iowa City IA, United States of America
63 Department of Physics and Astronomy, Iowa State University, Ames IA, United States of America
64 Joint Institute for Nuclear Research, JINR Dubna, Dubna, Russia
65 KEK, High Energy Accelerator Research Organization, Tsukuba, Japan
66 Graduate School of Science, Kobe University, Kobe, Japan
67 Faculty of Science, Kyoto University, Kyoto, Japan
68 Kyoto University of Education, Kyoto, Japan
69 Department of Physics, Kyushu University, Fukuoka, Japan
70 Instituto de Física La Plata, Universidad Nacional de La Plata and CONICET, La Plata, Argentina
71 Physics Department, Lancaster University, Lancaster, United Kingdom
72 (a) INFN Sezione di Lecce; (b) Dipartimento di Matematica e Fisica, Università del Salento, Lecce, Italy
73 Oliver Lodge Laboratory, University of Liverpool, Liverpool, United Kingdom
74 Department of Physics, Jožef Stefan Institute and University of Ljubljana, Ljubljana, Slovenia
75 School of Physics and Astronomy, Queen Mary University of London, London, United Kingdom
76 Department of Physics, Royal Holloway University of London, Surrey, United Kingdom
77 Department of Physics and Astronomy, University College London, London, United Kingdom
78 Louisiana Tech University, Ruston LA, United States of America
79 Laboratoire de Physique Nucléaire et de Hautes Energies, UPMC and Université Paris-Diderot and CNRS/IN2P3, Paris, France
80 Fysiska institutionen, Lunds universitet, Lund, Sweden
81 Departamento de Fisica Teorica C-15, Universidad Autonoma de Madrid, Madrid, Spain
82 Institut für Physik, Universität Mainz, Mainz, Germany
83 School of Physics and Astronomy, University of Manchester, Manchester, United Kingdom
84 CPPM, Aix-Marseille Université and CNRS/IN2P3, Marseille, France
85 Department of Physics, University of Massachusetts, Amherst MA, United States of America
86 Department of Physics, McGill University, Montreal QC, Canada
87 School of Physics, University of Melbourne, Victoria, Australia
88 Department of Physics, The University of Michigan, Ann Arbor MI, United States of America
89 Department of Physics and Astronomy, Michigan State University, East Lansing MI, United States of America
90 (a) INFN Sezione di Milano; (b) Dipartimento di Fisica, Università di Milano, Milano, Italy
91 B.I. Stepanov Institute of Physics, National Academy of Sciences of Belarus, Minsk, Republic of Belarus
92 National Scientific and Educational Centre for Particle and High Energy Physics, Minsk, Republic of Belarus
93 Department of Physics, Massachusetts Institute of Technology, Cambridge MA, United States of America
94 Group of Particle Physics, University of Montreal, Montreal QC, Canada
95 P.N. Lebedev Institute of Physics, Academy of Sciences, Moscow, Russia
96 Institute for Theoretical and Experimental Physics (ITEP), Moscow, Russia
97 Moscow Engineering and Physics Institute (MEPhI), Moscow, Russia
98 D.V.Skobeltsyn Institute of Nuclear Physics, M.V.Lomonosov Moscow State University, Moscow, Russia
99 Fakultät für Physik, Ludwig-Maximilians-Universität München, München, Germany
100 Max-Planck-Institut für Physik (Werner-Heisenberg-Institut), München, Germany
101 Nagasaki Institute of Applied Science, Nagasaki, Japan
102 Graduate School of Science and Kobayashi-Maskawa Institute, Nagoya University, Nagoya, Japan
103 (a) INFN Sezione di Napoli; (b) Dipartimento di Fisica, Università di Napoli, Napoli, Italy
104 Department of Physics and Astronomy, University of New Mexico, Albuquerque NM, United States of America
105 Institute for Mathematics, Astrophysics and Particle Physics, Radboud University Nijmegen/Nikhef, Nijmegen, Netherlands
106 Nikhef National Institute for Subatomic Physics and University of Amsterdam, Amsterdam, Netherlands
107 Department of Physics, Northern Illinois University, DeKalb IL, United States of America
108 Budker Institute of Nuclear Physics, SB RAS, Novosibirsk, Russia
109 Department of Physics, New York University, New York NY, United States of America
110 Ohio State University, Columbus OH, United States of America
111 Faculty of Science, Okayama University, Okayama, Japan
112 Homer L. Dodge Department of Physics and Astronomy, University of Oklahoma, Norman OK, United States of America
113 Department of Physics, Oklahoma State University, Stillwater OK, United States of America
114 Palacký University, RCPTM, Olomouc, Czech Republic
115 Center for High Energy Physics, University of Oregon, Eugene OR, United States of America
116 LAL, Université Paris-Sud and CNRS/IN2P3, Orsay, France
117 Graduate School of Science, Osaka University, Osaka, Japan
118 Department of Physics, University of Oslo, Oslo, Norway
119 Department of Physics, Oxford University, Oxford, United Kingdom
120 (a) INFN Sezione di Pavia; (b) Dipartimento di Fisica, Università di Pavia, Pavia, Italy
121 Department of Physics, University of Pennsylvania, Philadelphia PA, United States of America
122 Petersburg Nuclear Physics Institute, Gatchina, Russia
123 (a) INFN Sezione di Pisa; (b) Dipartimento di Fisica E. Fermi, Università di Pisa, Pisa, Italy
124 Department of Physics and Astronomy, University of Pittsburgh, Pittsburgh PA, United States of America
125 (a) Laboratorio de Instrumentacao e Fisica Experimental de Particulas - LIP, Lisboa; (b) Faculdade de Ciências, Universidade de Lisboa, Lisboa; (c) Department of Physics, University of Coimbra, Coimbra; (d) Centro de Física Nuclear da Universidade de Lisboa, Lisboa; (e) Departamento de Fisica, Universidade do Minho, Braga; (f) Departamento de Fisica Teorica y del Cosmos and CAFPE, Universidad de Granada, Granada (Spain); (g) Dep Fisica and CEFITEC of Faculdade de Ciencias e Tecnologia, Universidade Nova de Lisboa, Caparica, Portugal
126 Institute of Physics, Academy of Sciences of the Czech Republic, Praha, Czech Republic
127 Czech Technical University in Prague, Praha, Czech Republic
128 Faculty of Mathematics and Physics, Charles University in Prague, Praha, Czech Republic
129 State Research Center Institute for High Energy Physics, Protvino, Russia
130 Particle Physics Department, Rutherford Appleton Laboratory, Didcot, United Kingdom
131 Physics Department, University of Regina, Regina SK, Canada
132 Ritsumeikan University, Kusatsu, Shiga, Japan
133 (a) INFN Sezione di Roma; (b) Dipartimento di Fisica, Sapienza Università di Roma, Roma, Italy
134 (a) INFN Sezione di Roma Tor Vergata; (b) Dipartimento di Fisica, Università di Roma Tor Vergata, Roma, Italy
135 (a) INFN Sezione di Roma Tre; (b) Dipartimento di Matematica e Fisica, Università Roma Tre, Roma, Italy
136 (a) Faculté des Sciences Ain Chock, Réseau Universitaire de Physique des Hautes Energies - Université Hassan II, Casablanca; (b) Centre National de l’Energie des Sciences Techniques Nucleaires, Rabat; (c) Faculté des Sciences Semlalia, Université Cadi Ayyad, LPHEA-Marrakech; (d) Faculté des Sciences, Université Mohamed Premier and LPTPM, Oujda; (e) Faculté des sciences, Université Mohammed V-Agdal, Rabat, Morocco
137 DSM/IRFU (Institut de Recherches sur les Lois Fondamentales de l’Univers), CEA Saclay (Commissariat à l’Energie Atomique et aux Energies Alternatives), Gif-sur-Yvette, France
138 Santa Cruz Institute for Particle Physics, University of California Santa Cruz, Santa Cruz CA, United States of America
139 Department of Physics, University of Washington, Seattle WA, United States of America
140 Department of Physics and Astronomy, University of Sheffield, Sheffield, United Kingdom
141 Department of Physics, Shinshu University, Nagano, Japan
142 Fachbereich Physik, Universität Siegen, Siegen, Germany
143 Department of Physics, Simon Fraser University, Burnaby BC, Canada
144 SLAC National Accelerator Laboratory, Stanford CA, United States of America
145 (a) Faculty of Mathematics, Physics & Informatics, Comenius University, Bratislava; (b) Department of Subnuclear Physics, Institute of Experimental Physics of the Slovak Academy of Sciences, Kosice, Slovak Republic
146 (a) Department of Physics, University of Cape Town, Cape Town; (b) Department of Physics, University of Johannesburg, Johannesburg; (c) School of Physics, University of the Witwatersrand, Johannesburg, South Africa
147 (a) Department of Physics, Stockholm University; (b) The Oskar Klein Centre, Stockholm, Sweden
148 Physics Department, Royal Institute of Technology, Stockholm, Sweden
149 Departments of Physics & Astronomy and Chemistry, Stony Brook University, Stony Brook NY, United States of America
150 Department of Physics and Astronomy, University of Sussex, Brighton, United Kingdom
151 School of Physics, University of Sydney, Sydney, Australia
152 Institute of Physics, Academia Sinica, Taipei, Taiwan
153 Department of Physics, Technion: Israel Institute of Technology, Haifa, Israel
154 Raymond and Beverly Sackler School of Physics and Astronomy, Tel Aviv University, Tel Aviv, Israel
155 Department of Physics, Aristotle University of Thessaloniki, Thessaloniki, Greece
156 International Center for Elementary Particle Physics and Department of Physics, The University of Tokyo, Tokyo, Japan
157 Graduate School of Science and Technology, Tokyo Metropolitan University, Tokyo, Japan
158 Department of Physics, Tokyo Institute of Technology, Tokyo, Japan
159 Department of Physics, University of Toronto, Toronto ON, Canada
160 (a) TRIUMF, Vancouver BC; (b) Department of Physics and Astronomy, York University, Toronto ON, Canada
161 Faculty of Pure and Applied Sciences, University of Tsukuba, Tsukuba, Japan
162 Department of Physics and Astronomy, Tufts University, Medford MA, United States of America
163 Centro de Investigaciones, Universidad Antonio Narino, Bogota, Colombia
164 Department of Physics and Astronomy, University of California Irvine, Irvine CA, United States of America
165 (a) INFN Gruppo Collegato di Udine, Sezione di Trieste, Udine; (b) ICTP, Trieste; (c) Dipartimento di Chimica, Fisica e Ambiente, Università di Udine, Udine, Italy
166 Department of Physics, University of Illinois, Urbana IL, United States of America
167 Department of Physics and Astronomy, University of Uppsala, Uppsala, Sweden
168 Instituto de Física Corpuscular (IFIC) and Departamento de Física Atómica, Molecular y Nuclear and Departamento de Ingeniería Electrónica and Instituto de Microelectrónica de Barcelona (IMB-CNM), University of Valencia and CSIC, Valencia, Spain
169 Department of Physics, University of British Columbia, Vancouver BC, Canada
170 Department of Physics and Astronomy, University of Victoria, Victoria BC, Canada
171 Department of Physics, University of Warwick, Coventry, United Kingdom
172 Waseda University, Tokyo, Japan
173 Department of Particle Physics, The Weizmann Institute of Science, Rehovot, Israel
174 Department of Physics, University of Wisconsin, Madison WI, United States of America
175 Fakultät für Physik und Astronomie, Julius-Maximilians-Universität, Würzburg, Germany
176 Fachbereich C Physik, Bergische Universität Wuppertal, Wuppertal, Germany
177 Department of Physics, Yale University, New Haven CT, United States of America
178 Yerevan Physics Institute, Yerevan, Armenia
179 Centre de Calcul de l’Institut National de Physique Nucléaire et de Physique des Particules (IN2P3), Villeurbanne, France
a Also at Department of Physics, King’s College London, London, United Kingdom
b Also at Institute of Physics, Azerbaijan Academy of Sciences, Baku, Azerbaijan
c Also at Particle Physics Department, Rutherford Appleton Laboratory, Didcot, United Kingdom
d Also at TRIUMF, Vancouver BC, Canada
e Also at Department of Physics, California State University, Fresno CA, United States of America
f Also at Tomsk State University, Tomsk, Russia
g Also at CPPM, Aix-Marseille Université and CNRS/IN2P3, Marseille, France
h Also at Università di Napoli Parthenope, Napoli, Italy
i Also at Institute of Particle Physics (IPP), Canada
j Also at Department of Physics, St. Petersburg State Polytechnical University, St. Petersburg, Russia
k Also at Chinese University of Hong Kong, China
l Also at Department of Financial and Management Engineering, University of the Aegean, Chios, Greece
m Also at Louisiana Tech University, Ruston LA, United States of America
n Also at Institucio Catalana de Recerca i Estudis Avancats, ICREA, Barcelona, Spain
o Also at Department of Physics, The University of Texas at Austin, Austin TX, United States of America
p Also at Institute of Theoretical Physics, Ilia State University, Tbilisi, Georgia
q Also at CERN, Geneva, Switzerland
r Also at Ochadai Academic Production, Ochanomizu University, Tokyo, Japan
s Also at Manhattan College, New York NY, United States of America
t Also at Novosibirsk State University, Novosibirsk, Russia
u Also at Institute of Physics, Academia Sinica, Taipei, Taiwan
v Also at LAL, Université Paris-Sud and CNRS/IN2P3, Orsay, France
w Also at Academia Sinica Grid Computing, Institute of Physics, Academia Sinica, Taipei, Taiwan
x Also at Laboratoire de Physique Nucléaire et de Hautes Energies, UPMC and Université Paris-Diderot and CNRS/IN2P3, Paris, France
y Also at School of Physical Sciences, National Institute of Science Education and Research, Bhubaneswar, India
z Also at Dipartimento di Fisica, Sapienza Università di Roma, Roma, Italy
aa Also at Moscow Institute of Physics and Technology State University, Dolgoprudny, Russia
ab Also at Section de Physique, Université de Genève, Geneva, Switzerland
ac Also at International School for Advanced Studies (SISSA), Trieste, Italy
ad Also at Department of Physics and Astronomy, University of South Carolina, Columbia SC, United States of America
ae Also at School of Physics and Engineering, Sun Yat-sen University, Guangzhou, China
af Also at Faculty of Physics, M.V.Lomonosov Moscow State University, Moscow, Russia
ag Also at Moscow Engineering and Physics Institute (MEPhI), Moscow, Russia
ah Also at Institute for Particle and Nuclear Physics, Wigner Research Centre for Physics, Budapest, Hungary
ai Also at Department of Physics, Oxford University, Oxford, United Kingdom
aj Also at Department of Physics, Nanjing University, Jiangsu, China
ak Also at Institut für Experimentalphysik, Universität Hamburg, Hamburg, Germany
al Also at Department of Physics, The University of Michigan, Ann Arbor MI, United States of America
am Also at Discipline of Physics, University of KwaZulu-Natal, Durban, South Africa
an Also at University of Malaya, Department of Physics, Kuala Lumpur, Malaysia
∗ Deceased