The stellar initial mass function at 0.9z1.5
Abstract
We explore the stellar initial mass function (IMF) of a sample of 49 massive quiescent galaxies (MQGs) at 0.9z1.5. We base our analysis on intermediate resolution spectro-photometric data in the GOODS-N field taken in the near-infrared and optical with the HST/WFC3 G141 grism and the Survey for High-z Absorption Red and Dead Sources (SHARDS). To constrain the slope of the IMF, we have measured the TiO2 spectral feature, whose strength depends strongly on the content of low-mass stars, as well as on stellar age. Using ultraviolet to near-infrared individual and stacked spectral energy distributions, we have independently estimated the stellar ages of our galaxies. Knowing the age of the stellar population, we interpret the strong differences in the TiO2 feature as an IMF variation. In particular, for the heaviest z1 MQGs (M1011M☉) we find an average age of 1.70.3 Gyr and a bottom-heavy IMF (=3.20.2). Lighter MQGs ( 21010M1011 M☉) at the same redshift are younger on average (1.00.2 Gyr) and present a shallower IMF slope (). Our results are in good agreement with the findings about the IMF slope in early-type galaxies of similar mass in the present-day Universe. This suggests that the IMF, a key characteristic of the stellar populations in galaxies, is bottom-heavier for more massive galaxies and has remained unchanged in the last 8 Gyr.
Subject headings
galaxies: formation — galaxies: evolution — galaxies: high-redshift — galaxies: fundamental parameters — galaxies: stellar contentI. Introduction
The initial mass function (IMF) dictates the distribution of stellar masses for any single star formation event in a galaxy. Consequently, it determines the number of massive stars formed and being responsible for the feedback and chemical processes. The IMF also fix the numbers of low-mass stars, which dominate the total stellar mass of a galaxy.
Growing evidence support a non-universal IMF in the nearby Universe, where massive early-type galaxies (ETGs) show an enhanced fraction of dwarf stars in the center compared to the Milky Way [44]. Moreover, the dwarf-to-giant ratio, i.e., the IMF slope, correlates with the central velocity dispersion [9, 41, 8, 15, 24, 13, 38]. These results challenge the existence of a universal IMF inferred from resolved stellar population analysis in the Local Group [22, 3, 23].
To have a consistent picture of galaxy evolution, it is absolutely necessary to investigate the IMF at different redshifts. So far, the IMF of z1 galaxies has been studied indirectly using virial masses [35, 42] or elaborated dynamical models [37]. These works point to a Salpeter [36] IMF for massive galaxies at intermediate redshift. Other indirect IMF-sensitive observables have also been used in the topic. For instance, the consistency between the cosmic stellar mass and star formation rate densities [14, 33] and the luminosity evolution of massive ETGs [43] are better described by a flatter (i.e., with a relatively larger number of massive stars) IMF at higher look-back times. Even in star-forming galaxies, the constancy of the IMF is in tension with observations [19, 29]
Here we explore, for the first time, the IMF slope at z1 using stellar populations synthesis models in massive quiescent galaxies (MQGs). To achieve this goal, we study the TiO2 IMF-sensitive spectral feature [30]. In Section 2, we describe the data. The IMF inference is explained in Section 3. In Section 4, we discuss our results. We adopt a standard cosmology: H0= 70 km s-1 Mpc-1, = 0.3, and =0.7.
II. Sample and data description


To facilitate the determination of the IMF slope at high-z, we study galaxies with no signs of recent star formation (quiescent galaxies). These objects have simpler Star Formation Histories (SFHs) than star-forming galaxies and are sufficiently well represented by a single stellar population (SSP) model [48, e.g.,].
MQGs at 0.9z1.5 were selected with two criteria: (1) the diagram complemented with fluxes in the MIR/FIR; and (2) a sSFR vs. stellar mass plot. We worked with the mass selected sample presented in Pérez-González et al. [33]. From this work, we took the spectral energy distributions (SEDs), stellar population and dust emission models for all IRAC sources in GOODS-N. Those SEDs were complemented with medium-band optical photometry from the Survey for High-z Absorption Red and Dead Sources, SHARDS [34]. The broad- and medium-band photometry was fitted with a variety of stellar population models to obtain photometric redshifts, stellar masses, SFRs, and rest-frame synthetic colors [1, 2, see]. Thanks to the ultra-deep medium-band data from SHARDS, the quality of our photometric redshifts is excellent: the median is 0.0067 for the 2650 sources with 25 (Pérez-González et al. 2014, in prep; Ferreras et al. 16). SFRs were calculated for all galaxies using various dust emission templates and the Spitzer-MIPS and Herschel-PACS/SPIRE fluxes, jointly with UV-based measurements for non-detections in the MIR/FIR. The UV-based SFRs were corrected for extinction with the UV slope and an extrapolation of the IR- (IRX) relationship [28]. The extrapolation technique was developed to recalibrate the IRX- relation using faint IR emitters (more similar to MIR-undetected galaxies) at the same redshifts. Details about the selection will be given in Domínguez Sánchez et al. (2014, in prep.).
Using this dataset, we selected galaxies at 0.9z1.5 having stellar masses M 21010 M☉ (Kroupa 21 IMF), and rest-frame colors within the quiescent galaxy wedge (1.3, 1.6, 0.88+0.59; Whitaker et al. 47). The mass cut was chosen to allow measuring the TiO2 absorption in the grism spectra described below. The -selected sample was complemented with galaxies with sSFR0.2 Gyr-1, our limit for quiescence. Galaxies with MIPS detections were removed from the sample, as the MIR emission indicates active/residual star formation or nuclear activity, which would complicate the stellar population analysis. Using these two criteria, we selected 124 sources in the 112 arcmin2 covered simultaneously by GOODS, SHARDS, CANDELS, and Herschel-GOODS.
The TiO2 spectral index was measured in stacked WFC3/G141 grism data (covering 1.11.6 m) from the AGHAST survey (PI: Weiner). We selected all galaxies with 25.5 mag from the F160W imaging in CANDELS [17, 20] and reduced the grism data to extract 2D spectra using the aXe software (version 2.3). Then we collapsed the data to obtain 1D spectra using our own dedicated software. The reduction used 0.064 arcsec/pixel and 23.5 Å/pixel. The 1D extractions were optimized for each galaxy using its effective radius, position angle, and the contamination map provided by aXe. Visual inspection helped to remove spectra with significant contamination and/or artifacts, leaving 97 galaxies with usable G141 spectra. We kept the spectra with SNR5 per pixel. Our final sample is composed by 57 galaxies with 21010M/M☉1011.5 (M1010.6 M☉) and 0.9z1.5 (z1.1). Reliable spectroscopic redshifts were available for 33 galaxies; the median quality of the photo-redshifts for M1010.5 M☉ galaxies is 0.0047.
Measurements were carried out in stacked spectra of these 57 z1 MQGs. We dissected the sample to probe the lowest and highest mass regimes with two stacked spectra of similar SNR (Figures 1,2). The high-mass sample was composed by 7 galaxies with M1011 M☉ (=19.7-21.3 mag), and the low-mass spectra by 50 galaxies with M 21010 M☉ (=20.3-22.4 mag). To build the stacks, we first de-redshifted all individual observed spectra, then normalizing them to the TiO2 continuum (see next section). We calculated flux averages and errors in rest-frame wavelength bins of 10 Å. Finally, we smoothed the stacks with a 20 Åboxcar kernel. The average SNR per resolution element of the final stacked (smoothed) spectra is 70 (100), 100 (140) around the TiO2 absorption.
III. SED analysis: ages and IMF slope
The integrated spectral properties of a SSP are defined by four parameters: age, metallicity ([Z/H]), IMF and -elements over-abundance ([/Fe]). In this Letter, we analyze the TiO2 absorption, an IMF-sensitive feature which depends very weakly on [Z/H] and [/Fe] [40, 24]. We present the age and IMF constraints for z1 MQGs based on this TiO2 spectral index as well as on the ultraviolet to near-infrared SEDs. In Section IV, we discuss the impact of the unknown values of [Z/H] and [/Fe] on our results. The TiO2 absorption is wide and deep enough to be measured with WFC3 grism data. Measurements for other IMF-sensitive features (see Figures 1,2) would be compromised by low SNR at 500 nm, the low spectral resolution in the case of NaD, or the proximity to emission features in the case of CaH2. Thus, we concentrate our IMF analysis on TiO2 measurements.
III.1. Age determination
To constrain the age of the stellar population, we used three different methods. First, we fitted the G141 grism stacked spectra constrained to the rest-frame wavelength range 500800 nm (Figures 1,2). We used the Bruzual & Charlot [6, hereafter BC03] models fed with the XMILES library (Charlot & Bruzual, private communication). We assumed a SSP with solar and super-solar metallicities, and a Calzetti et al. [7] attenuation law, and fitted the data to obtain ages, extinctions, and metallicities. We tested how the results were affected by: (1) using Salpeter [36], Kroupa [21], and Chabrier [10] IMFs; (2) different attenuation recipes, namely, Calzetti et al. [7], appropriate for starburst galaxies, and the more general law from Charlot & Fall [11]; and (3) different stellar population synthesis libraries and codes, namely, BC03 using XMILES and STELIB[25] libraries, and MIUSCAT [46]. In all cases, we found negligible differences in the estimated ages (0.1 Gyr) and extinctions (0.1 mag). Our fitting method included a Montecarlo algorithm to analyze uncertainties and degeneracies (see Pérez-González et al. 34). Given the short wavelength range probed by the grism data, the dust extinction was not well constrained. Indeed, we found a strong age-extinction degeneracy. For example, for the high-mass stack, equally good fits were obtained for stellar populations with relatively young ages (1 Gyr) and large extinctions (A(V)1.5 mag) and for older ages and lower extinctions (1–2 Gyr and A(V)1 mag). Constraining the extinction to A(V)1 mag, we found that the stacked high-mass spectrum was best fitted by a SSP with solar metallicity, t1.60.2 Gyr, and A(V)0.50.3 mag. The low-mass stack was best fitted with solar metallicity, t1.00.2 Gyr, and A(V)0.70.3 mag.
Our second age determination method used the whole UV-to-NIR stacked SED (Figures 1, 2). The SHARDS medium-band and grism data allow accurate measurements of both the 4000 Å break and the MgUV absorption, two very good age estimators [see 34, 18, 16, and references therein]. The wider spectral range resulted in better constraints on the age and the extinction. The best-fitting BC03/XMILES SSP model provided 1.770.17 Gyr, A(V)0.600.06, and 1.020.15 Gyr and A(V)0.700.06 for the high-mass and low-mass samples, respectively (solar metallicity in both cases). Again, very similar results were obtained with other IMFs, extinction recipes, and stellar population libraries. Under an unrealistic assumption of A(V)0, the best-fitting ages were 1.5 Gyr and 2.6 Gyr for the low- and high-mass stacks, respectively. These solutions provide, based on the values, worse fits, and do not affect our main conclusions (cf. Section IV).
Finally, we measured the stellar population ages fitting the whole UV-to-NIR SED for each individual galaxy also using the Montecarlo method, and calculating average properties for the low and high-mass sub-samples. These were remarkably and reassuringly similar (within the uncertainties) to the ones obtained with the other methods: t1.00.2 Gyr with A(V)0.90.2 mag and t1.50.3 Gyr with A(V)0.90.3 mag for the low-mass and high-mass samples, respectively.
Our age estimations are completely consistent with those obtained by Whitaker et al. [48] using a stacked G141 grism spectrum around the H absorption also for -selected MQGs, but at 1.4z2.2. They find ages between 0.9 Gyr and 1.6 Gyr for blue and red massive galaxies, very similar to the ranges we find for the our two sub-samples. Consistent ages are also found for MQGs at z1 (selected in a variety of ways and counting with heterogeneous data) by Onodera et al. [32], van de Sande et al. [42], Bedregal et al. [4], and Marchesini et al. [26]. In summary, the ages of the - and sSFR-selected z1 MQGs are confidently constrained to be 2 Gyr.
III.2. IMF estimation
Once average ages were determined, we proceeded to the IMF analysis based on the TiO2 absorption. Given that this molecular band dominates the spectrum of cool-dwarf stars between 600 and 640 nm, it has been widely used to infer the IMF slope in unresolved stellar systems [15, 24, 38].
We used the MILES SSP models [46], where the IMF is parametrized as a single power law, truncated (i.e., flatted out) for stellar masses below M0.6 M⊙. This bimodal IMF is completely described by a single parameter, [45, see]. Under this parametrization, the Kroupa (2001) IMF is recovered for 1.3. The main advantage of the bimodal IMF, compared to a regular single power law (Salpeter-like) IMF, is the fact that, even when dealing with very high values, the ratio remains within the observational limits suggested by dynamical studies [15]. From the point of view of the stellar population properties, both bimodal and uni-modal IMF parametrizations are indistinguishable.
MILES models cover a range from dex to dex in metallicity, 0.06 Gyr to 17 Gyr in age, and 0.3–3.3 in IMF slopes. Given the weak dependence of the TiO2 index with metallicity, we fixed it to solar (as suggested by the SED fitting).
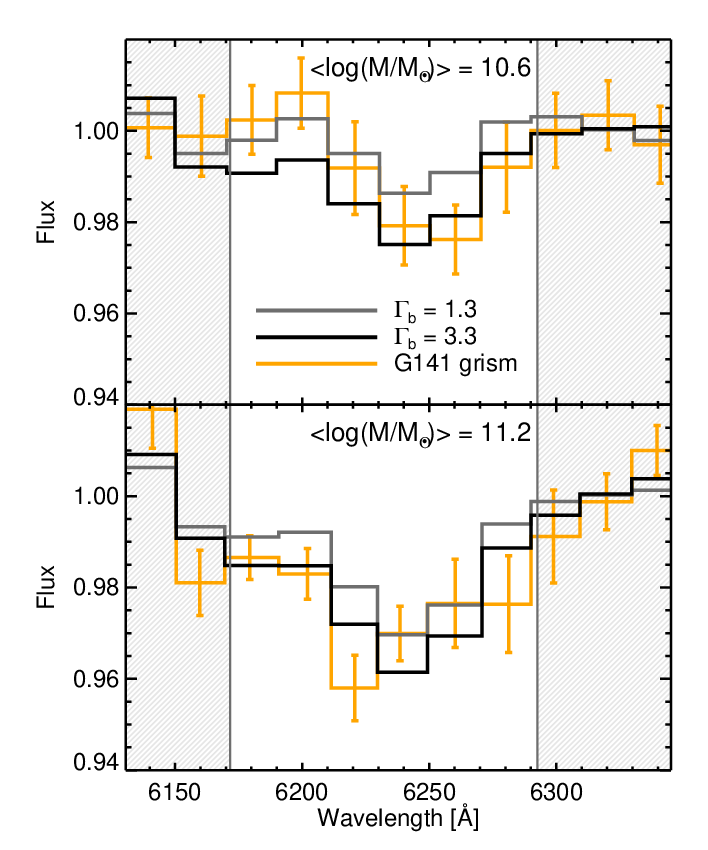
The classical definition for the TiO2 spectral index expands along 400 Å, making it extremely sensitive to the adopted flux calibration [27, see Section 5 in]. To improve the signal, we redefined the blue and red TiO2 pseudo-continua, making them contiguous to the central bandpass. The adopted blue and red pseudo-continua are 613.0–617.2 nm and 629.3–634.5 nm, respectively. Figure 3 presents, for both stacks, the data and fits to the TiO2 spectral region.
The analysis of the TiO2 absorption was based on fits to the six spectral elements (P) within the central band of our TiO2 index definition, after removing the continuum. The models were degraded to the same spectral resolution (P). The goodness of the fit was estimated with a function:
| (1) |
where represents the estimated error of the flux in each spectral bin. The maps in the age-IMF slope plane for the low- and high-mass samples are shown in Figure 4.
IV. Discussion
Figure 4 shows our constraints on the stellar population age and IMF slope for MQGs at z1. As expected, there is a clear IMF/age degeneracy: similar TiO2 values are obtained by either an old population with a standard Kroupa-like IMF or with a steeper IMF and younger ages. To further constrain the IMF, we use the age determinations from the SED fitting.

For the high-mass sample, Figure 4 shows that our age determination of 1.70.3 Gyr combined with the TiO2 index measurements strongly suggest that the IMF of M1011 M☉ MQGs at z1 is bottom-heavy. The IMF slope is =3.20.2, very similar to that measured for present-day early-type galaxies [24, 38]. For the low-mass stack, considering a typical age of 1.00.2 Gyr, we find that the IMF is flatter: . The uncertainty in this case is larger, mainly because the degeneracies between age and IMF increase for younger ages and flatter IMFs. Using these IMF values, and assuming a bimodal parametrization, the mass-limits of our stacks change to M1011.5M☉ and 1010.7M1011.5 M☉ for the high- and low-mass stacks, respectively. Although our age constraints are rather conservative (see Section III.1), an offset of 0.5 Gyr in the lighter stack would leave the IMF slope unconstrained below . Such a large error in a 1 Gyr old population is not expected, but the IMF determination of this lighter stack should be considered more tentative than that for the massive stack. Furthermore, low-mass galaxies tend to have more extended SFHs [39] and therefore, their SED may be less well represented by a single SSP. Note also that the departure from a SSP is expected to become larger if galaxies are observed closer to their formation age. This slightly extended star formation history in the lighter stack increases the scatter in the UV region, as shown in the upper left panel of Figures 1,2. In addition, at lower stellar masses the nature of galaxies becomes more heterogeneous, increasing the likelihood of having systems following different evolutionary tracks (e.g., disks and spheroids with different assembly histories maybe affecting the IMF).
Two main caveats should be considered before further interpreting our data: the effect of -element enhancement and metallicity. Our fits do not account for non-solar -elements abundances. Massive galaxies exhibit an enhanced fraction of -elements compared to the solar neighborhood, commonly interpreted as an imprint of a fast formation process [39]. For a 1-2 Gyr old population, an overabundance of 1 dex in [Ti/Fe] would be needed to mimic the effect of a 3.2 IMF [40]. However, La Barbera et al. [24] found an excess of only 0.2 dex in [Ti/Fe] for massive galaxies at . Therefore, unless the situation is totally different at high-z [12, but see], our TiO2 measurement is unlikely to be explained with a standard IMF plus a non-solar [Ti/Fe] abundance. The second caveat relates to the fact that we have used models with fixed solar metallicity. The effect of the metallicity on the TiO2 line is very weak but not null. In this sense, we find steeper IMFs when assuming larger metallicities. However, neither our SED fits, nor z0 massive galaxies [24] suggest a strong departure from solar metallicity. On the contrary, an overestimation of the actual metallicity would weakly mimic the effect of a step IMF slope on the TiO2 feature. However, sub-solar metallicities can be ruled out considering that galaxies as massive as those in our sample, show almost no metallicity evolution since [12], being metal-rich at [24]. Thus, our results are robust against a poor metallicity determination.

In a more qualitative way, in Figure 5 we compare our results with the IMF slope vs. velocity dispersion relation found in the nearby Universe [15]. We have translated our stellar mass scale to velocity dispersion using individual measurements for our galaxies and statistical properties for samples at the same redshift and selected in similar way. Based on measurements found in the literature [42, 5, mainly in] for galaxies with similar masses at similar redshifts, we obtain an average velocity dispersion of 25210 km s-1 and 2088 km s-1 for our high- and low-mass stacks, respectively. In addition, individual velocity dispersions have been measured for two galaxies contributing to our low-mass stacked spectrum [31]. The mass of one of these galaxies is M1010.6 M☉ and its velocity dispersion 206 km s-1, and for the other M1010.9 M☉ and 239 km s-1. According to Figure 5, our z1 IMF estimations are in good agreement with the IMF slope in early-type galaxies of similar mass in the present-day Universe. This suggests a direct evolutionary link between both populations and that the IMF, a key characteristic of the stellar populations in galaxies, have remained unchanged in the last 8 Gyr.
References
- [1] Barro, G., Pérez-González, P. G., Gallego, J., et al. 2011a, ApJS, 193, 13
- [2] —. 2011b, ApJS, 193, 30
- [3] Bastian, N., Covey, K. R., & Meyer, M. R. 2010, ARA&A, 48, 339
- [4] Bedregal, A. G., Scarlata, C., Henry, A. L., et al. 2013, ApJ, 778, 126
- [5] Belli, S., Newman, A. B., & Ellis, R. S. 2014, ApJ, 783, 117
- [6] Bruzual, G., & Charlot, S. 2003, MNRAS, 344, 1000
- [7] Calzetti, D., Armus, L., Bohlin, R. C., et al. 2000, ApJ, 533, 682
- [8] Cappellari, M., McDermid, R. M., Alatalo, K., et al. 2012, Nature, 484, 485
- [9] Cenarro, A. J., Gorgas, J., Vazdekis, A., Cardiel, N., & Peletier, R. F. 2003, MNRAS, 339, L12
- [10] Chabrier, G. 2003, PASP, 115, 763
- [11] Charlot, S., & Fall, S. M. 2000, ApJ, 539, 718
- [12] Choi, J., Conroy, C., Moustakas, J., et al. 2014, ArXiv e-prints, arXiv:1403.4932
- [13] Conroy, C., Dutton, A. A., Graves, G. J., Mendel, J. T., & van Dokkum, P. G. 2013, ApJ, 776, L26
- [14] Davé, R. 2008, MNRAS, 385, 147
- [15] Ferreras, I., La Barbera, F., de la Rosa, I. G., et al. 2013a, MNRAS, 429, L15
- [16] Ferreras, I., Trujillo, I., Mármol-Queraltó, E., et al. 2013b, ArXiv e-prints, arXiv:1312.5317
- [17] Grogin, N. A., Kocevski, D. D., Faber, S. M., et al. 2011, ApJS, 197, 35
- [18] Hernán-Caballero, A., Alonso-Herrero, A., Pérez-González, P. G., et al. 2013, MNRAS, 434, 2136
- [19] Hoversten, E. A., & Glazebrook, K. 2008, ApJ, 675, 163
- [20] Koekemoer, A. M., Faber, S. M., Ferguson, H. C., et al. 2011, ApJS, 197, 36
- [21] Kroupa, P. 2001, MNRAS, 322, 231
- [22] —. 2002, Science, 295, 82
- [23] Kroupa, P., Weidner, C., Pflamm-Altenburg, J., et al. 2013, 115
- [24] La Barbera, F., Ferreras, I., Vazdekis, A., et al. 2013, MNRAS, 433, 3017
- [25] Le Borgne, J.-F., Bruzual, G., Pelló, R., et al. 2003, A&A, 402, 433
- [26] Marchesini, D., Muzzin, A., Stefanon, M., et al. 2014, ArXiv e-prints, arXiv:1402.0003
- [27] Martín-Navarro, I., La Barbera, F., Vazdekis, A., Falcón-Barroso, J., & Ferreras, I. 2014, ArXiv e-prints, arXiv:1404.6533
- [28] Meurer, G. R., Heckman, T. M., & Calzetti, D. 1999, ApJ, 521, 64
- [29] Meurer, G. R., Wong, O. I., Kim, J. H., et al. 2009, ApJ, 695, 765
- [30] Mould, J. R. 1976, A&A, 48, 443
- [31] Newman, A. B., Ellis, R. S., Treu, T., & Bundy, K. 2010, ApJ, 717, L103
- [32] Onodera, M., Renzini, A., Carollo, M., et al. 2012, ApJ, 755, 26
- [33] Pérez-González, P. G., Rieke, G. H., Villar, V., et al. 2008, ApJ, 675, 234
- [34] Pérez-González, P. G., Cava, A., Barro, G., et al. 2013, ApJ, 762, 46
- [35] Renzini, A. 2006, ARA&A, 44, 141
- [36] Salpeter, E. E. 1955, ApJ, 121, 161
- [37] Shetty, S., & Cappellari, M. 2014, ApJ, 786, L10
- [38] Spiniello, C., Trager, S., Koopmans, L. V. E., & Conroy, C. 2014, MNRAS, 438, 1483
- [39] Thomas, D., Maraston, C., Bender, R., & Mendes de Oliveira, C. 2005, ApJ, 621, 673
- [40] Thomas, D., Maraston, C., & Johansson, J. 2011, MNRAS, 412, 2183
- [41] Treu, T., Auger, M. W., Koopmans, L. V. E., et al. 2010, ApJ, 709, 1195
- [42] van de Sande, J., Kriek, M., Franx, M., et al. 2013, ApJ, 771, 85
- [43] van Dokkum, P. G. 2008, ApJ, 674, 29
- [44] van Dokkum, P. G., & Conroy, C. 2010, Nature, 468, 940
- [45] Vazdekis, A., Casuso, E., Peletier, R. F., & Beckman, J. E. 1996, ApJS, 106, 307
- [46] Vazdekis, A., Sánchez-Blázquez, P., Falcón-Barroso, J., et al. 2010, MNRAS, 404, 1639
- [47] Whitaker, K. E., Labbé, I., van Dokkum, P. G., et al. 2011, ApJ, 735, 86
- [48] Whitaker, K. E., van Dokkum, P. G., Brammer, G., et al. 2013, ApJ, 770, L39