Extragalactic radio sources with sharply inverted spectrum at metre wavelengths
Abstract
We present the first results of a systematic search for the rare extragalactic radio sources showing an inverted (integrated) spectrum, with spectral index , a previously unexplored spectral domain. The search is expected to yield strong candidates for , for which the standard synchrotron self-absorption (characterized by a single power-law energy distribution of relativistic electron population) would not be a plausible explanation, even in an ideal case of a perfectly homogeneous source of incoherent synchrotron radiation. Such sharply inverted spectra, if found, would require alternative explanations, e.g., free-free absorption, or non-standard energy distribution of relativistic electrons which differs from a power-law (e.g., Maxwellian).
The search was carried out by comparing two sensitive low-frequency radio surveys made with sub-arcminute resolution, namely, the WISH survey at 352 MHz and TGSS/DR5 at 150 MHz. The overlap region between these two surveys contains 7056 WISH sources classified as ‘single’ and brighter than 100 mJy at 352 MHz. We focus here on the seven of these sources for which we find . Two of these are undetected at 150 MHz and are particularly good candidates for . Five of the seven sources exhibit a ‘Gigahertz-Peaked-Spectrum’ (GPS).
Keywords:
radiation mechanisms: non thermal – galaxies: ISM – galaxies: jets – galaxies: nuclei – quasars: general – radio continuum: galaxies1 Introduction
Synchrotron radiation that dominates the radio-frequency output of radio galaxies arises from regions covering a vast range in spatial scale. A warm gaseous environment around some or all of these components can, in principle, produce visible signatures (via free-free absorption: FFA) in the form of an inverted radio continuum spectrum. However, inverted radio spectra, when observed, are most commonly interpreted in terms of synchrotron self-absorption (SSA) occurring within the parsec-scale, or even more compact radio components revealed by Very Long Baseline Interferometry (VLBI) (e.g., Urry & Padovani 1995; O’Dea & Baum 1997). This is mainly because the standard SSA, which is characterized by a single power-law energy distribution of relativistic electrons in the source, can by itself produce an inverted spectrum with as large as = +2.5 (). Although attainable only for an implausibly ideal, perfectly homogeneous radio source, this spectral index limit is practically independent of the slope of power-law energy distribution of the radiating relativistic electrons (e.g., Slish 1963, Rybicki & Lightman 1979). As argued by Rees (1967), SSA can even cause somewhat larger than over just about one decade in frequency, when a significant non-power-law (e.g., mono-energetic, or Maxwellian) component is also present in the energy distribution of the relativistic electron population. A similar conclusion was reached by de Kool & Begelman (1989) by considering energy distributions in which the number of low-energy electrons is over-represented relative to a power-law extrapolation of the distribution at higher energies. Thus, finding examples of synchrotron radio sources having = +2.5 would help in tracing rare extragalactic radio sources dominated by either non-standard synchrotron emission process or FFA effects.
Until now, has only been demonstrated for parsec-scale inner segments of the VLBI jets in a few radio galaxies and quasars. Examples include the well known sources NGC 1275/Perseus A (Walker et al. 2000; Levinson et al. 1995), NGC 4261 (Jones et al. 2001) and 3C 345 (Matveenko, Pauliny-Toth & Sherwood 1990). In these cases, the ultra-steep inverted radio spectra have generally been attributed to FFA. Likewise, in the nearby elliptical NGC 1052, the innermost portion of the sub-parsec scale counter-jet shows a spectral cut-off with becoming larger than , which too has been interpreted in terms of FFA arising from an annular ring of ionized gas, possibly a geometrically thick, patchy disc (e.g., Vermeulen et al. 2003; also Kadler et al. 2004).
As far as the integrated radio spectra are concerned, an outburst with an extremely inverted spectrum with between 4.8 and 10.5 GHz has been reported for the blazar-like spiral galaxy III Zw 2 (Falcke et al. 1999) and it was attributed to SSA. Note that the integrated radio spectrum in this case was dominated by the flare and was thus a transient feature. More recently, Murphy et al. (2010) have noted a subset of extragalactic radio sources they termed ‘Ultra-inverted Spectrum Radio Sources’ (UIS). They showed that nearly per cent of the sources detected in the Australia Telescope Compact Array 20 GHz survey (AT20G) lack a counterpart in the lower frequency catalogues, like the NRAO Very Large Array Sky Survey (NVSS) at 1.4 GHz (Condon et al. 1998) and the Sydney University Molonglo Sky Survey (SUMSS)/ Molonglo Galactic Plane Survey (MGPS-2) at 843 MHz (Mauch et al. 2003; Murphy et al. 2007). The implied spectral indices between 5 and 20 GHz typically are , although values approaching +2.0 are also observed in a few cases; these are still consistent with the standard SSA characterized by a single power-law energy distribution of relativistic electrons . A similar situation exists in the case of ‘High-Frequency-Peakers’ (HFPs) studied by Dallacasa et al. (2000).
One numerically significant class of sources for which a low-frequency spectral turnover is the defining characteristic is the ‘Gigahertz-Peaked-Spectrum’ (GPS) sources (e.g., Gopal-Krishna, Patnaik & Steppe 1983; Spoelstra, Patnaik & Gopal-Krishna 1985; Gopal-Krishna & Spoelstra 1993). The earliest example of such sources can be traced back to Bolton, Gardner & Mackey (1963) and Kellermann (1966) (see, also, Phillips & Mutel 1982). These sources exhibit a convex radio spectrum peaking in the region between 1 and 5 GHz, are mostly kiloparsec in size and make up nearly 10 per cent of the extragalactic population found in high-frequency radio surveys (reviewed, e.g., in O’Dea 1998; R. Fanti 2009; C. Fanti 2009; Tzioumis et al. 2003). Although their spectra are rarely well determined at frequencies below the turnover, the standard SSA again continues to be the popular explanation for the spectral turnover (e.g., O’Dea & Baum 1997; Snellen et al. 1999). Nonetheless, dominance of FFA has also been considered for almost half a century (e.g., Kellermann 1966; van Breugel 1984; Bicknell et al. 1997; Kuncic et al. 1998; Begelman 1999; Kameno et al. 2000; Marr, Taylor & Crawford 2001; Shaffer, Kellermann & Cornwell 1999; Tingay & de Kool 2003; Stawarz et al. 2008; Ostorero et al. 2010). In case FFA occurs in a uniform ambient medium, the spectrum of the synchrotron radio source at lower frequencies would exhibit an exponential cut-off, eventually becoming steeper than . But, in practice, the slope of the inverted spectrum would significantly depend on factors like at frequencies where the synchrotron source is transparent and the distribution of free-free optical depth within the (clumpy) ambient thermal plasma. Consequently, FFA interpretation cannot be excluded even if the inverted spectrum has a slope well under (e.g., Bicknell et al.1997; Kellermann 1966).
2 Search for the extreme spectral turnovers
It is clearly of interest to find out if extragalactic radio sources with do exist. As mentioned above, observations reported so far have shown that even radio spectra approaching are exceedingly rare. The present work is an attempt to explore the next steeper spectral regime, i.e., the one characterized by . We shall term the extragalactic radio sources falling within this extreme spectral domain as ‘Extremely Inverted Spectrum Extragalactic Radio Sources: EISERS’. Here we present the first results of a sensitive search for this rare population, made by comparing the 352 MHz ‘Westerbork In the Southern Hemisphere’ (WISH) survey (de Breuck et al. 2002) and the ongoing TIFR.GMRT.SKY.Survey (TGSS) at 150 MHz11 1 http://tgss.ncra.tifr.res.in/ using the Giant Metrewave Radio Telescope22 2 Operated by the National Centre for Radio Astrophysics (NCRA) of the Tata Institute of Fundamental Research (TIFR) (GMRT, Swarup et al. 1991). Both the WISH survey and the portion of TGSS reported so far are confined to negative declinations where they not only are the deepest large-area sky surveys available at metre-wavelengths, but also have a fairly high (sub-arcminute) angular resolution. Due to these key advantages, they are well suited for picking the most promising candidates for extragalactic sources having inverted radio spectra with a slope +2.5 discussed above. Such steep radio spectra may even be confirmed for some of the sources for which present estimate of (150-352 MHz) is slightly less extreme (+2.0 +2.5), when flux densities are measured with higher precision and, moreover, the effect of flux variability are minimised by making multi-frequency observations quasi-simultaneously.
The WISH survey was made with the Westerbork Synthesis Radio Telescope (WSRT) with a FWHM of 54” x 54” cosec () and a typical rms noise of 3.5 mJy/beam at 352 MHz (for details, see de Breuck et al. 2002). Likewise, the TGSS is being carried out using the Giant Metrewave Radio Telescope (GMRT) with a FWHM of approximately 20 arcsec and a typical rms noise of 6 mJy/beam at 150 MHz. The 5th data release of TGSS (DR5) covers a little more than a steradian of the sky at negative declinations down to . It consists of 558 sky frames of size 4.5∘ x 4.5∘ each. The source positions in both TGSS and WISH catalogues are tied to the NVSS coordinate frame. Near the completeness limit of the TGSS survey ( mJy at 150 MHz, for unresolved sources), the rms positional accuracy is arcsec. The flux density errors are expressed in terms of rms noise measured in the proximity of a given source (see below). Since a sky map of brightness temperature is not yet available at 150 MHz (this work is underway, using GMRT) we have re-calibrated, for the present purpose, the flux densities of individual sources given in the TGSS/DR5 catalogue. For this, we first determined spectral indices of all 52839 ’single component sources’ in the WISH catalog (designated type ‘S’) by comparing their flux densities at 352 MHz with those of their counterparts found (within 30 arcsec) in the NVSS catalogue at 1.4 GHz. This gave a value of (352-1400 MHz) = -0.748 0.001, which we then assumed to extend down to 150 MHz and thus be applicable to the sources detected in each TGSS frame of extent 4.5∘ x 4.5∘ (see below). Satisfying this requirement of median (150-1400 MHz) = -0.75 for each TGSS frame yielded a ‘flux scaling factor’ (FSF) for that frame at 150 MHz, by which the catalogued flux density of each source in that frame, as well as its quoted rms error should be multiplied. Note that the rms flux density error given for a source in the TGSS catalogue actually refers to a region within 4 arcmin of the source (but excluding the source itself), so it includes a source flux density dependent term (for details, see Sirothia et al. 2009). Thus, the rms flux density error for a source, as given in the TGSS catalogue, once multiplied with the FSF determined for the corresponding TGSS frame, amounts to the true rms error of the flux density of that source at 150 MHz (see Table 1).
Considering only the type ‘S’ (i.e. single component) WISH sources having integrated flux densities above 100 mJy at 352 MHz, their 352 MHz flux densities were combined with their TGSS/DR5 flux densities at 150 MHz (or, upper limits in case of non-detections) scaled using the above determined values of FSF for the respective TGSS frames. The resulting values of (150-352 MHz) were used to shortlist steeply inverted spectrum sources with (150-352 MHz) +1.75. The next step was to assess the reliability of these estimates, paying attention to the rather large north-south extent of the WISH survey beam (54” x 54” cosec ). To do this, we examined for each source its higher resolution images available in the TGSS and NVSS and whenever an image was found to be clearly resolved, or having neighbourhood radio emission that could have contaminated the (lower resolution) WISH measurement at 352 MHz, the source was discarded from further consideration. Further, among the retained WISH sources, if a TGSS counterpart was not detected, we have set for its 150 MHz flux density an upper limit equal to 2.5 times the rms noise for that source, as given in the TGSS/DR5 catalog and scaled using the FSF estimated for the corresponding TGSS frame, as described above.
3 Results and concluding remarks
Table 1 lists the seven sources found here to have (150-352 MHz) +2.0. Out of these, two sources are undetected at 150 MHz and therefore only lower limits to their values are provided. As mentioned above, all TGSS flux densities at 150 MHz have been rescaled here using the FSF scaling factors determined for individual TGSS frames, based on the assumption that for each frame the median value of source spectral indices, determined between 352 MHz and 1400 MHz, holds down to 150 MHz (Sect. 2). This is a conservative approach because it is known that, on average, metre/decimetre-wave spectra of extragalactic radio sources tend to flatten with increasing wavelength (e.g., Laing, Riley & Longair 1983; Mangalam & Gopal-Krishna 1995). Thus, due to our assumption of straight spectrum down to 150 MHz, the values of (150-352 MHz) of individual sources, as estimated here should in fact be slightly on the lower side (i.e., indicating less sharply inverted spectra than are actually present).
The seven sources reported here (Table 1) are the first examples of EISERS and by far the best available candidates to look for an inverted spectrum with , requiring either FFA, or a non-standard SSA. For the two best candidates, which are undetected at 150 MHz, the TGSS and NVSS images are shown in Figure 1. Optical counterparts for all seven sources were searched in the NED database and the Digital-Sky-Survey (DSS) database and they were found for two of the sources (Table 1). Deeper optical imaging is needed to identify the remaining five EISERS.
All the seven EISERS appear unresolved in their NVSS/TGSS images. For some of them, the NED database provides flux densities at gigahertz frequencies, based on high-quality measurements made with sub-arcminute beams. We have included these data in Table 1 and shown the resulting radio spectra in Figure 2. At least five of the seven spectra are found to be of GPS type (Sect. 1). However, a fully secure radio spectral characterization would need nearly simultaneous multi-frequency flux measurements. It may be noted that in the present case, the flux measurements at these low frequencies (TGSS) were made almost a decade after those made at 352 MHz (WISH) and hence some of the computed spectral indices may have been significantly affected by flux variability, although the probability of a substantial variation at these low frequencies is minute, specially for GPS sources (e.g., O’Dea 1998). For general population of extragalactic radio sources, flux variability at 150 MHz on year-like time scale has been investigated in a few programmes, as summarized by Bell et al. (2014). In a sample of 811 relatively faint sources (flux density 0.3 Jy at 151 MHz), observed by McGilchrist & Riley (1990), no significant fractional variability above was found; at higher flux levels only about of the sources are reported to vary by more than at 154 MHz (the variability could either be intrinsic, or due to propagation effects, cf. Bell et al. 2014). Nonetheless, given that sources with must be exceedingly rare, quasi-simultaneous, multi-frequency flux measurements at metre/decametre wavelengths would be particularly desirable for these seven sources and additional candidates for that our ongoing search is expected to reveal.
Acknowledgments
The Giant Metrewave Radio Telescope (GMRT) is a national facility operated by the National Centre for Radio Astrophysics (NCRA) of the Tata Institute of Fundamental Research (TIFR). We thank the staff at NCRA and GMRT for their support. We also wish to thank an anonymous referee for the constructive criticism of the original version of this paper. This research has used the TIFR. GMRT. Sky. Survey (http://tgss.ncra.tifr.res.in) data products, NASA’s Astrophysics Data System and NASA/IPAC Extragalactic Database (NED), which is operated by the Jet Propulsion Laboratory, California Institute of Technology, under contract with National Aeronautics and Space Administration.
References
- Bell et al (2014) Bell M.E. et al., 2014, MNRAS, 438, 352
- Bicknell (1997) Bicknell G. V., Dopita M. A., O’Dea C. P., 1997, ApJ, 485, 112
- Begelman (1999) Begelman M. C., 1999, The most distant radio galaxies, ed. H.J.A. Röttgering, P.N. Best & M.D. Lehnert (Amsterdam: Royal Netherlands Acad. Arts and Sciences), 173
- Bolton et al (1963) Bolton J.G., Gardner F.F., Mackey M.B., 1963, Nature, 199, 682
- Condon et al (1998) Condon J. J., Cotton, W. D., Greisen E. W., Yin Q. F., Perley R. A., Taylor G. B., Broderick J. J., 1998, AJ, 115, 1693
- Dallacasa et al (2000) Dallacasa D., Stanghellini C., Centonza M., Fanti R., 2000, A&A, 363, 887
- De Breuck et al (2002) De Breuck C., Tang Y., de Bruyn A. G., Röttgering H., van Breugel W., 2002, A&A, 394, 59
- de Kool et al (1989) de Kool M., Begelman M. C., 1989, Nature, 338, 484
- Falcke et al (1999) Falcke H. et al., 1999, ApJ, 514, L17
- Fanti et al (2009) Fanti C., 2009, AN, 330, 120
- Fanti et al (2009) Fanti R., 2009, AN, 330, 303
- (1983) Gopal-Krishna, Patnaik A.R., Steppe H., 1983, A&A, 123, 107
- (1993) Gopal-Krishna, Spoelstra T.A.T., 1993, A&A, 271, 101
- Griffith et al (1994) Griffith M. R., Wright A. E., Burke B. F., Ekers R. D., 1994, ApJS, 90, 179
- Jones et al (2001) Jones D. L., Wehrle A. E., Piner B. G., Meier D. L., 2001, ApJ, 553, 968
- Kadler et al (2004) Kadler M., Ros E., Lobanov A. P., Falcke H., Zensus J. A., 2004, A&A, 426, 481
- Kameno et al (2000) Kameno S., Horiuchi S., Shen Z.-Q., Inoue M., Kobayashi H., Hirabayashi H., Murata Y., 2000, PASJ, 52, 209
- Kellermann (1996) Kellermann K. I., 1966, Austral J Phys, 19, 195
- Kuncic et al (1998) Kuncic Z., Bicknell G. V., Dopita M. A., 1998, ApJ, 495, L35
- Laing et al (1983) Laing R.A., Riley J.M., Longair M.J.,1983, MNRAS, 204, 151
- Levinson et al (1995) Levinson A., Laor A., Vermeulen R. C., 1995, ApJ, 448, 589
- Mangalam et al (1995) Mangalam Arun V., Gopal-Krishna, 1995, MNRAS, 275, 976
- Marr et al (2001) Marr J. M., Taylor G. B., Crawford F., 2001, ApJ, 550, 160
- Matveenko et al (1990) Matveenko L. I., Pauliny-Toth I. I. K., Sherwood W., 1990, SvA Lett, 16, 247
- Mauch et al (2003) Mauch T. et al., 2003, MNRAS, 342, 1117
- McGilchrist et al (1990) McGilchrist M.M., Riley J.M., 1990, MNRAS, 246, 123
- Murphy et al (2007) Murphy T. et al., 2007, MNRAS, 362, 382
- Murphy et al (2010) Murphy T. et al., 2010, MNRAS, 402, 2403
- O’Dea (1998) O’Dea, C. P., 1998, PASP, 110, 4930
- O’Dea et al (1997) O’Dea C. P., Baum S. A., 1997, AJ, 113, 148
- Ostorero et al (2010) Ostorero L. et al., 2010, ApJ, 715, 1071
- Phillips et al (1982) Phillips R.B., Mutel R.L., 1982, BAAS, 14, 958
- Rees (1967) Rees M.J., 1967, MNRAS, 136, 279
- Rybicki et al (1997) Rybicki G.B., Lightman A.P., 1997, Radiative Processes in Astrophysics (Wiley, Newyork, 1979)
- Shaffer et al (1999) Shaffer D. B., Kellermann K. I., Cornwell T. J., 1999, ApJ, 515, 558
- Sirothia (2009) Sirothia S. K. et al., 2009, MNRAS, 395, 269
- Slish (1963) Slish V. I., 1963, Nature, 199, 682
- Snellen et al (1999) Snellen I. A. G., Schilizzi R. T., Miley, G. K., Bremer M. N., Röttgering H. J. A., van Langevelde H. J., 1999, New Astron Rev, 43, 67
- Spoelstra et al (1985) Spoelstra T.A.T., Patnaik A.R., Gopal-Krishna, 1985, A&A, 152, 38
- Stawarz et al (2008) Stawarz L., Ostorero L., Begelman M. C., Moderski R., Kataoka J., Wagner S., 2008, ApJ, 680, 911
- Swarup et al (1991) Swarup G., Ananthakrishnan S., Kapahi V. K., et al., 1991, Current Sci, 60, 95
- Tingay et al (2003) Tingay S. J., de Kool M., 2003, AJ, 126, 723
- Tzioumis et al (2003) Tzioumis T., 2003, Publications of the Astronomical Society of Australia, Volume 20, Issue 1, pp. i-iii
- Urry et al (1995) Urry C. M., Padovani P., 1995, PASP, 107, 803
- van Breugel (1984) Van Breugel, W., 1984, IAU Symposium 110, VLBI & compact radio sources, ed. R.Fanti, K. Kellerman & G. Setti (Dordrecht:Reidel), 59
- Vermeulen et al (2003) Vermeulen R. C., Ros E., Kellermann K. I., Cohen M. H., Zensus J. A., van Langevelde H. J., 2003, A&A, 401, 113
- Walker et al (2000) Walker R. C., Dhawan V., Romney J. D., Kellermann K. I., Vermeulen R. C., 2000, ApJ, 530, 233
| Source position | Optical ID | 150MHz # | 352MHz † | 1.4GHz | 4.85GHz | 8GHz | 20GHz | Spectral Index |
|---|---|---|---|---|---|---|---|---|
| NVSS⋆ | redshift (NED)⋆ | TGSS⋆ | WISH⋆ | NVSS⋆ | PMN⋆ | ATCA⋆ | ATCA⋆ | (150-352 MHz) |
| Strong Cases¶ | ||||||||
| 02 42 10.64 | 14.24 | 1064.5 | 96.72.9 | 2.35 | ||||
| 16 49 32.9 | ||||||||
| 12 09 14.65 | G | 27.69 | 2078.4 | 353.710.6 | 57332 | 117761 | 70746 | 2.36 |
| 20 32 39.9 | z=0.404 | |||||||
| Probable Cases | ||||||||
| 04 42 01.24 | 16.337.3 | 1054.4 | 50.91.6 | 8511 | 2.180.53 | |||
| 18 26 33.6 | ||||||||
| 10 03 06.11 | 17.514.1 | 1436.1 | 74.12.8 | 2.460.32 | ||||
| 25 14 04.3 | ||||||||
| 10 31 52.36 | G | 30.065.9 | 1917.9 | 371.811.2 | 32820 | 29115 | 1248 | 2.170.24 |
| 22 28 23.4 | ||||||||
| 12 07 06.05 | 67.088.2 | 38023 | 226.76.8 | 10512 | 2.030.15 | |||
| 24 46 19.6 | ||||||||
| 16 26 51.86 | 25.8411.2 | 2068.5 | 52.31.6 | 2.430.51 | ||||
| 11 27 23.9 |
⋆ References: NED – NASA Extragalactic Database; TGSS – http://tgss.ncra.tifr.res.in ; WISH – de. Breuck et al. (2002); NVSS – Condon et al. (1998); PMN – Griffith et al. (1994); ATCA – Murphy et al. (2010)
# For the detected sources the values given refer to peak flux densities, since these inverted spectrum sources are expected
to be compact, as also confirmed by their TGSS images.
For the undetected sources the quoted flux densities are 2.5 upper limits. All flux densities and errors have been recalibrated using the FSF values determined for the respective TGSS frames (Sect.2)
† In accordance with the practice followed by the authors of the WISH survey, De Breuck et al (2002), in their extensive spectral study, we have used integrated flux densities given in the WISH catalogue at 352 MHz.
¶‘Strong Cases’ refer to the two EISERS for which is more likely to exceed +2.5, since the estimated (150 - 352 MHz) is a lower limit which is close to the critical value +2.5.

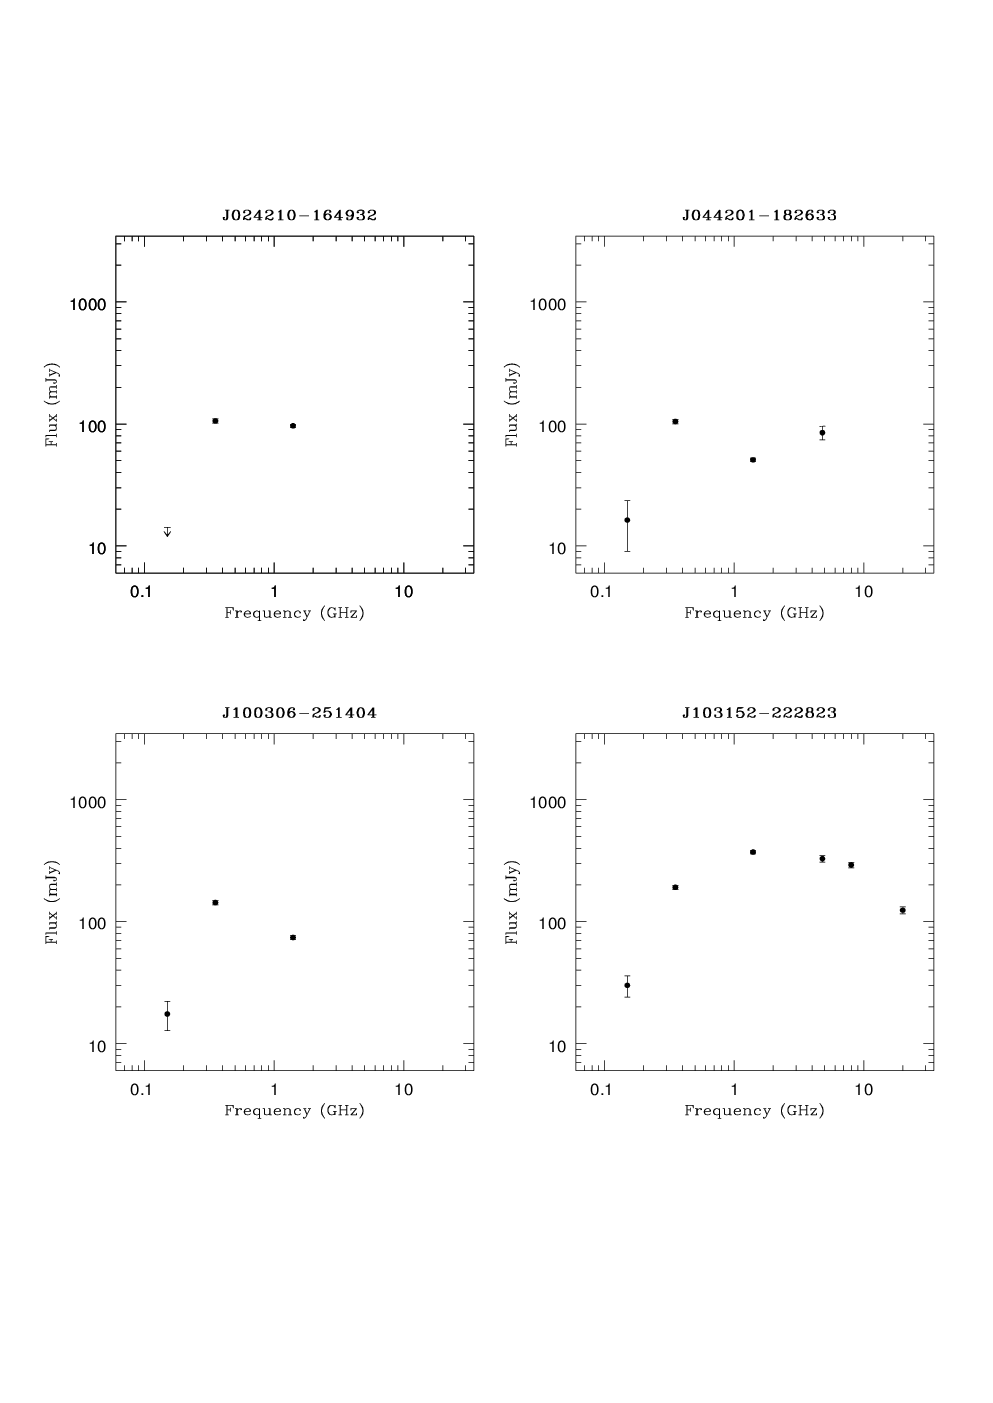
![[Uncaptioned image]](1407.4255v1/plot2.png) Figure 2. continued
Figure 2. continued