Phase diagram of the symbiotic two-species contact process
Abstract
We study the two-species symbiotic contact process (2SCP), recently proposed in [de Oliveira, Santos and Dickman, Phys. Rev. E 86, 011121 (2012)] . In this model, each site of a lattice may be vacant or host single individuals of species A and/or B. Individuals at sites with both species present interact in a symbiotic manner, having a reduced death rate, . Otherwise, the dynamics follows the rules of the basic CP, with individuals reproducing to vacant neighbor sites at rate and dying at a rate of unity. We determine the full phase diagram in the plane in one and two dimensions by means of exact numerical quasistationary distributions, cluster approximations, and Monte Carlo simulations. We also study the effects of asymmetric creation rates and diffusion of individuals. In two dimensions, for sufficiently strong symbiosis (i.e., small ), the absorbing-state phase transition becomes discontinuous for diffusion rates within a certain range. We report preliminary results on the critical surface and tricritical line in the space. Our results raise the possibility that strongly symbiotic associations of mobile species may be vulnerable to sudden extinction under increasingly adverse conditions.
pacs
05.10.Gg,87.23.Cc, 64.60.De,05.40.-aI Introduction
Originally proposed as a toy model for epidemic spreading, the contact process (CP) [1] can also be interpreted as a stochastic single species birth-and-death process with a spatial structure [2]. In the CP, each individual can reproduce assexually with rate , or die with unitary rate. When the reproduction rate is varied, the system undergoes a phase transition between extinction and survival.
Interacting, spatially extended, multi-species processes are a subject of recent interest [3, 4, 5, 8, 9, 6, 7]. In particular, multispecies (or multitype) contact processes have been used to model systems with neutral community structure, and have proven useful in understanding abundance distributions and species-area relationships [10, 11].
Symbiosis is the “living together of two phylogenetically unrelated species in close association” [12], and is thought to develop as a consequence of coevolution [13, 14]; it is a rather common phenomenon in nature. For example, lichens are symbiotic complexes of algae living inside fungi, and the roots of higher plants use symbiotic associations with fungi to receive important nutrients [15].
Macroscopic models derived from modifications of the Lotka-Volterra competition equations have been employed to model symbiotic relations for decades [16, 17]. Such model however neglect stochastic effects, relevant due to the discrete nature of the individuals and in spatially extended systems [18]. More recently, the effects of mutualistic interactions in one-dimensional stepping stone models were studied by Korolev and Nelson [19], and by Dall’Asta et.al. [20], who found that fluctuations and spatial structure favors symmetric mutualism (in which species benefit equally from the interaction). The fixation(absorbing)-coexistence(active) phase transition was found to belong to the voter model universality class if mutualism is symmetric, and to the directed percolation class if asymmetric. Lavrentovich and Nelson extended the results of [22] to asymmetric interactions in two and three dimensions, finding that the mutualist phase is more accessible in higher dimensional range expansions. Pigolotti et. al [21] studied competition and cooperation between two species when the population size is not constrained as it is in stepping-stone models.
Recently, we studied symbiotic interactions in a two-species CP [23]. This was done by allowing two CPs (species A and B), to inhabit the same lattice. The symbiotic interaction is modeled via a reduced death rate, , at sites occupied by individuals of each species. Aside from this interaction, the two populations evolve independently. We found that, as one would expect, the symbiotic interaction favors survival of a mixed population, in that the critical reproduction rate decreases as we reduce [23].
Apart from its interest as an elementary model of symbiosis, the critical behavior of the two-species symbiotic CP (2SCP) is interesting for the study of nonequilibrium universality classes. Extinction represents an absorbing state, a frozen state with no fluctuations [24, 26, 25, 27, 28]. Absorbing-state phase transitions have been a topic of much interest in recent decades. In addition to their connection with population dynamics, they appear in a wide variety of problems, such as heterogeneous catalysis [29], interface growth [30], and epidemics [31], and have been shown to underlie self-organized criticality [32, 33]. Recent experimental realizations in the context of spatio-temporal chaos in liquid crystal electroconvection [34], driven suspensions [35] and superconducting vortices [36] have heightened interest in such transitions. In this context, in [23] we employed extensive simulations and field-theoretical arguments to show that the critical scaling of the 2SCP is consistent with that of directed percolation (DP), which is known to describe the basic CP [38], and is generic for absorbing-state phase transitions [39, 40].
In this work we examine some of the issues regarding the 2SCP left open in the original study [23]: (1) Can mean-field predictions be improved on? (2) What is the phase boundary for unequal creation rates? (3) Does the model exhibit a discontinuous phase transition in two dimensions, for strong symbiosis, or in the presence of diffusion?
The mean-field theory for the 2SCP [23], at both one- and two-site levels, predicts a discontinuous phase transition for strong symbiosis in any number of dimensions. Discontinuous phase transitions to an absorbing state are not possible, however, in one-dimensional systems with short-range interactions and free of boundary fields [27]. We have indeed verified this general principle in simulations of the one-dimensional model. The simulations reported in [23] did not reveal a discontinuous transition in two dimensions () either. In the present work we aim to provide a better theoretical understanding of the phase diagram of the 2SCP, using exact quasistationary probability distributions for small systems, cluster approximations, and simulations. In two dimensions, we extend the model to include diffusion (nearest-neighbor hopping) of individuals. While we find no evidence of a discontinuous transition without diffusion, it becomes discontinuous for sufficiently small and large .
The remainder of this paper is organized as follows. In Sec. II we review the definition of the model and the mean-field analysis, and in Sec. III present results of cluster approximations and quasistationary analysis. Then, in Sec. IV we study the diffusive process. Sec. V is devoted to discussion and conclusions.
II Model
To begin we review the definition of the two-species symbiotic contact process (2SCP) [23]. We denote the variables for occupation of a site by species A and B as and , respectively. The possible states of a given site are (empty), (occupied by species A only), (species B only), and (occupied by both species). Birth of individuals, represented by the transitions and , occur at rate , with the fraction of nearest neighbor sites (NNs) bearing a particle of species A. Similarly, birth of individuals [i.e., the transitions and ], occurs at rate , with the fraction of NNs bearing a particle of species B. Death at singly occupied sites, and , occurs at a rate of unity, as in the basic CP. The transitions and , corresponding to death at a doubly occupied site, occur at rate . The set of transition rates defined above describes a pair of contact processes inhabiting the same lattice. If the two processes evolve independently, but for they interact symbiotically since the annihilation rates are reduced at sites with both species present.
The phase diagram of the 2SCP exhibits four phases: (i) the fully active phase with nonzero populations of both species; (ii) a partly active phase with only species; (iii) a partly active phase with only species; (iv) the inactive phase in which both species are extinct. The latter is absorbing while the partly active phases represent absorbing subspaces of the dynamics. Extensive simulations on rings and on the square lattice indicate that the critical behavior is compatible with the directed percolation (DP) universality class; this conclusion is also supported by field-theoretic arguments [23].
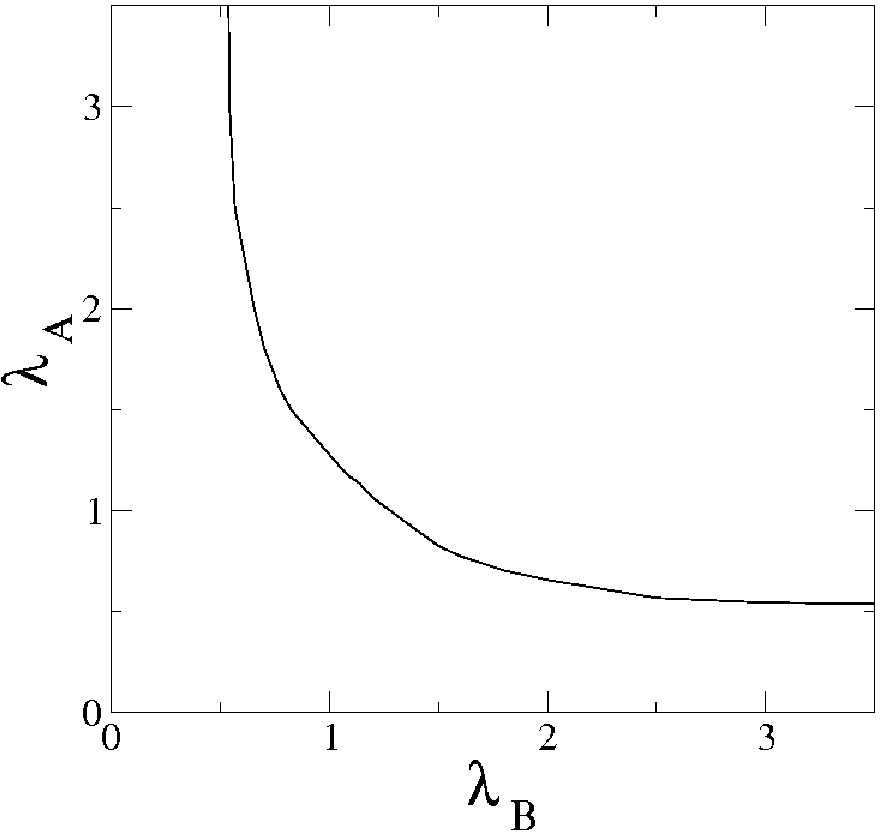
In [23], we studied the model with symmetrical rates under exchange of species labels A and B, i.e., with . We found that for the transition from the fully active to the absorbing phase occurs at some , since the annihilation rate is reduced. The effect of asymmetric creation rates is shown in Fig. 1 : if one of the species, for instance A, has its creation rate below (above) , the transition occurs for a above (below) . (The simulation algorithm is detailed in Sec. IV.) The results for are qualitatively the same, as shown in Fig. 2. Suppose we let . Then all sites will bear an A particle, so that the dynamics of species B is a contact process with death rate . It follows that the critical value of is ; this determines the asymptotic form of the phase boundaries in Figs. 1 and 2. The simulation data in Figs. 1 and 2 are obtained by extrapolating moment ratio crossings [47]. The system sizes are , 400, 800 and 1600 in one dimension, and , 80, 160 and 320 in two dimensions.

The basic mean-field theory (MFT) (i.e., the one-site approximation), for the 2SCP was derived in [23]. Generalized to include different creation rates, and , for the two species, and diffusion (nearest-neighbor hopping) of both species at rate , the MFT equations read:
| (1) | |||||
| (2) | |||||
| (3) | |||||
| (4) |
where the probabilities for a given site to be vacant, occupied by species A only, by species B only, and doubly occupied are denoted by , , , and , respectively, , and . We have further defined , and . If one species is absent (for example, if ) this system reduces to the MFT for the basic contact process, , with a critical point at . Under the effect of symbiosis we seek a symmetric stationary solution, , leading, for , to
| (5) |
and
| (6) |
For , grows continuously from zero at , marking the latter value as the critical point. The activity grows linearly, , in this regime. For , however, the expression is already positive for , and there is a discontinuous transition at this point.
In the limit , we expect , as is required by the condition that, in this limit, a time-independent solution requires that the coefficient of in Eq. 4 be zero.
III Cluster approximations and quasistationary analysis
As noted above, the discontinuous phase transition predicted by one- and two-site MFT is impossible in one dimension. Simulations in both one and two dimensions, covering a broad range of values, yield no evidence of a discontinuous transition. Here we attempt to develop more reliable theoretical descriptions, using cluster approximations and quasistationary (QS) solutions of small systems, for the symmetric case, . In the following analysis we set , i.e., the non-diffusive limit of Eqs. 1 - 4.
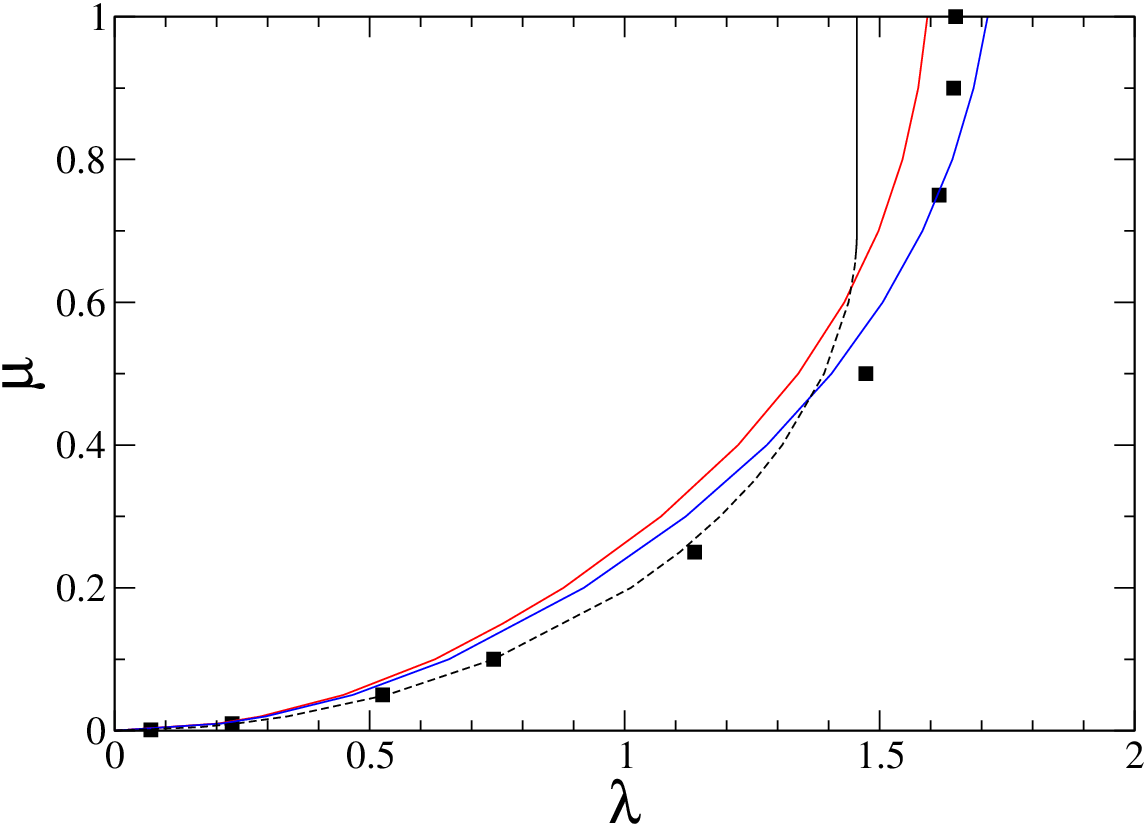
It is often the case that MFT predictions improve, both qualitatively and quantitatively, as the cluster size used in the analysis is increased. We therefore investigate MFT approximations using clusters of up to six sites in one dimension, and clusters of four sites on the square lattice. Following the usual procedure [41, 24, 42], we deduce a set of coupled, nonlinear differential equations for the cluster occupation probabilities, which are then integrated numerically to obtain the stationary solution. As shown in Fig. 3, for the one-dimensional case, the prediction for the phase boundary in the plane does improve as we increase the cluster size from to . The approximation correctly predicts a continuous phase transition for , but on this range it yields independent of , contrary to simulations, which show varying smoothly with . For the transition is predicted to be continuous for , discontinuous for , and again continuous for . (Note that on the latter interval is again independent of ). Thus the approximation exhibits the same qualitative problems as for , despite the overall improvement. The four-site approximation on the square lattice, shown in Fig. 5, furnishes a reasonable prediction for the phase boundary, but suffers from similar defects: for the transition is discontinuous, while for , is independent of .
In the context of absorbing-state phase transitions, we generally look to MFT as a guide to the overall phase diagram, expecting the critical point to have the correct order of magnitude and, perhaps more importantly, the nature (continuous or discontinuous) of the transition to be predicted correctly. The latter criterion is not always satisfied, however [43]. In light of this, and in the hope of devising a more reliable approximation method that is still relatively simple to apply, we consider analyses based on the quasistationary (QS) probability distribution of small systems. The QS distribution (or Yaglom limit, as it is known in the probability literature), is the probability distribution at long times, conditioned on survival of the process [44]. For the one-dimensional CP and allied models [45], and an activated random walker model [46], finite-size scaling analysis of numerically exact QS results on a sequence of lattice sizes yields good estimates for the critical point, exponents and moment ratios. In the present case, with four states per site, attaining the sizes required for a precise analysis appears to be very costly, computationally, and we shall merely attempt to obtain reasonable estimates for the phase boundary .
As described in detail in [45], obtaining the QS distribution numerically requires (1) enumerating all configurations on a lattice of a given size; (2) enumerating all transitions between configurations, and their associated rates; and (3) using this information in an iterative procedure to generate the QS distribution. Once the latter is known, one may calculate properties such as the order parameter or lifetime. For small systems these quantities are smooth functions of the control parameter and show no hint of the critical singularity. It is known, however, that the moment ratio exhibits crossings, analogous to those of the Binder cumulant [47]. (Here is the density of active sites.) That is, defining via the condition , the converge to as , as follows from a scaling property of the order-parameter probability distribution. Our procedure, therefore, is to calculate for a series of sizes , locate the crossings , and use them to estimate .
In one dimension we calculate for rings of size to 11. We treat configurations with only one species as absorbing, as well as, naturally, the configuration devoid of any individuals. To estimate we perform a quadratic fit to as a function of , using in the range 1-3. (The precise value of is chosen so as to render the plot of versus as close to linear as possible.) Similar estimates for are obtained using the Bulirsch-Stoer procedure [48]. As is evident in Fig. 3, the resulting phase boundary is in good accord with simulation, predicting with an accuracy of 10% or better. (The simulation data in Fig. 3 are obtained by extrapolating moment ratio crossings [47] for system sizes , 400, 800 and 1600). The extrapolated value of at the crossings is not particularly good (for we find , compared with the best estimate of 1.1736(1) [47]). Although we expect that this would improve using larger systems, our objective here is to find a relatively fast and simple method to predict the phase boundary. (The cpu time required to converge to the QS distribution is comparable to that required to integrate the equations numerically in the cluster approximation.)
To apply the QS method to the two-dimensional 2SCP, we devised an algorithm that enumerates configurations and transitions for a general graph of vertices; the graph structure is specified by the set of bonds linking pairs of vertices and . To represent a portion of the square lattice, with periodic boundaries, each vertex must be linked to four others. This can be achieved rather naturally for a square () or rectangle (); for other values of we use a cluster close to a square, and define the bonds required for periodicity by tiling the plane with this cluster, as shown in Fig. 4.
We study clusters of 8 to 12 sites on the square lattice. For , there are about 1.7 configurations and about 3.9 transitions; restrictions of computer time and storage prevent us from going beyond this size. The crossings of between successive sizes do not yield useful predictions for in this case. Evidently, the linear extent of the clusters is too small to probe the scaling regime. We instead derive estimates for the critical point by locating the maximum of , since in the infinite-size limit, this derivative (taken from the left) diverges at the critical point. The resulting predictions, for clusters of 11 and 12 sites, are compared with simulation in Fig. 5, showing that the QS analysis provides a semiquantitative prediction for , and captures the shape of the phase boundary. (The simulation data in Fig. 5 are obtained by extrapolating moment ratio crossings [47] for system with linear sizes , 80, 160 and 320). This analysis suggests that the phase transition is continuous (as found in simulation) since the QS probability distribution is unimodal in all cases.


IV The Diffusive SCP
Although the one-site MFT predicts a discontinuous phase transition in the 2SCP in any number of dimensions, such a transition is not possible in one-dimensional systems with short-range interactions and free of boundary fields [27]. In one dimension the active-absorbing transition should be continuous, as we have indeed verified in simulations. In two dimensions (), previous studies did not reveal any evidence for a discontinuous transition. These studies did not, however, include diffusion, which is expected to facilitate the appearance of discontinuous transitions. Here we study the 2SCP with diffusion on the square lattice.
We modify the process so that, in addition to creation and death, each individual can hop to one of its NN sites at rate . In the simulation algorithm for the diffusive 2SCP, we maintain two lists, one of singly and another of doubly occupied sites. Let and denote, respectively, the numbers of such sites, so that is the total number of individuals. The total rate of (attempted) transitions is , where is the time increment associated with a given step in the simulation.
At each such step, we choose among the events: (1) creation attempt by an isolated individual, with probability ; (2) creation attempt by an individual at a doubly occupied site, with probability ; (3) death of an isolated individual, with probability ; (4) death of an individual at a doubly occupied site, with probability and (5) diffusion of an individual, with probability .
Once the event type is selected a site is randomly chosen from the appropriate list. Creation occurs at a site , a randomly chosen first-neighbor of site , if is not already occupied by an individual of the species to be created. If site is doubly occupied, the species of the daughter (in a creation event) is chosen to be A or B with equal probability. Similarly, in an annihilation event at a doubly-occupied site, the species to be removed is chosen at random.
For the SCP with diffusion, we performed QS simulations [49, 50] for systems of linear sizes up to , with each run lasting time units. Averages are taken in the QS regime, after discarding an initial transient which depends on the system size and diffusion rate used.

Figure 6 shows that with increasing diffusion rate, the critical creation rate tends
to unity, the value predicted by simple mean-field theory.
(The increase in in the small- regime reflects the elimination
symbiotic A-B pairs due to diffusion.)
In Fig. 7 we plot near-critical quasistationary probability distributions of single
individuals, , and of doubly occupied sites, , for and .
The distributions are unimodal, showing that the transition is continuous.
We verify that in the absence of diffusion, the absorbing phase transition is always continuous, regardless the
value of .
For diffusion rates considerably in excess of unity, we observe a discontinuous
transition for certain values of .
An example of bimodal QS probability distributions, signaling a discontinuous transition,
is shown in Fig. 8, for .


The mechanism by which diffusion gives rise to a discontinuous transition can be understood as follows. Under strong symbiosis ( close to zero), only doubly occupied sites are observed near the critical point, in the absence of diffusion. Since the transition is continuous in this case, the overall density is very low near the critical point. In the presence of diffusion, pairs tend to be destroyed; the resulting isolated individuals then rapidly die. Thus diffusion renders low-density active states inviable. Under moderate diffusion, a finite density is required to maintain a significant concentration of doubly occupied sites, and thereby maintain activity. Hence the population density jumps from zero to a finite value at the transition. For small we observe a discontinuous phase transition even for small values of the diffusion rate, as shown in Figs. 9 and 10.

Although we have verified that the phase transition is discontinuous for small and moderate diffusion rates , increasing further, the transition becomes continuous again. In the limit , we expect mean field-like behavior, with the effects of diffusion suppressing the clustering which permits symbiosis. In this limit, the one-site MFT predicts a continuous phase transition, with , for any value of . Reversion to a continuous transition under rapid diffusion (, ) is evident in Fig. 11: the QS probability distributions are again unimodal. At criticality, fewer than of the individuals are located at doubly occupied sites for , in comparison with for .
In the three-dimensional parameter space space of , , and , there is a critical surface separating the active and absorbing phases. On this surface, a tricritical line separates regions exhibiting continuous and discontinuous phase transitions (see Fig. 12). The mean-field theory of Eqs. (1)-(4) yields a tricritical line that begins at , (for ), and then tends, for increasing , to ever smaller values of (asymptotically, , with all the while). Simulations show a somewhat different picture, with the tricritical line approaching the point , and then curving toward larger and values for small but nonzero , before doubling back towards , as shown in Fig 12. This means that for a given, nonzero value of , the transition is discontinuous (if at all), only within a restricted range of values. For example, our simulations reveal that for , the transition is discontinuous for , but becomes continuous for . We defer a full mapping of the tricritical line to future work.
V Conclusions
We present a detailed study of the phase diagram of the symbiotic contact process, using simulation, cluster approximations, and exact (numerical) quasistationary distributions of small systems. We study the effect of asymmetric creation rates and of diffusion of individuals. Exact quasistationary distributions and cluster approximations provide fair predictions for the phase boundary in the symmetric case. In simulations, the phase transition is always found to be continuous in one dimension, but in two dimensions we observe a discontinuous phase transition when symbiosis is strong (), in the presence of moderate diffusion. For the transition is again continuous.
Although the model studied here is much too simple to apply to real ecosystems, our results raise the possibility of catastrophic (discontinuous) collapse of strongly symbiotic interspecies alliances under increasingly adverse conditions, even if the change is gradual. Possible extensions of this work include precise determination of the tricritical line for the diffusive process, as well as the design of more precise theoretical approaches for two-dimensional problems. The latter task assumes even greater significance when one observes that despite the simplicity of the model, the full parameter space, including distinct reproduction, death, and diffusion rates for each species, is far too vast to be mapped out via simulation alone. Finally, the possibility of discontinuous phase transitions in more complex models of symbiosis merits investigation.
Acknowledgments
This work was supported by CNPq and FAPEMIG, Brazil.
References
- [1] T. E. Harris, Ann. Probab., 2, 969 (1974).
- [2] R. Durrett, SIAM Rev. 41, 677 (1994).
- [3] H. Janssen, J. Stat. Phys. 103, 801 (2001).
- [4] S. Iwata, K. Kobayashi, S. Higa, J. Yoshimura and K. Tainaka, Ecol. Modelling 222, 2042 (2011).
- [5] D. C. Markham, M. J. Simpson, P. K. Maini, E. A. Gaffney and R. E. Baker, Phys. Rev. E 88, 052713 (2013).
- [6] S. J. Court , R.A. Blythe and R. J. Allen, Europhys. Lett. 101, 50001 (2013).
- [7] T. B. Pedro, M. M. Szortyka and W. Figueiredo, J. Stat. Mech. 2014 P05016 (2014).
- [8] U. Dobramysl and U. C. Tauber, Phys. Rev. Lett. 110, 048105 (2013).
- [9] J. M. Tubay et.al, Sci. Reports 3, 2835 (2013).
- [10] J. S. Weitz and D. H. Rothman, J. Theor. Biol. 225, 205 (2003).
- [11] M. Cencini, S. Pigolotti, M. A. Muñoz, PloS One 7 (6), e38232 (2012).
- [12] D. Boucher, The Biology of Mutualism: Ecology and Evolution (Oxford University, New York, 1988).
- [13] A. E. Douglas, Symbiotic Interactions (Oxford University, Oxford, 1994).
- [14] J. Sapp, Evolution by Association: A History of Symbiosis (Oxford University, Oxford,1994).
- [15] S. Paracer and V. Ahmadjian, Symbiosis: An introduction to biological associations (Oxford University Press, Oxford, 2nd ed., 2000).
- [16] L. L. Rockwood, Introduction to Population Ecology (Blackwell Publishing, Malden, 2006).
- [17] V. I. Yukalov, E. P. Yukalova and D. Sornette, Physica D 241, 1270 (2012).
- [18] R. Durrett and S. Levin, Theor. Pop. Biol. 46, 363 (1994).
- [19] K. Korolev and D. R. Nelson, Phys. Rev. Lett. 107, 088103 (2011).
- [20] L. Dall’Asta, F. Caccioli, and D. Beghé, Europhys. Lett. 101, 18003 (2013).
- [21] S. Pigolotti, R. Benzi, P. Perlekar, M. H. Jensen, F. Toschi and D. R. Nelson, Theor. Pop. Biol. 84, 72 (2013).
- [22] M. O. Lavrentovich and D. R. Nelson, Phys. Rev. Lett. 112, 138102 (2014).
- [23] M. M. de Oliveira, R. V. dos Santos and R. Dickman, Phys. Rev. E 86, 011121 (2012).
- [24] J. Marro and R. Dickman, Nonequilibrium Phase Transitions in Lattice Models (Cambridge University Press, Cambridge, 1999).
- [25] G. Ódor, Universality In Nonequilibrium Lattice Systems: Theoretical Foundations (World Scientific,Singapore, 2007)
- [26] M. Henkel, H. Hinrichsen and S. Lubeck, Non-Equilibrium Phase Transitions Volume I: Absorbing Phase Transitions (Springer-Verlag, The Netherlands, 2008).
- [27] H. Hinrichsen, Adv. Phys. 49, 815 (2000).
- [28] G. Ódor, Rev. Mod. Phys 76, 663 (2004).
- [29] R. M. Ziff, E. Gulari, and Y. Barshad, Phys. Rev. Lett. 56, 2553 (1986).
- [30] L. H. Tang and H. Leschhorn, Phys. Rev. A 45, R8309(1992).
- [31] M. S. Bartlett, Stochastic Population Models in Ecology and Epidemiology (Methuen, London, 1960).
- [32] A. Vespignani, R. Dickman, M. A. Muñoz, and S. Zapperi, Phys. Rev. Lett. 81, 5676 (1998).
- [33] R. Dickman, M. A. Muñoz, A. Vespignani, and S. Zapperi, Braz. J. Phys. 30, 27 (2000).
- [34] K. A. Takeuchi, M. Kuroda, H. Chaté, and M. Sano, Phys. Rev. Lett. 99, 234503 (2007).
- [35] L. Corté, P. M. Chaikin, J. P. Gollub, and D. J. Pine, Nature Physics 4, 420 (2008).
- [36] S. Okuma, Y. Tsugawa, and A. Motohashi, Phys. Rev. B83, 012503 (2011).
- [37] M. M. de Oliveira and R. Dickman, Phys. Rev. E 84, 011125 (2011)
- [38] Similar conclusions apply to a related model, the CP with creation at second-neighbor sites, in which each species inhabits a distinct sublattice [37] with enhanced survival at first neighbors.
- [39] H. K. Janssen, Z. Phys. B 42, 151 (1981).
- [40] P. Grassberger, Z. Phys. B 47, 365 (1982).
- [41] R. Dickman, Phys. Rev. A 34, 4246 (1986).
- [42] D. ben-Avraham and J. Köhler, Phys. Rev. A 45, 8358 (1992).
- [43] A well known example is the triplet-creation model; see G. Ódor and R. Dickman, J. Stat. Mech. 2009 P08024, and references therein.
- [44] See R. Dickman and R. Vidigal, J. Phys. A 35, 1147 (2002), and references therein.
- [45] R. Dickman, Phys. Rev. E 73, 036131 (2006).
- [46] J. C. Mansur Filho and R. Dickman, J. Stat. Mech. 2011, P05029 (2011).
- [47] R. Dickman and J. Kamphorst Leal da Silva, Phys. Rev. E 58, 4266 (1998).
- [48] M. Henkel and G. Schütz, J. Phys. A 21, 2617 (1988).
- [49] M. M. de Oliveira and R. Dickman, Phys. Rev. E 71, 016129 (2005); R. Dickman and M. M. de Oliveira, Physica A 357, 134 (2005).
- [50] M. M. de Oliveira and R. Dickman, Braz. J. Phys. 36, 685 (2006).