eurm10 \checkfontmsam10 \pagerange
Separatrices: the crux of reconnection
Abstract
Reconnection is one of the key processes in astrophysical and laboratory plasmas: it is the opposite of a dynamo. Looking at energy, a dynamo transforms kinetic energy in magnetic energy while reconnection takes magnetic energy and returns is to its kinetic form. Most plasma processes at their core involve first storing magnetic energy accumulated over time and then releasing it suddenly. We focus here on this release. A key concept in analysing reconnection is that of the separatrix, a surface (line in 2D) that separates the fresh unperturbed plasma embedded in magnetic field lines not yet reconnected with the hotter exhaust embedded in reconnected field lines. In kinetic physics, the separatrices become a layer where many key processes develop. We present here new results relative to the processes at the separatrices that regulate the plasma flow, the energisation of the species, the electromagnetic fields and the instabilities developing at the separatrices.
52.35.Vd
1 Introduction
Magnetic reconnection (Biskamp, 2000; Priest & Forbes, 1999; Birn & Priest, 2007) is a process with two key ingredients. First, the magnetic field lines break their topological connection and form a new connectivity where points that were on different filed lines become connected by the same field line and viceversa. Second, energy stored in magnetic field is released and converted into particle energy, ordered kinetic energy of flows or thermal energy. Depending on the point of view more emphasis and attention goes to one or the other aspect above.
Traditionally, the topological concepts have attracted a considerable attention for their mathematical attractiveness (Lau & Finn, 1990). The focus on topology has drawn the attention to the loci of field line breakage and reconnection, the x-points in 2D and more generally the null points in 3D. When a full kinetic treatment is used (Birn et al., 2001), there loci are surrounded by regions where the electrons and ions move at speeds differing from each other and from the drift. These regions are called diffusion regions and typically represented as nested boxes, with the outer pertaining to ions decoupling and the inner to electrons decoupling (e.g. see Birn & Priest (2007)).
This overwhelming focus on the x-points and the surrounding diffusion regions has led to a vast literature and the planing and execution of the Magnetospheric Multiscale Mission (MMS) (Curtis, 1999) that will coronate the last decades of advances in understanding these regions with in situ measurements at resolutions and cadences unparalleled by previous missions.
Nevertheless, the attention is now turning to the energy aspect. From a no-nonsense engineering point of view, energy is what matters. To interpret experiments, astrophysical events and the processes involved in the Sun-Earth connection (also called space weather), energy considerations figure on top of the list of priorities.
The energy budget and the flow of energy in reconnection has also been studied based on simulation (Birn & Hesse, 2014) and observational data (Hamrin et al., 2012; Eastwood et al., 2013). The attention, however, has typically focused on the x-point and the surrounding regions of electron and ion diffusion, extended by the recent discovery of elongated electron jets emerging from the electron diffusion region (Phan et al., 2001). Here we focus specifically on the role of the separatrices in the energy transformations linked with reconnection.
In, 2D the separatrices are magnetic field lines emerging from the x-point and divide lines that have not yet reconnected form lines already reconnected. In 3D, the separatrices become surfaces that similarly divide volumes filled with different classes of lines. Separatrices and their existence are linked with the very existence of topological reconnection (Pontin, 2011). A measure of reconnection is based on defining the squashing factor to identify the quasi-separatrix layer, a topological concept extending the concept of separatrix proper (Titov et al., 2009; Restante et al., 2013).
We report here on our recent results relative to the physics developing along the separatrices.
Section 2 focuses on the flow pattern of electrons and ions. The flow is show to be quite different from the naive two nested box model that is useful in understanding many other aspects of reconnection but is of limited use in describing particle flow. A more correct cartoon focuses not he role of the separatrices where much of the flow features are concentrated. The flow is characterised by a strong parallel flow, but also the perpendicular flow plays a key role. At the separatrices, the electrons violate severely the frozen in condition in consequence of the narrow electric field features that cannot be represented by the gyrocenter approximation.
Section 3 addresses the evergreen of kinetic reconnection: the Hall physics. After summarising a possible narrative of the physics of the Hall mechanism based on the correlation between electron motion and field line bending, we review the structure of the Hall signature, observing the electrostatic nature of the Hall electric field. Two very peculiar signatures are observed: bipolar signature in the parallel electric field and string of the perpendicular electric field. These are signs of instabilities caused by the strong flows and are the subject of Sect. 4.
Section 4 analyses two types of instabilities generated by the strong flows and by the strong shears in these flows. The focus is on streaming instabilities that cause electron holes and on Kelvin-Helmholtz-type instabilities. Each has distinctly different signatures and develop in planes orthogonal to each other. A full 3D study is needed to follow the evolution of both instabilities together, the topic of the following Sect. /refsec:3dlociofinstability.
The last aspect analysed is that of the energy consequences of the physical processes described in the present paper. The focus is on both types of energisation: the increase in bulk flow energy and in thermal energy. For both the separatrices are key players. The bulk flow energisation is shown to be an integral part of the kinetic Alfven wave wing that forms at the separatrix as part of the Hall physics. The parallel thermal energy, instead, is increased at the separatrix primarily as a consequence of the electrostatic streaming instabilities described in Sect. 4. Additional mechanisms for heating are active in the exhaust via the Fermi and adiabatic mechanism.
2 Separatrices as flow gates
To understand the dynamics of kinetic reconnection, concepts typical of MHD reconnection are often used. Two schemes have received great attention.
The first is based on the Sweet-Parker (Parker, 1972; Sweet, 1958) model. When applied to kinetic reconnection, a central site of reconnection is described as being surrounded by two boxes with elongated aspect ratio.

Figure 1 represents the concept pictorially. The diagonals of the boxes are the separatrices, that divide the unreconnected from the reconnected plasma. The outer box has both species entering from the long horizontal sides and exiting from the short vertical sides. This box is identified with the ion diffusion region where the ions no longer move with the same speed as the field lines and their motion cannot be described by the drift. In this box, however, the electrons remain still tied to the magnetic field motion.
The inner box is the electron diffusion region, a region where now the electrons loose their ties with the magnetic field motion and with the drift. The electrons are visualised to enter the long horizontal side and exit the short vertical sides. An electron jet is known to form at the exit of this box (Fujimoto, 2006; Daughton et al., 2006) but the presence of guide fields can disrupt its flow (Goldman et al., 2011; Le et al., 2013). The Sweet-Parker-type visualization is useful to obtain scaling properties of the kinetic reconnection process.
The second conceptual model is that of Petschek (Petschek, 1964) where the plasma is not seen as moving in and out boxes, but rather to traverse standing shocks where energy is exchanged and the plasma species are energized. As we will see below, this description is more relevant to many features of kinetic reconnection.
In the present study, we report results from a series of simulations carried out by the authors within the scope of the preparations for the MMS mission (Sharma & Curtis, 2005; Curtis, 1999). Appendix A reports the details of some of the key simulations used in the present study and of the method of simulation based on the iPic3D code (Markidis et al., 2010). The specific simulation reported is always indicated in the figure caption.


Figures 2 and 3 show the actual motion of the plasma species. Obviously, the description of the area around a reconnection site in terms of boxes is of limited use in understanding the electron and ion motion. The Petschek visualization is closer to what is observed, with the separatrices replacing the role of the slow shocks of the Petschek scheme.
The flow lines shown in Fig. 2-3 are computed integrating the instantaneous average flow field in each cell. A Lagrangian fluid element would not necessarily follow such patterns because the flow field is subjected to fluctuations and changes. Similarly individual particles can deviate very significantly even from the Lagrangian motion of an element of plasma. Nevertheless, the instantaneous flow lines provide a picture of the flow field at a given time, being everywhere parallel to the velocity vector.
The overall evolution of the magnetic field lines is also reported in Fig. 2-3. The initially horizontal field lines bend vertically and move towards the central x-point where they are reconnected. The motion is caused by the drift due to the out-of-plane reconnection electric field . Subsequently, the newly reconnected field lines are advected downstream horizontally away form the x-point.
The electrons and ions follow a pattern far different from the idealized image of the two nested boxes in Fig. 1 representing the ion and electron diffusion regions. Both species are moved slowly, in a random-walk type of motion, towards the separatrix region where they become trapped into the faster conveyor belt of the reconnection process to be moved along the separatrix and inward across it. The electron motion is more sensitive to the parallel electric field pushing the electrons along the field lines towards the x-point. The ions, instead, are mostly moving across the separatrices. This difference is central to the physics of kinetic reconnection and will be addressed in the next section.
The flow at the separatrices acquires a distinct non-frozen in component. The local magnetic field at the separatrices is significant, but the presence of strong gradients allow the electrons to violate the drift approximation, leading to a strong deviation from the local frozen-in condition. Figure 4 shows the relative drift between electrons and magneitc field lines, assuming the latter move at the drift speed. The figure reports specifically the perpendicular component of the relative drift, because we have already observbed the parallel flow to be very strong there, but parallel flows do not consititute proper violation of the frozen in condition. Perpendicular drift do and the relative perpendicular drift at the seapratrices, even tens of away from teh x-point are still as strong as in the electron diffision region proper (the inner box in the nested boxes idealization of kinetic reconnection, see Fig. 1).
The violation of the frozen in condition extends downstream of the central electron diffusion region, forming a turbulent outflow that is subject to deflection (Goldman et al., 2011) caused by the guide field (, in the case reported) and by secondary tearing that forms secondary islands in the extended outflow from teh reconnection region (Daughton et al., 2006).

Both species pass from the unreconnected region to the reconnected region mostly without even coming close to the central x-point. Whatever happens to them to make them change their distribution (see Sect. 6) happens at the separatrices. The separatrices are in fact also the region where the electrons and ions acquire their energization.
The eventual outcome of reconnection is a front of plasma and piled up magnetic field exhaust from the reconnection region. This outflow motion is observed often in satellite data and is referred to in that context as bursty bulk flow when reconnection events are transient or unsteady (Angelopoulos et al., 1994). These flows inevitably meet the unperturbed plasma previously present and form a front downstream. These fronts also are often observed in satellite data and in the case of Earthward propagation contribute to restore the Earth field to a more dipolar configuration and for this reason are called dipolarization fronts (Sitnov et al., 2009).
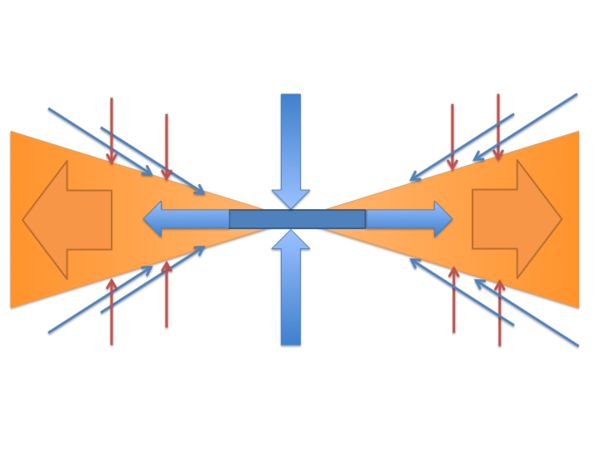
Figure 5 shows a cartoon of the actual flow pattern for the reconnection process and can replace the more idealised cartoon of Fig 1. The difference from the two-boxes cartoon is profound, both electrons and ions primarily pass via the separatrix layer rather than the central electron diffusion region.
The four separatrices have the same flow only in absence of guide field. The presence of guide field alters the flow pattern, but still in all cases the separatrices remain the gatekeepers. Already at the relatively modest 10% level of Fig. 2-3, the effect is quite visible on the electrons where a much stronger parallel flow is present on the upper left (and lower right, not shown) separatrix. The difference becomes stronger as the guide field is increased.
Figure 6-7 show, for , the flow lines again superimposed to the magnetic field lines. The flow is now of alternating sign. On two separatrices the parallel flow is still towards the x-point, but on the other two the flow becomes away from the x-point and strongly sheared with two oppositely directed flow channels. As shown in Sect. 4, these flow patterns are very susceptible to streaming and shear instabilities.
The presence of a guide field also tends to give a more vortical motion to both plasma species, capturing them in self-feeding reconnection conveyor belt loops (Lapenta, 2008; Lapenta & Lazarian, 2012).


3 Separatrices and signatures of the Hall physics
The separatrices are strictly speaking lines in 2D and surfaces in 3D. However, within kinetic models, the separatrix proper become surrounded by a layer of repentine changes in a number of quantities, most prominent among them the electric and magnetic fields. The separatrices are highlighted by the in-plane perpendicular electric field and by the out-of-plane magnetic field. These two fields together are part of the characteristic signature of kinetic reconnection caused by the separation of scales between electrons and ions, represented mathematically by the Hall term in the generalized Ohm’s law, and for this reason referred to as Hall fields.
a)

b)

The concept of the Hall physics has been reviewed in previous studies (e.g. see the section by Shay and Drake in Birn & Priest (2007)). A useful way of interpreting the dynamics is visualized in Fig. 8.
The reconnection process is associated with an out-of plane reconnection electric field . The reconnection electric field, via the drift, moves the magnetic field lines first towards the x-point and after reconnection, downstream away from it. Near the reconnection x-point, the electron beta becomes high and the electrons become capable of affecting the field line direction. This generates a mechanism where the electrons and the magnetic field attached to them acquire a strong out of plane velocity. The reconnection electric field tends to accelerate the electrons near the x-point (Moses et al., 1993; Divin et al., 2010), along the -direction, opposite to that of the reconnection electric field (Huba & Rudakov, 2002).
The field line bending is linked with a in-plane perpendicular electric field, the Hall electric field, that in proximity of the separatrices bends the field lines out of the page. The combined presence of a out-of-plane Hall magnetic field and in-plane Hall electric field is the main peculiarity of fast kinetic reconnection. Field line bending and its associated electric and magnetic Hall fields propagates from the x-point along the magnetic field lines at superalfvenic speed (Shay et al., 2011; Lapenta et al., 2013a). The process has been interpreted as a kinetic Alfvén wave (KAW) wing encompassing the seapratrices along all field lines affected by the electron acceleration along (Shay et al., 2011; Lapenta et al., 2013a).
This signature, in absence of an initial guide field assumes the peculiar and much publicised quadrupolar Hall magnetic field structure due to the bending indicated in Fig. 8. However, when a initial guide field is added, the electrons do not need to bend the field lines in the same way as their z-directed motion becomes parallel, the more parallel the larger the guide field is. When the guide field is increased, the quadrupolar anti-symmetric signature is progressively replaced by a up-down symmetric signature (but still left-right antisymmetric) (Rogers et al., 2003; Ricci et al., 2004).
Fig. 8 illustrates how the bending explains the symmetry of the out of plane magnetic field. With weak or no guide field, the left side acquires a out of plane field opposite to the right side and the upper side, opposite to the lower side, resulting in a quadrupolar field.
The bending of the field lines explains also the parallel electron flow along the separatrices observed in the previous section. In absence of guide field the electron motion along , normal to the initial field, acquires a parallel component once the field lines are bent out-of-plane. This allows a preferential route for the electrons along the bent lines, where they can travel at fast parallel speeds instead of the much slower drift across field lines. The orientation of the electron flow and of the field lines results, as shown in Fig. 8, in a flow always pointing towards the x-point.
The situation changes radically in presence of guide fields (Kleva et al., 1995; Ricci et al., 2004; Lapenta et al., 2011). When the guide field is present, the electron flow is always directed in the same orientation with respect to the field lines on both left-right sides of the x-point. However, it is opposite on the upper side when compared with the lower side. This results in the flow being directed towards the x-point on two separatrices and away from it on the other two.
The fast parallel electron motion results also in a tendency to create a charge imbalance that produces a density perturbation on the separatrices, and being the electrons the main current carriers, a violation of neutrality results in a narrow band of net charge and strong electric fields at the separatrices, constituting the source of the Hall electric field, primarily electrostatic in nature, that is needed as part of the kinetic alfven wave wing forming the Hall signature along the separatrices (Wygant et al., 2005; Zhi-Wei & Shu-Ling, 2008).
a)

b)

Figure 9 shows the Hall signatures for the electric and magnetic fields for low guide fields (). The in-plane perpendicular electric field is caused by a charge imbalance across the separatrix and is electrostatic in nature (Wygant et al., 2005; Zhi-Wei & Shu-Ling, 2008; Huang et al., 2006). The out of plane magnetic field is caused by an electron current system flowing along the separatrix (Uzdensky & Kulsrud, 2006). Figure 10 reports the electrostatic and electromagnetic contributions to the vertical in-plane component of the electric field. The electrostatic contribution is obtained from the scalar potential defined by the Poisson’s equation, the electromagnetic component can be obtained from the vector potential and is simply the reminder of the total electric field minus the electrostatic component. As can be observed the electromagnetic component is an order of magnitude smaller and does not show any specific feature at the separatrix, confirming the electrostatic nature of the Hall electric field.
a)

b)

Figure 11 shows the parallel electric field characteristic of the separatrix and the reconnection electric field, controlling the rate of reconnection. At this late time, the reconnection electric field is dominant in the so-called dipolarization fronts forming a flux pileup region downstream of reconnection, where the plasma outflowing from reconnection encounters the fresh original still unperturbed plasma (Sitnov et al., 2009). The parallel electric field shows clearly the presence of bipolar structures associated with electron holes caused by streaming instabilities, the topic of the next Section.
a)

b)

4 Instabilities of reconnection separatrix layers
Fast bulk flows and localized electron beams, formed by reconnection, are inherently unstable to current-driven and beam-driven modes. Electron holes (EH), whistler waves, lower-hybrid oscillations, double layers, small-scale plasma vortices, and other dynamic phenomena are observed reconnection events in satellite data and simulations (see review by (Fujimoto et al., 2011), also references therein). Magnetic reconnection in space plasma easily generates a variety of multiscale non-stationary features, even if the process retains the common global X-line, separatrices, inflow and outflow regions.
In the past decades, significant efforts were put into revealing the nature of the collisionless plasma dissipation, which is required for violation of frozen-in constraint near the X-line. Kinetic theory of microinstabilities suggests that wave-particle interactions produce turbulent drag, creating ‘anomalous’ resistivity ((Galeev & Sagdeev, 1984; Biskamp, 2000)) is orders of magnitude larger than Spitzer resistivity due to binary collisions (Spitzer, 1962).
Three-dimensional PIC simulations are essential for understanding the collisionless dissipation. A number of studies suggest that various microinstabilities are excited inside diffusion regions, among them: (e-e) streaming instability (Goldman et al., 2008), (e-i) Buneman instability (Drake et al., 2003), (e-e-i) Lower-Hybrid instability, excited by a propagation of a suprathermal electron beam (Che et al., 2009; Che et al., 2010), unstable electron cyclotron mode (Che et al., 2011), excited by strong current density gradient (Drake et al., 1994) inside diffusion region. The anomalous drag is found by averaging the electron motion equation over the current direction and estimating the correlations between fluctuations in the density, electric and magnetic fields and the velocity.
The problem of collisionless dissipation and anomalous resistivity remains one of the unsolved mysteries of magnetic reconnection. However, as has been shown in previous Sections, fast flows and beams are not confined to the X-line vicinity, and exist many ’s away as e.g. a part of large-scale Hall region current system, or as travelling reconnection jet fronts. Therefore, it is important to understand the wave-particle interactions, which appear at large distances from the X-line.
Early 2D PIC simulations of antiparallel reconnection (Hoshino et al., 2001) reported bi-Maxwellian distributions at reconnection separatrices (a weak electron jet superimposed on thermal electron population). It was found that the wave activity at the separatrices is enhanced in a broad range of frequencies between the lower hybrid frequency and electron plasma frequency. Similar electron distribution functions at separatrices were reported in Ref. (Pritchett & Coroniti, 2004). The study found waves with the frequency close to the local ion plasma frequency, interpreted as evidence of either Buneman, or electron streaming modes.
Traditionally, Hall physics is considered to be important in the vicinity of the ion diffusion region, where ion and electron motion decouples (Birn et al., 2001). However, as shown in the previous sections, Hall signatures at separatrices spread out up to ’s. away from neutral line. 2D PIC simulations performed in larger boxes (Pritchett, 2005; Cattell et al., 2005; Drake et al., 2005) allowed to simulate remote separatrices. The parallel electric field creates a beam of electrons susceptible to the Buneman instability. With the typical mass ratio of 64 or 100 used in many PIC simulations, the disparity of ion and electron scales is not resolved well, hence the properties of sub-ion instabilities and structures are not modeled well. Numerical simulations with the realistic mass ratios (Lapenta et al., 2010; Lapenta et al., 2011; Divin et al., 2012) allowed to establish the inner layered structure of the separatrices and identify the Buneman instability and electron Kelvin-Helmholtz mode as the basic drivers of separatrix wave activity.


The main goal of this section is the investigation of the instabilities developing at the separatrices of collisionless guide-field magnetic reconnection with realistic mass ratio simulations. In addition to conventional 2D runs (Lapenta et al., 2010; Lapenta et al., 2011), we performed a set of small-scale high-resolution runs, in which the separatrix is approximated by a thin electron-scale current layer superimposed with a fast electron beam. This approach was used previously in Ref. (Divin et al., 2012) to investigate separatrices of guide field case. These simulations found the Buneman instability developing parallel to the magnetic field, and electron Kelvin-Helmholtz (EKH) mode, which is excited by a weak shear of the electron velocity inside the separatrix density cavity. To complement the study, we performed a set of simulations with the guide fields , , , including small-scale high-resolution runs of the dynamics of the separatrices. The rest of the section is organized as follows. Next we discuss the guide-field simulations of magnetic reconnection and the properties of plasma at separatrices. After that we present the results of the small-scale high-resolution 2D runs. After that we provide discussion and summary of our simulations.
The simulations are initialized with the Harris current sheet (Harris, 1962), which have the temperature of ions to electrons ratio of , which is typical for magnetotail studies (Lapenta et al., 2010). The computational box is grid point. The physical size of the computational domain . Periodic boundary conditions are set in the x direction. PEC (Perfect Electric Conductor) boundaries are used at and . Alfvén dimensionless units are used in this section to visualize the results.
The initial configuration (Harris equilibrium) evolves into an asymmetric reconnection configuration in the presence of guide field. The vicinity of the reconnection region is antisymmetric, that is two separatrices (out of 4) are characterized by increased plasma density (denoted as “quiet”), and the other two separatrices (denoted as “active” (Divin et al., 2012)) host thin density cavities, which contain intense electron jet.
Results of all the four simulation runs are presented in Fig. 12. We show only one quadrant of each simulation in order to have a compact comparative picture. No guide-field run (, panels 12a, 12c, 12e) has symmetric reconnection pattern, therefore we can choose any separatrix for the detailed study. Guide-field runs have sharply different active and quiet separatrices, therefore we have chosen right lower quadrant, which contains the active one.
Fig. 12 shows the parallel electron velocity (Fig. 12a, 12b, 12g, 12h), the parallel electric field (Fig. 12c, 12d, 12i, 12j), and the parallel electron velocity phase space plot along the field line passing through the X-line, which is located at , . A curve on each 2D plot shows a portion of the computational domain, from where the electron distribution functions for the phase space plots (Fig. 12e, 12f, 12k, 12l) were sampled. Thin lines at mark the profiles used in small-scale simulations later. Black curves are lines of the in-plane magnetic field.
Reconnection separatrices host electron flow layer, which spans many ion inertial lengths and has a large parallel velocity . Peak parallel electron velocity is in the case and increases with , reaching , which is comparable to the electron Alfvén velocity . Electrons are magnetized at separatrices, because the magnetic field is almost equal to the ambient value far from the reconnection region.
The thin electron flow layer creates a large shear in the parallel electron velocity across the separatrix. As discussed previously in Ref. (Divin et al., 2012), electron flow layer is unstable to the EKH mode for the case. Later in this section we show that the simulations with , , also create unstable electron flows at the separatrices.
The plots of the parallel E field show the presence of the strong electrostatic fluctuations reaching , which are commonly interpreted as electron holes (Pritchett, 2005; Cattell et al., 2005; Drake et al., 2005). The amplitude of the fluctuations are similar among all 4 runs, unlike the electron beam velocities. Notably, the EH size is slightly larger than the electron flow layer thickness, meaning that the EH electric field leaks into the surrounding plasma. This is seen in Fig. 12h, 12j ( run), where the flow layer is particularly thin. In order to clarify further the separatrix layer properties and stability, we investigate the phase space densities (PSD).
Sampling boxes used for the PSD plots (Fig. 12e, 12f, 12k, 12l) are small ( ) in order to avoid the overlapping with the bulk slow plasma outside the electron flow layer. The PSD plots show the presence of the two rather different electron populations. Hot population exists in the area , where the X-line acceleration is important. At , a strong electron jet is visible in all four cases, with the velocity peaking at . Fluctuations of the coincide with PSD perturbations typical for the electron holes. The jet contains a small thermal electron population (, runs), but nearly all background plasma is evacuated from the flow channel in the other runs (, ). Electron holes are most prominent in the jet area , and much fainter close to the X-line ()
Next we investigate the electron flow layer stability using reduced size simulations (Goldman et al., 2008; Divin et al., 2012). We are interested in the dynamics of quasi-1D separatrix layer only, and we sample distribution functions and plasma parameters from that region only and initialize small-scale high-resolution simulations of the size . This approach allows to use rotated coordinate system, therefore it is also possible to study instabilities with a wavevector in the z direction. The profile is shown in Fig. 12 by a thin black line.
The following new field-aligned frame of reference is introduced: the unit vector parallel to the field is , the perpendicular vectors are , . The vector is parallel to the profile line showin in Fig. 12 and points across the separatrix.
Plasma parameters in the field-aligned frame of reference are shown in Fig. 13 for run with respect to x axis. The actual profile length is , and it is centered at the density cavity. Unlike case (see Ref. (Divin et al., 2012)), the density drop is not deep (the lowest density is . Visible difference of , corresponds to a strong perpendicular electric field, which represents the standing whistler wave during fast collisionless reconnection. A small is present inside the cavity and accelerates the beam electrons along the separatrix up to . Notably, a strong electron flow reversal of is responsible for the EKH mode excitation (see below).
The profile parameters presented in Fig. 13 are used to initialize the 2D PIC simulations in the domain . The areas and contain the uniform plasma which corresponds to the left and right sides of the profile in order to allow for a buffer layer between the electron flow jet and the boundary. The computational domain has Perfect Electric Conductor (PEC) boundaries at the , , whereas the other direction is periodic. The simulations are performed in the plane , which resolve the Buneman instability, and in the plane , which sees the development of EKH instability, in agreement with the simulations performed in Ref. (Divin et al., 2012).


The electron holes found in magnetic reconnection simulations in Fig. 12 are readily observed in small-scale runs. Fig. 14 displays component taken from the 2D small-scale simulations performed within the plane () for the four guide field cases. A specific time corresponds to a peak of the norm , where denotes averaging along direction, computed along the middle of the jet. As discussed previously in Ref. (Divin et al., 2012), multiple electron jets can be found near the separatrices (as seen in Fig. 14, , ), where a secondary jet is well visible. The larger the guide field, the faster is the electron flow jet (see plots in Fig. 12). Respectively, stronger electrostatic waves are expected for . Fig. 14 indicates that the peak indeed grows with the guide field.
Time evolution of the wave intensity is displayed next in Fig. 15. Instability growth, saturation and nonlinear evolution can be best visualized by plotting the norm evolution with time. Notably, run (Fig. 15, red line) has significantly weaker wave amplitude and growth rate () compared to runs (). This may indicate that even a small guide field is sufficient to noticeably enhance the separatrix electrostatic wave activity. However, in actual large-scale reconnection a dynamical equilibrium exists between the EH generation, saturation and dissipation (Goldman et al., 2014). Therefore, it is uneasy to find a “growing” EH in the large-scale simulations, and linear dispersion relations can only provide very rough estimate of the actual wave properties.
Next we discuss the results of 2D PIC simulations performed in the plane . As we discovered in our previous study (Divin et al., 2012), the electron Kelvin-Helmholtz mode is excited for the case . A weak unstable shear flow exists in the direction, leading to electron vortices in the plane , which fill the density cavity with inflow and outflow plasma. Fig. 16 displays electron density from all four small-scale runs. Specific times correspond to a stage, in which the value of the norm is in all four runs (see Fig. Fig. 17), indicating a comparable level of fluctuations. Notably, the density cavity is nearly absent in the case , hence EKH mixes plasma from inflow and outflow sides. The same applies to the case of . However, for and the density inside the cavity is , and the EKH produces significant mixing of the cavity electron population, and inflow/outflow populations. It indicates that the EKH instability is especially important in the large guide field case and can divide the separatrix surface into a chain of isolated beams.
5 3D study of separatrix instabilities
One of the distinctive characteristics of separatrices in collisionless magnetic reconnection is the development of localized low density regions along them Lu et al. (2010); Zhou et al. (2011). These depletion areas are called cavities. The cavities appear as thin electron current layers in two dimensional Particle-in-Cell simulations and as thin surfaces in three-dimensional simulation Markidis et al. (2012). Figure 18 shows the contour plot of electron (panel a) and ion (panel b) on two different planes. The top panels shows the contour plot on the reconnection plane while the bottom panels show a contour plot on a plane along the separatrices (dashed line in panel a). The density cavities appear in blue as depleted areas along the separatrices.

One of the findings of studies about cavities in three-dimensions is that regions with further lower density are embedded in the cavities Markidis et al. (2012); Wang et al. (2013). As clear in the bottom panels of Figure 18, these structures are similar in shape to ribs, and for this reason these regions are called low density ribs. Separate low density ribs show similar features. They have equal size, they form along the magnetic field lines and are supported by intense perpendicular electric fields. A parallel electron current moves along the cavities and contributes to the creation of the low density ribs by decreasing the density in small channels. The cause of the three-dimensional low density ribs is not clear. It has been proposed that lower-hybrid waves can be caused by electron beams drakescience; McMillan & Cairns (2007); Che et al. (2009); Che et al. (2010), or by density gradients, as in the lower-hybrid drift instability Scholer et al. (2003). The density ripples in the cavities have been previously detected in two dimensional Particle-in-Cell simulations, and spectral analysis suggests that the instability is related to the electron MHD Kelvin-Helmholtz mode Divin et al. (2012). An additional possibility is that observed three-dimensional structures of higher density regions in proximity of the low density ribs are Alfvén vortex filaments Alexandrova et al. (2006); Xu et al. (2010), caused by drift kinetic Alfvén waves. The presence of Alfvén vortices have been detected in cusp region Sundkvist et al. (2005) and close to magnetic reconnection X lines Chaston et al. (2005); Chaston et al. (2009).
It is clear from the top panels of Figure 18 that cavities are perturbed by a wave structure Divin et al. (2012). Small spatial scale low density ripples develop along the cavities. These structures are similar in shape to the Kelvin-Helmholtz vortices Divin et al. (2012).
Bipolar parallel electric field () signatures are present along the cavities. Figure19 shows an isosurface plot of with density isosurfaces that represent to outflow jets (panel a) and a contourplot of the total density along a separatrix. There is correspondence between the electric field bipolar structures and the low density ribs. The existence of the low density ribs within the cavities and of bipolar electric field structures can possibly used as flag to detect the reconnection sites.

The instabilities observed in 3D simulations are sensitive to the ambient guide field. As the guide field is increased, the flow pattern around the separatrices changes, as observed in Sect. 2. These flows are also a main driver for the instabiltiies at the separatrices, creating a direct link between the ambient guide field and the presence of different types of instabilities.
As the guide field is increased the paralell flow at the separatrices becomes more intesnse and more susceptible to streaming instabilities (Lapenta et al., 2010). However, guide fields tend to provide a path of communication along the out of plane direction , suppresing some of the instabilities that develop in htat direction. A transitionis then observed as a function of the guide field. At low guide fields, the dominant presence is that of instabilties in the lower hybrid range at density gradients, observed in the flanks of the current sheet (Lapenta & Brackbill, 2002) and at the dipolarization front (Vapirev et al., 2013). At higher guide fields, the separatrix instabilities become more dominant, as shown in Fig. 20.
Figure 20 provides a comparison of the perturbations in of for three different values of the guide field 0.1, 0.5, and 1.0. Here, the direction is parallel to , and is therefore the direction clockwise from projected into the – plane. The electrostatic part of is defined as .

The simulation data is taken from a series of runs over a range of guide-field strengths in a box of dimension , all at time . The 3D array is Fourier transformed along the direction only, to generate , where for mode number , , , . The top row (a)–(c) of Fig. 20 contains plots of , which is equivalent to the spatial average . The green arrows indicate the local direction (but not the magnitude) of the -averaged projection of in the – plane. Panels (a)–(c) can be interpreted as the Hall electric field, with the red regions near the separatrix branches corresponding to regions where points inward (i.e., toward the exhaust). The -averaged behavior corresponds closely with what is observed in 2D simulations. In particular, there is a transition from a predominantly inward on all four separatrix branches at low to a bipolar , especially on the upper-left and lower-right branches, for larger values of .
The second row (a’)–(c’) and third row (a”)–(c”) contain the magnitude and complex phase of the dominant Fourier component with . We identify the dominant component as the one for which has the larges global maximum. (Because , we only have to consider positive values of .) As increase, the dominant value of decreases from to , corresponding to an increase in the wavelength of the perturbation from to . More significant is the transition from the perturbations being localized to the DF at (a’) to being localized almost exclusively to the two separatrix branches with the strongly bipolar Hall signature at (c’). The intermediate case with (b’) shows strong perturbations in both regions.
The complex phase (a”)–(c”) is represented by the HSV (hue, saturation, value) color as depicted in the upper-right inset in panel (c”). Here, H is determined by the complex phase () and S is determined by the magnitude of , with V. In the inset, S decrease logarithmically by one order of magnitude from center to edge. While the absolute phase has no significance, the phase gradient is an indicator of the local effective projected into the – plane. Specifically, the normal to the bands of constant H indicate the direction of and the spacing between bands of equal H indicate the effective wavelength. The phase-fronts associated with the separatrix instability show a tighter spacing in panel (c”) than in (b”), suggesting that the – projection of the wavevector increases for larger values of as the dominant decreases.
6 Separatrices as energizers

Electrons and ions are energized by a variety of processes. A vast literature exists on the topic, with excellent recent reviews (see e.g. the section by Hoshino in Priest & Forbes (1999) and in Birn et al. (2012)). Here we focus on the role of the separatrix only. Two types of energization need to be distinguished at the separatrices even more so than in general: bulk acceleration and heating.
Bulk acceleration refers to a fluid moment point of view, where the local average speed is increased. At the separatrices, the local intense electric fields lead to bulk acceleration. Figure 21 reports some key fields to provide a view of the bulk flow energization. The signature of the Hall fields is associated with a parallel electric field, in tho case electromagnetic in nature. To obtain this signature, the electrostatic component is subtracted from the total parallel electric field and the resulting electromagnetic component is reported in panel b. The electrostatic component is obtained from the Gauss theorem and the electromagnetic part is obtained simply as a difference between the total field computed from Maxwell’s equations and the electrostatic part.
As can be seen, the parallel electric field has the same shape as the Hall magnetic field. As noted above, both can be considered part of a KAW wing that forms from the flow across the separatrices and the x-point. The KAW wing, then incorporates a self consistent parallel electric field capable of generating an electron flow that also presents the same footprint of the Hall magnetic field and of the parallel electric field.
However, there is a second component to the electron velocity that is concentrated on a much narrower layer across the separatices propers and closer to the x-point. These narrow bands of velocity are visible in the component and are predominant in the parallel direction. As noted in Fig. 4 and the discussion connected with it, these intense and narrow speed channels are associated also with a violation of the frozen in condition along the separatrices.
Heating is the second type of species energization and is due to the increase of the thermal motion of the particles around their thermal speed.


Figures 22-23 report the particle temperature in the parallel and in the two perpendicular directions, respectively for electrons and ions. The electron heating at the separatrices is primarily in the parallel direction. The perpendicular heating and the ion heating is instead more pronounced in the reconnection exhaust (Ashour-Abdalla et al., 2011; Birn et al., 2012). The separatrix is the location of the interface between a region still populated by unperturbed cold particles tied to unreconnected field lines and the reconnection exhaust populated by heated particles. What happens at the separatrix to cause this transition?
A obvious consideration is that electric fields do not heat directly: their effect is to accelerate the plasma species macroscopically, leading to increased species flow speed, not directly to their thermal energy. It is useful to recall the energy balance equations.
The source of thermal energy is not, as can be seen, the electric field that directly affects only the bulk energy. The source of thermal energy is the work done by the pressure tensor via the term , a generalisation of the famous PdV work that propelled the industrial revolution.
To find the cause of electron and ion heating at the separatrices, we then need to turn our attention to the physics behind the structure of the pressure tensor and not to the electric field. As noted above, the separatrices are regions of intense flows, shears and phase space instabilities. Figure 24 reports the parallel thermal speed and the directed horizontal speed at time in the reference run used so far. The separatrix divides the outer flow, directed towards the center, from the inner exhaust flow, directed away. At the separatrices themselves, the flow is sheared and stripes forms, related to the instabilities discussed in Sect. 4.
Figure 24 shows the local thermal and directed speeds along two lines indicated in panel a and positioned horizontally at different distances from the neutral line. This diagnostics is conducted in an analogy with probe crossings from spacecrafts. Of course, here the data is all from the same time, at different locations, when, instead, spacecraft data records the passage of time and measures the different conditions as the plasma passes by the spacecraft (whose speed is negligible compared to that of the plasma it is immersed in).
At all locations, the thermal speed dominates, but significant bulk flows are present, with strong local gradients. These conditions are conductive to the instabilities described above in Sect. 4 with important consequences to particle heating.

a)

b)

Figure 25 illustrates the mechanism of particle heating at the separatrices (Divin et al., 2012). The electron thermal speed is measured as the second order moment in v, around the average speed. It is often non-trivial to ”measure” the thermal spread by eye, especially because the bulk with the darker red weights much more. For this reason, Fig. 24 reports the actual value corresponding to the phase spaces in Fig. 25.
Three regions are evident in both crossings. The central region (from 90 to 110 on the lower crossing and from 80 to 120 in the upper crossing) is still that of the initial unperturbed plasma loaded initially in the simulation. Corresponding the same range in phase space is still made of thermal maxwellian plasma. At the other ends, leftward of the left DF (located at about ) and rightward of the right DF (located at about ), the plasma electrons are heated to about twice the initial unperturbed temperature. This is the outcome of Fermi and betatron heating associated with the DF. Several studies, experimental and theoretical, have concentrated on the study of the electron heating at the DF (Ashour-Abdalla et al., 2011; Pan et al., 2012; Birn et al., 2013; Runov et al., 2013). Two acceleration mechanisms are activated by the DF: adiabatic heating (betatron) induced by the increase in the vertical magnetic field of the DF and mirroring (Fermi). The adiabatic heating operates on the magnetised electrons. Moving from the x-point to the DF, the conservation of the first adiabatic moment, suggests that is constant and the increase in from the x-point to the DF accounts for perpendicular heating. However, electrons heated in the perpendicular direction, transform their thermal speed between parallel and perpendicular direction as they mirror along the curved more-dipolar lines. The DF forms a sort of radiation belt of heated particles that mirror between the northern and southern lobes. This process requires including the Earth magnetic field to be described properly, a feature absent form the preset simulation. Nevertheless, the process of reconnection has created curved magnetic field lines that increase their density at the two horizontal ends of the box, left and right above and below the central sheet. Additionally, the mirror motion also causes heating directly as the field lines are adveced in the exhaust and the mirroring points become closer, leading to Fermi acceleration. These two processes, adiabatic heating and Fermi acceleration (Lichtenberg et al., 1980), combine to give the particle heating observed from the DF outward.
A third region is evident in between the central unperturbed plasma and the external plasma heated by the DF. These two intermediate regions are where the separatrices passes. These two regions are between on the lower crossing (and symmetrically on the other side, not shown) and on the upper crossing in Fig. 25. Here the exhaust plasma and the fresh inflow plasma come together at the separatrices, forming a layer of high shears where the streaming instabilities described in Sect. 4 cause a intense phase-space mixing. This leads to intense heating and the largest parallel temperatures observed. The separatrices instabilities are then not just an indicator of the separatrix region, but act to change profoundly the properties the electrons passing through.
The phase space plots in Fig. 25 show clearly the presence of a chain of electron holes in phase space, the non-linear consequence of the streaming instabilities (Goldman et al., 2008; Goldman et al., 2014).
The electric field accelerates particles in the parallel direction, as discussed in the sections above, but the beams formed interact with the background plasma, with each other and with the ion neutralising background. The resulting effect is to turn the directed bulk energy of beams into thermal heating of the plasma. Electron holes caused by the beam interaction are the smoking gun that give direct evidence of the mechanism behind the acceleration observed by Divin et al. (2012). In phase space, the particle distribution assumes the flat top formed by filling the velocity space between the interacting beams and the bulk plasma. Spacecraft observations have noted the presence of such distributions during separatrix crossings from the Cluster mission (Asano et al., 2008; Wang et al., 2013).
7 Summary
The MMS (Magnetospeheric Multi Scale) mission is nearing its launch date and the theory community has been preparing over the last several years to support the multidisciplinary study of reconnection. A focus of the mission is to observe the fastests and most localised features of the electron physics. We recap here our most recent results in support of the mission, focusing only on the regions near the separatrix. Other important processes develop in the inflow region (Goldman et al., 2014), in the outflow exhaust Vapirev et al. (2013) and in the central region around the reconnection (Goldman et al., 2014) but are not considered here.
We focus instead on the role of the separatrices, considering several important results obtained in the recent literature. The primary novelty of the results presented here, and never published before, is the choice of a large domain that allows the separatrices to develop on larger scales than previously published. Only with the large domains and the open boundary conditions described in Appendix, the physics of the separatrices can be described clearly.
Tables 1-3 report the key results reported in the present study relative to the flow pattern, the Hall physics and the instabilities. Table 4 reports the new results and the new physics of electron and ion energisation reported in the present work for the first time. The study of energy balance is the most recent development in our investigations of reconnection. Previously, we have considered the energetics of the outflow (Lapenta et al., 2014) but the present paper is the first focusing on the energetic exchange at the separatrices.
The Table 4 identifies a key role of the separatrix instabilities: their role in increasing the electron parallel temperature via the streaming instability the phase mix different electron populations leading to larger second moments of the distribution. These are hot electrons whose distribution is very far from Maxwellian and the concept of temperature must be considered in its kinetic sense, because the local thermodynamic equilibrium is certainly not satisfied.
| Key result | Key Figure |
|---|---|
| Flow Deflection at the separatrix: both species receive a great localised deflection at the separatrix turning from a mostly vertical flow to a motley horizontal flow | Fig. 2-3 |
| Electron parallel Flow: near the separatrices the electrons acquire a strong parallel flow | Fig. 2 |
| Electron not frozen-in: at a layer across the separatrice the electrons are subjected to very localised forces and the drift approximation fails, with the frozen in condition being violated, as strongly as in the central diffusion region | Fig. 4 |
| Effect of a guide field: the flow pattern near the separatrices changes radically wit the presence of guide fields. For significant guide fields the parallel electron flow transitions from being always directed towards the x-point to be antisymmetric: on two separatrices it remains towards the x-point but on two others it is away from it. Both species develop a vortical flow | Fig. 6-7 |
| Key result | Key Figure |
|---|---|
| Kinetic Alfvén Wave wing: the Hall term term and of the divergence of the pressure tensor in the generalised Ohm’s law causes a distintive signature interpreted as a kinetic Alfvén wave wing with a quadrupolar out of plane magnetic field and a in plane current pattern and net density perturbation with an associated in plane electrostatic field | Fig. 9 |
| Electrostatic Nature of the Hall electric Field: the strongest electric field in the system is not the out of plane electromagnetic reconnection electric field but the in plane perpendicular field formed across the separatrices. This field is electrostatic in nature. | Fig. 10 |
| Embedded instabilities: the Hall physics signatures are accompanied by clear signs of the presence of instabilities caused by the strong parallel flows and the strong gradients present at the separatrices | Fig. 11 |
| Key result | Key Figure |
|---|---|
| Streaming instabilities: Streaming instabilities are caused by the presence of relative drifts between different components of the electron distribution (two-stream instability) at the separatrices and between the electron and ion distribution (Buneman instability) | Fig. 12 |
| Shear instabilities: a layer across the separatrices has a very sheared electron velocity unstable to Kelvin-Helmholtz-type instabilities. The region presents also strong density gradients subject to dirft-type instabilities. These two sources of free energy lead to instabilities showing in 2D simulations on selected planar orientations and with multiple signatures in fully 3D simulations | Fig. 17 |
| 3D Correlations: all instabilities possible in the separatrix layer develop in fully 3D simulations and a correlation emerges between the different instabilities so that electron holes due to parallel instabilities appear to correlate with the striations aused by perpendicular instabilities | Fig. 19 |
| Effect of Guide Field: the presence of a guide field drastically affects which instabilities become dominant. At low guide fields, the instabilities at the depolarisation fronts are more important, but at higher guide fields the separatrix instabilities take over. | Fig. 20 |
| Key result | Key Figure |
|---|---|
| Bulk energy: The parallel electromagnetic component of the electric field structure caused but the kinetic Alfvén wave wing leads to a large increase of the electron bulk energy at the separatrices. This field is obscured by the stronger electrostatic in-plane field (both parallel and perpendicular). But when isolated its role in accelerating the electrons becomes clear. | Fig. 21 |
| Species heating: two mechanisms share the responsibility of heating both electrons and ions in the exhaust: Fermi acceleration and adiabatic heating. But for the electrons the separatrices become a dominant contribution in the direction parallel to the magnetic field | Fig. 22-23 |
| Parallel heating mechanism: the electron heating at the separatrices in the parallel direction is linked to the same regions where the frozen-in condition becomes violated at the separatrices. There the phase space deviates drastically from the distributions seen in the inflow region (Maxwellian) and in the outflow (flat-top). The electron phase space is dominated by the electron holes produces by the streaming instabilities that convert bulk energy into thermal energy and produce the largest electron temperatures observed in the simulation. | Fig. 25 |
References
- Alexandrova et al. (2006) Alexandrova, O., Mangeney, A., Maksimovic, M., Cornilleau-Wehrlin, N., Bosqued, J.-M. & André, M. 2006 Alfvén vortex filaments observed in magnetosheath downstream of a quasi-perpendicular bow shock. Journal of Geophysical Research (Space Physics) 111, A12208.
- Angelopoulos et al. (1994) Angelopoulos, V, Kennel, CF, Coroniti, FV, Pellat, R, Kivelson, MG, Walker, RJ, Russell, CT, Baumjohann, W, Feldman, WC & Gosling, JT 1994 Statistical characteristics of bursty bulk flow events. Journal of Geophysical Research: Space Physics (1978–2012) 99 (A11), 21257–21280.
- Asano et al. (2008) Asano, Y, Nakamura, R, Shinohara, I, Fujimoto, M, Takada, T, Baumjohann, W, Owen, CJ, Fazakerley, AN, Runov, A, Nagai, T et al. 2008 Electron flat-top distributions around the magnetic reconnection region. Journal of Geophysical Research: Space Physics (1978–2012) 113 (A1).
- Ashour-Abdalla et al. (2011) Ashour-Abdalla, Maha, El-Alaoui, Mostafa, Goldstein, Melvyn L, Zhou, Meng, Schriver, David, Richard, Robert, Walker, Raymond, Kivelson, Margaret G & Hwang, Kyoung-Joo 2011 Observations and simulations of non-local acceleration of electrons in magnetotail magnetic reconnection events. Nature Physics 7 (4), 360–365.
- Birdsall & Langdon (2004) Birdsall, C.K. & Langdon, A.B. 2004 Plasma Physics Via Computer Simulation. London: Taylor & Francis.
- Birn et al. (2012) Birn, J, Artemyev, AV, Baker, DN, Echim, M, Hoshino, M & Zelenyi, LM 2012 Particle acceleration in the magnetotail and aurora. Space science reviews 173 (1-4), 49–102.
- Birn et al. (2001) Birn, J., Drake, J. F., Shay, M. A., Rogers, B. N., Denton, R. E., Hesse, M., Kuznetsova, M., Ma, Z. W., Bhattacharjee, A., Otto, A. & Pritchett, P. L. 2001 Geospace Environmental Modeling (GEM) magnetic reconnection challenge. JGR 106, 3715–3720.
- Birn & Hesse (2014) Birn, J & Hesse, M 2014 Forced reconnection in the near magnetotail: Onset and energy conversion in pic and mhd simulations. Journal of Geophysical Research: Space Physics .
- Birn et al. (2013) Birn, J, Hesse, M, Nakamura, R & Zaharia, S 2013 Particle acceleration in dipolarization events. Journal of Geophysical Research: Space Physics 118 (5), 1960–1971.
- Birn & Priest (2007) Birn, J. & Priest, E. R. 2007 Reconnection of magnetic fields: magnetohydrodynamics and collisionless theory and observations. Cambridge University Press.
- Biskamp (2000) Biskamp, D. 2000 Magnetic Reconnection in Plasmas. Cambridge University Press, UK.
- Brackbill & Forslund (1982) Brackbill, J.U. & Forslund, D.W. 1982 Simulation of low frequency, electromagnetic phenomena in plasmas. J. Computat. Phys. 46, 271.
- Cattell et al. (2005) Cattell, C., Dombeck, J., Wygant, J., Drake, J. F., Swisdak, M., Goldstein, M. L., Keith, W., Fazakerley, A., André, M., Lucek, E. & Balogh, A. 2005 Cluster observations of electron holes in association with magnetotail reconnection and comparison to simulations. Journal of Geophysical Research (Space Physics) 110, A01211.
- Chaston et al. (2009) Chaston, C. C., Johnson, J. R., Wilber, M., Acuna, M., Goldstein, M. L. & Reme, H. 2009 Kinetic alfvén wave turbulence and transport through a reconnection diffusion region. Phys. Rev. Lett. 102 (1), 015001.
- Chaston et al. (2005) Chaston, C. C., Phan, T. D., Bonnell, J. W., Mozer, F. S., Acuńa, M., Goldstein, M. L., Balogh, A., Andre, M., Reme, H. & Fazakerley, A. 2005 Drift-kinetic alfvén waves observed near a reconnection x line in the earth’s magnetopause. Phys. Rev. Lett. 95 (6), 065002.
- Che et al. (2011) Che, H., Drake, J. F. & Swisdak, M. 2011 A current filamentation mechanism for breaking magnetic field lines during reconnection. Nat. 474, 184–187.
- Che et al. (2009) Che, H., Drake, J. F., Swisdak, M. & Yoon, P. H. 2009 Nonlinear Development of Streaming Instabilities in Strongly Magnetized Plasma. Physical Review Letters 102 (14), 145004.
- Che et al. (2010) Che, H., Drake, J. F., Swisdak, M. & Yoon, P. H. 2010 Electron holes and heating in the reconnection dissipation region. grl 37, L11105.
- Curtis (1999) Curtis, Steve 1999 The magnetospheric multiscale mission… resolving fundamental processes in space plasmas. In The magnetospheric multiscale mission: resolving fundamental processes in space plasmas: report of the NASA Science and Technology Definition Team for the Magnetospheric Multiscale (MMS) Mission/S. Curtis. Greenbelt, Md.: National Aeronautics and Space Administration, Goddard Space Flight Center, 1999.(NASA/TM; 2000-209883), , vol. 1.
- Daughton et al. (2006) Daughton, William, Scudder, Jack & Karimabadi, Homa 2006 Fully kinetic simulations of undriven magnetic reconnection with open boundary conditions. Physics of Plasmas (1994-present) 13 (7), 072101.
- Divin et al. (2012) Divin, A., Lapenta, G., Markidis, S., Newman, D. L. & Goldman, M. V. 2012 Numerical simulations of separatrix instabilities in collisionless magnetic reconnection. Physics of Plasmas 19 (4), 042110.
- Divin et al. (2010) Divin, Andrey, Markidis, Stefano, Lapenta, Giovanni, Semenov, VS, Erkaev, NV & Biernat, HK 2010 Model of electron pressure anisotropy in the electron diffusion region of collisionless magnetic reconnection. Physics of Plasmas (1994-present) 17 (12), 122102.
- Drake et al. (1994) Drake, J. F., Kleva, R. G. & Mandt, M. E. 1994 Structure of thin current layers: Implications for magnetic reconnection. Physical Review Letters 73, 1251–1254.
- Drake et al. (2005) Drake, J. F., Shay, M. A., Thongthai, W. & Swisdak, M. 2005 Production of Energetic Electrons during Magnetic Reconnection. Physical Review Letters 94 (9), 095001–+.
- Drake et al. (2003) Drake, J. F., Swisdak, M., Cattell, C., Shay, M. A., Rogers, B. N. & Zeiler, A. 2003 Formation of Electron Holes and Particle Energization During Magnetic Reconnection. Science 299, 873–877.
- Eastwood et al. (2013) Eastwood, JP, Phan, TD, Drake, JF, Shay, MA, Borg, AL, Lavraud, B & Taylor, MGGT 2013 Energy partition in magnetic reconnection in earth’s magnetotail. Physical review letters 110 (22), 225001.
- Fujimoto (2006) Fujimoto, Keizo 2006 Time evolution of the electron diffusion region and the reconnection rate in fully kinetic and large system. Physics of Plasmas (1994-present) 13 (7), 072904.
- Fujimoto et al. (2011) Fujimoto, M., Shinohara, I. & Kojima, H. 2011 Reconnection and Waves: A Review with a Perspective. Space Sci. Rev. 160, 123–143.
- Galeev & Sagdeev (1984) Galeev, A. A. & Sagdeev, R. Z. 1984 Current instabilities and anomalous resistivity of plasma. In Basic Plasma Physics: Selected Chapters, Handbook of Plasma Physics, Volume 1 (ed. A. A. Galeev & R. N. Sudan), p. 271.
- Goldman et al. (2014) Goldman, Newman, DL & Lapenta, G 2014 Collisionless tail reconnection — paradigms and predictions from 2d implicit pic simulations. Space science reviews .
- Goldman et al. (2011) Goldman, M. V., Lapenta, G., Newman, D. L., Markidis, S. & Che, H. 2011 Jet deflection by very weak guide fields during magnetic reconnection. Phys. Rev. Lett., accepted for publication .
- Goldman et al. (2014) Goldman, M. V., Newman, D. L., Lapenta, G., Andersson, L., Gosling, J. T., Eriksson, S., Markidis, S., Eastwood, J. P. & Ergun, R. 2014 Čerenkov Emission of Quasiparallel Whistlers by Fast Electron Phase-Space Holes during Magnetic Reconnection. Physical Review Letters 112 (14), 145002.
- Goldman et al. (2008) Goldman, M. V., Newman, D. L. & Pritchett, P. 2008 Vlasov simulations of electron holes driven by particle distributions from PIC reconnection simulations with a guide field. grl 35, L22109.
- Hamrin et al. (2012) Hamrin, Maria, Marghitu, O, Norqvist, Patrik, Buchert, Stephan, André, Mats, Klecker, B, Kistler, LM & Dandouras, I 2012 The role of the inner tail to midtail plasma sheet in channeling solar wind power to the ionosphere. Journal of Geophysical Research: Space Physics (1978–2012) 117 (A6).
- Harris (1962) Harris, E. G. 1962 On a plasma sheath separating regions of oppositely directed magnetic field. Il Nuovo Cimento (1955-1965) 23, 115–121.
- Hoshino et al. (2001) Hoshino, M., Hiraide, K. & Mukai, T. 2001 Strong electron heating and non-Maxwellian behavior in magnetic reconnection. Earth, Planets, and Space 53, 627–634.
- Huang et al. (2006) Huang, F. C., Wei, F. S. & Feng, X. S. 2006 Theoretical and numerical simulation study of the structure of the hall electric field in the vicinity of the magnetic reconnection site. Journal of Plasma Physics 72, 1–10.
- Huba & Rudakov (2002) Huba, JD & Rudakov, LI 2002 Three-dimensional hall magnetic reconnection. Physics of Plasmas 9, 4435.
- Kleva et al. (1995) Kleva, Robert G, Drake, JF & Waelbroeck, FL 1995 Fast reconnection in high temperature plasmas. Physics of Plasmas (1994-present) 2 (1), 23–34.
- Lapenta (2008) Lapenta, G. 2008 Self-Feeding Turbulent Magnetic Reconnection on Macroscopic Scales. Physical Review Letters 100, 235001.
- Lapenta (2012) Lapenta, Giovanni 2012 Particle simulations of space weather. Journal of Computational Physics 231 (3), 795–821.
- Lapenta & Brackbill (2002) Lapenta, G. & Brackbill, J.U. 2002 Nonlinear evolution of the lower hybrid drift instability: Current sheet thinning and kinking. Phys. Plasmas 9 (5), 1544–1554.
- Lapenta et al. (2013a) Lapenta, Giovanni, Goldman, Martin, Newman, David & Markidis, Stefano 2013a Propagation speed of rotation signals for field lines undergoing magnetic reconnection. Physics of Plasmas 20 (10).
- Lapenta et al. (2014) Lapenta, Giovanni, Goldman, Martin, Newman, David, Markidis, Stefano & Divin, Andrey 2014 Electromagnetic energy conversion in downstream fronts from three dimensional kinetic reconnectiona). Physics of Plasmas (1994-present) 21 (5), 055702.
- Lapenta & Lazarian (2012) Lapenta, G. & Lazarian, A. 2012 Achieving fast reconnection in resistive MHD models via turbulent means. Nonlinear Processes in Geophysics 19, 251–263.
- Lapenta & Markidis (2011) Lapenta, Giovanni & Markidis, Stefano 2011 Particle acceleration and energy conservation in particle in cell simulations. Physics of Plasmas (1994-present) 18 (7), 072101.
- Lapenta et al. (2010) Lapenta, G., Markidis, S., Divin, A., Goldman, M. & Newman, D. 2010 Scales of guide field reconnection at the hydrogen mass ratio. Physics of Plasmas 17 (8), 082106.
- Lapenta et al. (2011) Lapenta, Giovanni, Markidis, Stefano, Divin, A, Goldman, MV & Newman, DL 2011 Bipolar electric field signatures of reconnection separatrices for a hydrogen plasma at realistic guide fields. Geophysical Research Letters 38 (17).
- Lapenta et al. (2013b) Lapenta, Giovanni, Markidis, Stefano, Poedts, Stefaan & Vucinic, Dean 2013b Space weather prediction and exascale computing. Computing in Science & Engineering 15 (5), 68–76.
- Lau & Finn (1990) Lau, Yun-Tung & Finn, John M 1990 Three-dimensional kinematic reconnection in the presence of field nulls and closed field lines. The Astrophysical Journal 350, 672–691.
- Le et al. (2013) Le, A, Egedal, J, Ohia, O, Daughton, W, Karimabadi, H & Lukin, VS 2013 Regimes of the electron diffusion region in magnetic reconnection. Physical review letters 110 (13), 135004.
- Lichtenberg et al. (1980) Lichtenberg, AJ, Lieberman, MA & Cohen, RH 1980 Fermi acceleration revisited. Physica D: Nonlinear Phenomena 1 (3), 291–305.
- Lu et al. (2010) Lu, Q., Huang, C., Xie, J., Wang, R., Wu, M., Vaivads, A. & Wang, S. 2010 Features of separatrix regions in magnetic reconnection: Comparison of 2-D particle-in-cell simulations and Cluster observations. Journal of Geophysical Research (Space Physics) 115, A11208.
- Markidis & Lapenta (2011) Markidis, Stefano & Lapenta, Giovanni 2011 The energy conserving particle-in-cell method. Journal of Computational Physics 230 (18), 7037–7052.
- Markidis et al. (2011) Markidis, Stefano, Lapenta, Giovanni, Bettarini, Lapo, Goldman, M, Newman, David & Andersson, Laila 2011 Kinetic simulations of magnetic reconnection in presence of a background o+ population. Journal of Geophysical Research: Space Physics (1978–2012) 116 (A1).
- Markidis et al. (2012) Markidis, Stefano, Lapenta, Giovanni, Divin, Andrey, Goldman, M, Newman, D & Andersson, Laila 2012 Three dimensional density cavities in guide field collisionless magnetic reconnection. Physics of Plasmas (1994-present) 19 (3), 032119.
- Markidis et al. (2010) Markidis, S., Lapenta, G. & Rizwan-uddin 2010 Multi-scale simulations of plasma with iPIC3D. Mathematics and Computers and Simulation 80, 1509–1519.
- McMillan & Cairns (2007) McMillan, Ben F. & Cairns, Iver H. 2007 Parallel and lower hybrid turbulence in low plasmas driven by strong parallel currents and the resulting parallel electron and perpendicular ion energization. Phys. Plasmas 14 (1), 012103.
- Moses et al. (1993) Moses, RW, Finn, JM & Ling, KM 1993 Plasma heating by collisionless magnetic reconnection: Analysis and computation. Journal of Geophysical Research: Space Physics (1978–2012) 98 (A3), 4013–4040.
- Pan et al. (2012) Pan, Qingjiang, Ashour-Abdalla, Maha, El-Alaoui, Mostafa, Walker, Raymond J & Goldstein, Melvyn L 2012 Adiabatic acceleration of suprathermal electrons associated with dipolarization fronts. Journal of Geophysical Research: Space Physics (1978–2012) 117 (A12).
- Parker (1972) Parker, E. N. 1972 Topological dissipation and the small-scale fields in turbulent gases. Astrophys. J. 174, 499–510.
- Petschek (1964) Petschek, H.E. 1964 Magentic field annihilation. In AAS-NANA Symposium on the physics of solar flares, p. 425.
- Phan et al. (2001) Phan, T. D., Freeman, M. P., Kistler, M. L., Kleckler, B., Haerendel, G., Paschmann, G., Sonnerup, B. U. O., Baumjohann, W., Bavassano-Cattaneo, M. B., Carlson, C. W., DiLellis, A. M., Fornacon, K. H., Frank, L. A., Fujimoto, M., Georgescu, E., Kokubun, S., Moebius, E., Mukai, T., Paterson, W. R. & Reme, H. 2001 Evidence for an extended reconnection line at the dayside magnetosphere. Earth, Planets, and Space 53, 619–625.
- Pontin (2011) Pontin, DI 2011 Three-dimensional magnetic reconnection regimes: a review. Advances in Space Research 47 (9), 1508–1522.
- Priest & Forbes (1999) Priest, E.R. & Forbes, T. 1999 Magnetic Reconnection: MHD Theory and Applications. Cambridge.
- Pritchett (2005) Pritchett, P. L. 2005 Onset and saturation of guide-field magnetic reconnection. Physics of Plasmas 12 (6), 062301.
- Pritchett & Coroniti (2004) Pritchett, P. L. & Coroniti, F. V. 2004 Three-dimensional collisionless magnetic reconnection in the presence of a guide field. Journal of Geophysical Research (Space Physics) 109 (A18), 1220.
- Restante et al. (2013) Restante, AL, Markidis, Stefano, Lapenta, G & Intrator, T 2013 Geometrical investigation of the kinetic evolution of the magnetic field in a periodic flux rope. Physics of Plasmas (1994-present) 20 (8), 082501.
- Ricci et al. (2004) Ricci, P., Brackbill, J.U., Daughton, W. & Lapenta, G. 2004 Collisionless magnetic reconnection in the presence of a guide field. Phys. Plasmas 11 (8), 4102–4114.
- Rogers et al. (2003) Rogers, BN, Denton, RE & Drake, JF 2003 Signatures of collisionless magnetic reconnection. Journal of Geophysical Research: Space Physics (1978–2012) 108 (A3).
- Runov et al. (2013) Runov, A, Angelopoulos, V, Gabrielse, C, Zhou, X-Z, Turner, D & Plaschke, F 2013 Electron fluxes and pitch-angle distributions at dipolarization fronts: Themis multipoint observations. Journal of Geophysical Research: Space Physics 118 (2), 744–755.
- Scholer et al. (2003) Scholer, M., Sidorenko, I., Jaroschek, C. H., Treumann, R. A. & Zeiler, A. 2003 Onset of collisionless magnetic reconnection in thin current sheets: Three-dimensional particle simulations. Physics of Plasmas 10, 3521–3527.
- Sharma & Curtis (2005) Sharma, A Surjalal & Curtis, Steven A 2005 Magnetospheric multiscale mission. In Nonequilibrium Phenomena in Plasmas, pp. 179–195. Springer.
- Shay et al. (2011) Shay, MA, Drake, JF, Eastwood, JP & Phan, TD 2011 Super-alfvénic propagation of substorm reconnection signatures and poynting flux. Physical review letters 107 (6), 065001.
- Sitnov et al. (2009) Sitnov, MI, Swisdak, M & Divin, AV 2009 Dipolarization fronts as a signature of transient reconnection in the magnetotail. Journal of Geophysical Research: Space Physics (1978–2012) 114 (A4).
- Spitzer (1962) Spitzer, L. 1962 Physics of Fully Ionized Gases.
- Sundkvist et al. (2005) Sundkvist, D., Krasnoselskikh, V., Shukla, P. K., Vaivads, A., André, M., Buchert, S. & Rème, H. 2005 In situ multi-satellite detection of coherent vortices as a manifestation of Alfvénic turbulence. Nature Physics 436, 825–828.
- Sweet (1958) Sweet, P. A. 1958 The Neutral Point Theory of Solar Flares. In Electromagnetic Phenomena in Cosmical Physics (ed. B. Lehnert), IAU Symposium, vol. 6, p. 123.
- Titov et al. (2009) Titov, VS, Forbes, TG, Priest, ER, Mikić, Z & Linker, JA 2009 Slip-squashing factors as a measure of three-dimensional magnetic reconnection. The Astrophysical Journal 693 (1), 1029.
- Uzdensky & Kulsrud (2006) Uzdensky, Dmitri A & Kulsrud, Russell M 2006 Physical origin of the quadrupole out-of-plane magnetic field in hall-magnetohydrodynamic reconnection. Physics of Plasmas (1994-present) 13 (6), 062305.
- Vapirev et al. (2013) Vapirev, AE, Lapenta, Giovanni, Divin, Andrey, Markidis, Stefano, Henri, P, Goldman, M & Newman, D 2013 Formation of a transient front structure near reconnection point in 3-d pic simulations. Journal of Geophysical Research: Space Physics 118 (4), 1435–1449.
- Wang et al. (2013) Wang, Rongsheng, Du, Aimin, Nakamura, Rumi, Lu, Quanming, Khotyaintsev, Yuri V, Volwerk, Martin, Zhang, Tielong, Kronberg, EA, Daly, PW & Fazakerley, Andrew N 2013 Observation of multiple sub-cavities adjacent to single separatrix. Geophysical Research Letters 40 (11), 2511–2517.
- Wang et al. (2013) Wang, R., Nakamura, R., Lu, Q., Du, A., Khotyaintsev, Y. V., Volwerk, M., Zhang, T., Kronberg, E. A., Daly, P. W. & Fazakerley, A. N. 2013 Observation of electron acceleration in the separatrix region during magnetic reconnnection. AGU Fall Meeting Abstracts p. B2145.
- Wygant et al. (2005) Wygant, JR, Cattell, CA, Lysak, R, Song, Y, Dombeck, J, McFadden, J, Mozer, FS, Carlson, CW, Parks, G, Lucek, EA et al. 2005 Cluster observations of an intense normal component of the electric field at a thin reconnecting current sheet in the tail and its role in the shock-like acceleration of the ion fluid into the separatrix region. Journal of Geophysical Research: Space Physics (1978–2012) 110 (A9).
- Xu et al. (2010) Xu, G. S., Naulin, V., Fundamenski, W., Rasmussen, J. Juul, Nielsen, A. H. & Wan, B. N. 2010 Intermittent convective transport carried by propagating electromagnetic filamentary structures in nonuniformly magnetized plasma 17 (2), 022501.
- Zhi-Wei & Shu-Ling (2008) Zhi-Wei, Ma & Shu-Ling, Feng 2008 Generation of electric field and net charge in hall reconnection. Chinese Physics Letters 25 (8), 2934.
- Zhou et al. (2011) Zhou, M., Pang, Y., Deng, X. H., Yuan, Z. G. & Huang, S. Y. 2011 Density cavity in magnetic reconnection diffusion region in the presence of guide field. Journal of Geophysical Research (Space Physics) 116, A06222.
Appendix A Simulation approach
The study presented here is based on the massively parallel fully kinetic code iPIC3D, extensively used in previous studies in 2D (iPIC3D; Lapenta et al., 2010; Lapenta, 2012; Lapenta et al., 2011) and in 3D (Markidis et al., 2012; Vapirev et al., 2013).The key peculiarity of iPic3D is to use an implicit time discretization that ensures an increased stability (Brackbill & Forslund, 1982) and better energy conservation (Markidis & Lapenta, 2011; Lapenta & Markidis, 2011). This feature allows thre user to select the desired resolution actually needed for the study without being forced to excessive over-resolution by the constraint for stability and energy conservation typical of explicit discretizations (Lapenta, 2012; Lapenta et al., 2013b). In practice, this benefit allows the user to consider larger systems and more realisitc parameters, including the physical value of the mas ration for hydrogen (Lapenta et al., 2010) and oxygen (Markidis et al., 2011). In the present study, the need for the implicit method is caused by the desire to study the separatrices over large distances, requiring a relatively large box.
We consider an initial Harris equilibrium (Harris, 1962):
| (1) |
with varying guide fields . iPic3D does not use the GSM coordinate system. The coordinates are chosen as: along the sheared component of the magnetic field (Earth-Sun direction in the Earth magnetosphere), in the direction of the gradients (north-south in the magnetosphere) and along the current (dawn-dusk in the magnetotail).
The plasma of the Harris equilibrium is initially Maxwellian with a uniform drift that is prescribed by the force balance. A uniform background is added in the form of a non-drifting Maxwellian at the same temperature of the main Harris plasma. This choice is not dictated by any stability of the numerical solution, as the implicit PIC method employed here has no such limits (unlike the explicit PIC approach) Birdsall & Langdon (2004).The background is added to mimic the observed properties of satellite crossing where the current layers have a peaked density in the center and fall off to a smaller but still respectable value.
In the present study, reconnection is followed from its (artifical) onset caused by a localized X-point perturbation described by the vector potential:
| (2) |
with and , where is the ion skin depth.
The chosen physical parameters for the present study are consistent with the observed properties of the geomagnetic tail: electron thermal velocity , ratio of electron and ion temperatures , current sheet thickness and background density . A reduced mass ratio, is used to reduce the cost of the simulations (especially for the 3D case). These choices correspond also to a realistic Alfvén speed (Lapenta et al., 2010).These ion scales are computed in the Harris density .
We report on two types of simulations, 2D and 3D. All the 2D simulations use a computational box with and resolved with a grid of cells and a time step of . All the simulations use 196 particles per cell per species, with two ion and two electron species (one for the Harris component and one for the background).
All 3D simulations use a computational box , , resolved with a grid of cells and a time step of and 125 particles per species, with two ion and two electron species (one for the Harris component and one for the background).
At all the cells have the same number of particles whose statistical weight is chosen according to the local density which varies significantly due to the Harris equilibrium. Periodic and open boundary conditions are used in and open or perfect conductor conditions ( and ) in . The direction is assumed to be periodic. In 2D, just one cell is used in and this direciton becomes ignorable, but all fields and the velocities of the particles have also the component making the 2D simulation in reality 2D3V.
We have conducted several simulations, conventionally in the text tehy are indicated as either Open or Periodic, followed by BG and the indication of the first decimal of the guide field. Table 5 reports the 2D cases completed and Table 6 reports the 3D cases.
| Name | Guide Field | BC in | BC in |
|---|---|---|---|
| PeriodicBG0 | 0 | Periodic | Conductor |
| PeriodicBG1 | 0.1 | Periodic | Conductor |
| OpenBG1 | 0.1 | Open | Open |
| PeriodicBG3 | Periodic | Conductor | |
| PeriodicBG5 | Periodic | Conductor | |
| PeriodicBG10 | 1 | Periodic | Conductor |
| OpenBG100 | 10 | Open | Open |
| Name | Guide Field | BC in | BC in |
|---|---|---|---|
| 3DPeriodicBG0 | 0 | Periodic | Conductor |
| 3DPeriodicBG1 | 0.1 | Periodic | Conductor |
| 3DOpenBG1 | 0.1 | Open | Open |
| 3DPeriodicBG2.5 | 0.25 | Periodic | Conductor |
| 3DPeriodicBG3.3 | 0.33 | Periodic | Conductor |
| 3DPeriodicBG5 | 0.50 | Periodic | Conductor |
| 3DPeriodicBG7.5 | 0.75 | Periodic | Conductor |
| 3DPeriodicBG10 | 1 | Periodic | Conductor |