The NIR structure of the barred galaxy NGC 253 from VISTAThanks: This work is based on observations taken at the ESO La Silla Paranal Observatory within the VISTA Science Verification Program ID 60.A-9285(A).
Abstract
We want to quantify the structures in the stellar disk of the barred Sc galaxy NGC 253 located in the Sculptor group, at 3.47 Mpc distance. We used J and Ks band images acquired with the VISTA telescope as part of the science verification. The wide field of view and the high angular resolution of this survey facility allow mapping the large and small scale structure of the stellar disk in NGC 253. We used unsharp masking and two-dimensional modeling of the smooth light distribution in the disk to identify and measure the substructures induced by the bar in the stellar disk of NGC 253. We built azimuthally-averaged profiles in the J and Ks bands to measure the radial surface brightness profile of the central bulge, bar and disk. Moving outward from the galaxy center, we find a nuclear ring within the bright 1 kpc diameter nucleus, then a bar, a ring with 2.9 kpc radius, and spiral arms in the outer disk. From the Ks image we obtain a new measure of the deprojected length of the bar of 2.5 kpc. The bar’s strength, as derived from the curvature of the dust lanes in the J-Ks image, is typical of weak bars with degree/kpc. From the deprojected length of the bar, we establish the corotation radius ( kpc) and bar pattern speed ( kms-1 kpc-1), which provides the connection between the high-frequency structures in the disk and the orbital resonances induced by the bar. The nuclear ring is located at the inner Lindblad resonance. The second ring (at 2.9 kpc) does not have a resonant origin, but it could be a merger remnant or a transient structure formed during an intermediate stage of the bar formation. The inferred bar pattern speed places the outer Lindblad resonance within the optical disk at 4.9 kpc, in the same radial range as the peak in the HI surface density. The disk of NGC 253 has a down-bending profile with a break at 9.3 kpc, which corresponds to about 3 times the scale length of the inner disk. We discuss the evidence for a threshold in star formation efficiency as a possible explanation of the steep gradient in the surface brightness profile at large radii. The NIR photometry unveils the dynamical response of the NGC 253 stellar disk to its central bar. The formation of the bar may be related to the merger event that determined the truncation of stars and gas at large radii and the perturbation of the disk’s outer edge.
Key Words.
Galaxies: photometry; spiral; structure; kinematics and dynamics; individual: NGC 253 - Astronomical data bases: Surveys1 Introduction
NGC 253 is a southern11 1 RA(J2000)=00h 47m 33s; DEC(J2000)=-25d 17m 18s, barred, edge-on ( 74 degrees), spiral galaxy in the Sculptor group at a distance of 3.47 Mpc (Radburn-Smith et al. 2011), which yields an image scale of 16.8 parsecs per arcsecond (1 kpc/arcminute). It is one of the best nearby examples of a nuclear starburst galaxy. Even if its overall gas and stellar morphology is typical of a spiral galaxy, several photometric and kinematical studies on this object have revealed that NGC 253 has a rather complicated structure. The deep image of Malin & Hadley (1997), reaching 28 mag/arcsec2, shows the presence of an extended, asymmetrical stellar halo with a semi-major axis radius of about 34 kpc, plus a southern spur. The stellar disk is much more extended than the HI disk (Boomsma et al. 2005), contrary to what is normally observed in spiral galaxies. Furthermore, the HI distribution in NGC 253 presents two other features. The HI disk is less extended on the NE side with respect to the SW, and on the same side, a plume is observed which is elongated perpendicular to the disk major axis and extends for about 12 kpc. This HI plume borders the X-ray halo emission (Pietsch et al. 2000) and the emission (Hoopes et al. 1996) on their northern side. Given the spatial connection, such a feature has been related to the central starburst or, alternatively, to a minor merger and a gas accretion event (Boomsma et al. 2005).
Previous photometric studies in the near infrared ( ) revealed the presence of a bar extending 150 arcsec from the nucleus (Scoville et al. 1985; Forbes & Depoy 1992), in addition to strong nuclear emission. These studies are confined within 3 arcmin radius ( kpc) from the center and do not cover the whole disk that extends out to 30 arcmin ( kpc).
Toward the nuclear regions, an intense starburst is powering the observed outflow of expanding gas shells along the minor axis (Schulz & Wegner 1992). Recently, extraplanar molecular gas was detected by ALMA (Bolatto et al. 2013) which closely tracks the emission. The nuclear outflow is also responsible for the extended X-ray plume (Fabbiano & Trinchieri 1984).
The rotation curve along the disk major axis (Arnaboldi et al. 1995) is asymmetric inside 100 arcsec (1.7 kpc) from the center and the steep velocity gradient for arcsec on the NE side suggests the presence of a nuclear ring, which may be responsible for the gas supply to the nuclear starburst. From this analysis of the bar dynamics one expects an Inner Lindblad Resonance (ILR) at the scale of the observed nuclear ring (Arnaboldi et al. 1995). A nuclear ring of a comparable size has been detected by Müller-Sánchez et al. (2010) based on SINFONI photometry and 2D kinematics in the Ks band. Both kinematical studies cited above have shown that there is an offset between the kinematic center and the brightest location in the nuclear region of NGC 253 (see Fig.1b and Fig.5 in Arnaboldi et al. 1995; Müller-Sánchez et al. 2010, respectively). The puzzle of the nucleus in NGC 253 was discussed in detail by Müller-Sánchez et al. (2010): the SINFONI data have revealed that the IR peak is at about 2.6 arcsec away from the center of the 2D velocity map, while it seems to be consistent with the location of the strongest compact radio source TH2. This radio source has no optical, IR or X-ray counterpart that led to it being excluded as an AGN. Alternatively, since the kinematic center is very close to TH2, they suggested the presence of a dormant black hole in the center of NGC 253, like SgrA* in the MW.
Taking into account that NGC 253 is a nearby extended object, one limitation of all previous imaging data is the absence of high angular resolution covering the entire extent of the galaxy in a single image. This fact has hampered the study of the fine sub-substructures and the ability to correlate them with the outer disk and halo. As we shall discuss in detail in the next sections, this issue is overcome thanks to the advent of the new generation Wide-Field Imaging (WFI) cameras. In fact, NGC 253 has been the target of the Science Verification (SV) for the new ESO survey telescopes VST and VISTA. The primary goal of SV is to test the expected performance of the telescope, camera, and of the data reduction pipeline. NGC 253 was chosen as a SV target for several reasons. First, its extent fills most of the VISTA and VST field such that one can check for possible reflections within the camera optics, and establish most suitable techniques for background subtraction. Second, as NGC 253 is very dusty, NIR imaging is a requisite for studying the underlying structure of the disk. And, finally, a wealth of data is available in the ESO archive (narrow band , broad bands from ESO/MPI-2.2WFI, imaging and spectra of the nucleus from SINFONI at ESO/VLT). The main scientific goals of the SV extragalactic mini-survey22 2 The full SV proposal is available at http://www.eso.org/sci/activities/vltsv/vista/index.html are: 1) detecting the Red Giant Branch stars in the faint outer halo, by using the deep exposures, and 2) study of the disk and bulge structure with shallow exposures. The former science case is presented in Greggio et al. (2014). In this paper, we focus on the latter science case and we show the major results on the structure of NGC 253 derived by the VISTA data in the NIR J and Ks bands. In particular, we derived new and more accurate estimates for the bar length and strength, and discuss the connection between the observed features in the disk and the Lindblad resonances predicted by the bar/disk kinematics.
This paper is structured as follows: in Sec. 2 we present the observations and data reduction; in Sec. 3 we describe the morphology of NGC 253 in the J and Ks bands; in Sec. 4 and Sec. 5 we carry out the surface photometry and the two-dimensional model of the light distribution for the whole system, respectively. Results are discussed in Sec. 6 and concluding remarks are drawn in Sec. 7.
2 Observations & data reduction
The Visible and Infrared Survey Telescope for Astronomy (VISTA) (Emerson et al. 2004; Emerson & Sutherland 2010), located at the Paranal Observatory, in Chile, is a 4 meter telescope equipped with the wide-field, near-infrared camera VIRCAM (Dalton et al. 2004). This instrument consists of 16 Raytheon VIRGO HgCdTe detectors non-contiguously covering a deg2 FoV, in a wavelength range from 0.85 to 2.4 micron. Hence a single VIRCAM exposure, the so-called pawprint, only covers a FOV of 0.6 deg2. This is due to the large gaps between the VIRCAM detectors (Emerson et al. 2004, and of the x and y axes, respectively, see). The contiguous area of 1.65 deg2, the tile, is obtained by combining a minimum of 6 offset pawprints that, in unit of detector size, are 0.475 twice, along the y axis, and 0.95 once, along the x axis (Emerson et al. 2004, see Fig. 5 in). The mean pixel scale is 0.34 arcsec/pixel. In order to account for the variable sky fluctuations and bad pixels, several images are taken by offsetting the telescope in right ascension and declination (jitter) and the series of is repeated at each jitter position, where the Detector Integration Time (DIT) is a short exposure on the target. The jitter offsets are arcsec in size (always arcsec).
For NGC 253, the observations were collected in October 2009 and they consist of two datasets: the deep data, taken with J, Z and NB11833 3 NB118 is a narrow band filter centered close to 1.18micron. See VIRCAM user manual on http://www.eso.org/sci/facilities/paranal/instruments/vircam/doc/ and Milvang-Jensen et al. (2013). filters and the shallow data taken with all broad-band filters i.e., Z, Y, J, H, Ks. Deep data in the J and Z bands are presented in Greggio et al. (2014), where the resolved stellar population is discussed. Here we present and analyze the surface photometry in the J and Ks bands.
The observing strategy adopted for shallow data consisted of positioning the galaxy at the center of the pawprint field, almost filling the central detectors, for three exposures in a six pointings tile sequence, and positioning the galaxy in the gaps between VIRCAM detectors in the other three pointings. In all pointings, the major axis of the galaxy is aligned parallel to the short side of a tile. Taking into account that gaps between detectors are arcmin in one direction and arcmin in the other (Emerson et al. 2004, see Fig.5 in), by positioning the galaxy in the gap, we obtain an offset-sky exposure. The jitter sequences of these frames were used to create the sky frame from their median combination. Before combining them, the offset-sky exposures are scaled to a reference frame. The final sky image is used for background subtraction of each pointing. The observing log for J and Ks shallow data of NGC 253 is listed in Tab. 1.
As described also in Greggio et al. (2014), the data reduction of shallow and deep datasets is carried out using the dedicated CASU pipeline, developed specifically for the reduction of the VISTA data (Irwin et al. 2004).
| Filter | Jitter | Tot. Exp. time | seeing | |
|---|---|---|---|---|
| (seconds) | (hours) | (arcsec) | ||
| J | 24 | 0.6 | 1.1 | |
| Ks | 24 | 0.72 | 0.9 |
2.1 Integrated magnitudes and limits of the VISTA data
In order to quantify the limiting surface brightness of the new VISTA data for NGC 253 we adopted the method described by Pohlen & Trujillo (2006). On the sky-subtracted tiles for the shallow J, Ks and deep J imaging data, we extracted the azimuthally-averaged intensity profile with the IRAF task ELLIPSE. The major axis of the ellipses increases linearly with a step of 50 pixels out to the edges of the frame. The Position Angle (P.A.) and ellipticity () of the ellipses are fixed at a and , which are the disk’s average values for arcsec in NGC 253. In Fig. 1, we show the intensity profile as a function of the semi-major axis for the VISTA data (top panel) and for the 2MASS data (bottom panel) for NGC 253. From these intensity profiles, we estimated the distance from the center where the galaxy’s light blends into the background at zero counts per pixel on average. This radius sets the surface brightness limit of the VISTA and 2MASS photometry. In the J and Ks 2MASS images, this limit is at arcsec, corresponding to a limiting surface brightness of mag arcsec-2 and mag arcsec-2, respectively. The outer limits for the VISTA shallow J and Ks images are at arcsec and arcsec, respectively, while for the deep J band image it is at arcsec. The limiting magnitudes corresponding to these radii are mag arcsec-2 and mag arcsec-2 for the shallow data, and mag arcsec-2 for the deep J band image. The error estimates on the above quantities take the uncertainties on the photometric calibration ( mag) and sky subtraction ( ADU) into account.
We also measured the integrated magnitudes in two circular apertures centered on NGC 253. The first aperture is within 300 arcsec, for both VISTA and 2MASS J and Ks images; the second aperture corresponds to the outer limit of the J deep and Ks VISTA data derived above. Values are listed in Table 5. When the 2MASS magnitudes are transformed into the VISTA system44 4 To compare 2MASS magnitudes with VISTA ones we have applied the following transformation between 2MASS and VISTA systems: , See the following link http://casu.ast.cam.ac.uk/surveys-projects/vista/technical/photometric-properties. the magnitudes inside 300 arcsec are consistent within the photometric errors, in both J and Ks bands.
| Radius | (2MASS) | (2MASS) | (VISTA) | (2MASS) | (2MASS) | (VISTA) |
|---|---|---|---|---|---|---|
| (1) | (2) | (3) | (4) | (5) | (6) | (7) |
| 300 | 5.08 | 5.01 | 4.986 | 4.00 | 4.01 | 4.001 |
| 830 | 3.93 | |||||
| 1305 | 4.69 |

3 Morphology of NGC 253 in the NIR J and Ks bands
Disk structure: bar, ring and spiral arms - The morphology of the Sculptor Galaxy NGC 253 changes dramatically from optical to near-infrared wavelengths66 6 For visualisation purposes, look at the video that cross fades between VISTA and optical images of NGC253, available at the following link: http://www.eso.org/public/videos/eso1025b/ . In the optical, the galaxy structure resembles that of an Sc spiral: the disk is very dusty and star formation regions dominate the spiral arms (Iodice et al. 2012, see). In the J and Ks images of NGC 253, taken at VISTA, the most prominent features of the galaxy are i) the bright and almost round nucleus with a diameter of about 1 arcmin (1 kpc); ii) the bar, with a typical peanut shape ending with very bright edges; iii) a ring-like structure, located in the main disk, enclosing the bar, and iv) the spiral arms, which start at the end of the bar, and dominate the disk. Such structures are already evident in the J-band image (Fig. 2) but become clearer in the Ks image (see Fig. 3 and Fig. 9), because of weaker dust absorption.
The multi-component structure of the NGC 253 disk is emphasized by the unsharp masked Ks-band image, shown in Fig. 4. It is obtained by using the FMEDIAN task in IRAF, with a smoothing box of pixels, and taking the ratio of the Ks-band image to its FMEDIAN smoothed version. In particular, the ring-like structure at the end of the bar can be seen. It has a radius of about 180 arcsec (3 kpc) and appears very bright in the SE and NW sides, close to the edges of the bar.
The nuclear region - The zoomed view of the nuclear region of NGC 253 given in Fig. 5 reveals the presence of a nuclear ring of about 30 arcsec diameter (0.5 kpc). This feature was already detected by Müller-Sánchez et al. (2010) in the Ks data obtained with SINFONI at the VLT. Its morphology and extension are consistent with those derived by the Ks VISTA image, with the latter providing additional evidence for several luminous peaks distributed along this structure, which generate a clumpy azimuthally light distribution. Furthermore, as already found by Müller-Sánchez et al. (2010), the Ks VISTA image confirms that the brightest peak is not coincident with the kinematic center, and that it is located on the SW, at 5.5 arcsec far from the kinematic center (both are marked in Fig. 5). This value has been derived by computing a statistic on the Ks image (with the IMEXAM task in IRAF) inside the central 30 arcsec area.


4 Surface Photometry
In this section we describe the surface photometry and the two-dimensional model of the light distribution for the whole system. As already mentioned in Sec. 1 and Sec. 3, previous kinematical studies showed that the brightest location in the nuclear region does not coincide with the kinematic center of the galaxy. For the following analysis, we adopted as center of the galaxy the kinematic center found by Müller-Sánchez et al. (2010) at and , shown in Fig. 5, which is consistent with the center of the nuclear ring.
4.1 Fit of the isophotes
We used the ELLIPSE task in IRAF to perform the isophotal analysis of NGC 253. The average surface brightness profiles in J and Ks shallow data, as well as that derived from the deep J band image, are shown in Fig. 6.
Disk structure: bar, ring and spiral arms - According to the outer limits of the surface photometry in the VISTA images, derived in Sec. 2.1, the average surface brightness profiles extend out to 830 arcsec (14 kpc) in the Ks band (see Fig. 6 top panel), and out to 1034 arcsec (17 kpc) and 1305 arcsec (22 kpc) in the J band from shallow and deep images, respectively (see Fig. 6 bottom panel).
The main features are: i) inner flat profiles for arcsec (0.2 kpc); ii) the bulge plus bar plateau, arcsec ( kpc); iii) the very extended exponential disk for arcsec ( kpc) (see Fig. 6).
Position Angle (P.A.) and ellipticity (, where is the axial ratio of the ellipses) profiles, in the Ks band where the dust absorption is minimal, are shown in the left panel of Fig. 7. The deviations of the isophotes from pure ellipses are estimated by the and coefficients that are related to the fourth harmonic term of the Fourier series. The and profiles as function of radius are shown in the right panel of Fig. 7. In the regions where the bar dominates the light ( arcsec) the ellipticity increases from 0.4 to 0.7 at arcsec (1.5 kpc), and decreases to about 0.55 at arcsec (2.5 kpc).
In these range of radii, a large twisting is observed. The P.A. varies by about 10 degrees as it moves from degrees, coincident with the peak in ellipticity at arcsec. At larger radii ( arcsec), in the disk region, the P.A. decreases to 52 degrees and both the ellipticity and P.A. remain almost constant until the outermost measurements, at values of 0.8 and 52 degrees, respectively. This implies that the apparent axial ratio of the disk is and the disk inclination is degrees. This value is consistent with the value of degrees derived by Puche et al. (1991) from the HI data of NGC 253.
The and profiles (see Fig. 7, right panel) suggest that the isophotes in the inner regions of the bar ( arcsec, kpc) have a boxy shape, with and , while they become more disk-like at larger radii ( arcsec, kpc), where reaches a maximum of and a minimum of about ( arcsec, kpc). Between 150 and 300 arcsec (i.e., kpc), where the bar connects with the spiral arms, the isophotes are once more boxy (). In the disk regions, for arcsec ( kpc), the fit of the isophotes is consistent with pure ellipses, i.e. and .
The nuclear region - In Fig. 8 we show an enlargement on the central 50 arcsec region for the P.A., (left panels), and for the a4, b4 profiles (right panels) derived by the fit of the isophotes. Inside arcsec (0.25 kpc), where the nuclear ring is observed (see Fig. 5), the ellipticity reaches a maximum of about 0.6 at arcsec (0.17 kpc), and subsequently decreases to about 0.4 at arcsec (0.34 kpc). In this region, the P.A. increases from 45 to 58 degrees. This indicates that the nuclear ring is almost as flat as the bar, but its P.A. differs by about 16 degrees with respect to the bar P.A. (as measured from their outer isophotes, i.e. arcsec for the nuclear ring and arcsec for the bar). Inside these regions, the isophotes are more boxy with a maximum of at arcsec, (0.25 kpc), (see Fig. 8, right panels).
The outer disk - In the region of the outer disk, both J and Ks profiles show abrupt changes of slope for arcsec (9.2 kpc). As shown in the right panel of Fig. 6, the surface brightness profile has a sharp decline with respect to the "inner" regions of the disk, producing a downbending Type II profile, according to the classification of light profiles in disk galaxies (Pohlen & Trujillo 2006; Erwin et al. 2008, see e.g.). This feature can be reasonably ascribed to the effect of disk truncation, as shall be discussed in Sec. 6.3.
In order to derive the break radius of the disk in NGC 253, we performed a least-square fit of the azimuthally averaged surface brightness profiles, restricted to the region where the contribution to the light of the bulge plus bar is negligible, i.e. for arcsec, (2 kpc), (see Fig. 6, right panel). Two exponential functions are used to describe the inner and outer disk:
| (1) |
where is the galactocentric distance, and are the central surface brightness and scale length of each of the two exponential components. In the Ks band, the best fit to the structural parameters are summarized in Table 3. For the J band profiles, we found mag/arcsec2 and arcsec (3.2 kpc) for the inner disk, and mag/arcsec2 and arcsec (2.7 kpc) for the outer disk.
The inner disk scale length is larger than the outer one, being in the Ks band, and in the J band. This is also observed for other galaxies with Type II profiles (Kim et al. 2014). The break radius correspond to the radius at which the magnitudes of the two exponential laws are the same, within . The best fits are shown in the right panel of Fig. 6, and the values of are: arcsec and arcsec (at kpc).


4.2 Deprojected image of NGC 253
We computed the deprojected image of NGC 253, both in the J and Ks bands to measure the bar structure. These measurements are discussed in detail in Sec. 6.1. According to Gadotti et al. (2007), an efficient way to deproject an image is to stretch the image in the direction of the line of nodes by using the IRAF task IMLINTRAN with the constraint that flux is conserved. For NGC 253, we adopted the P.A. of the outer disk (i.e. P.A.= 52 degrees) as the P.A. of the line of nodes and the inclination angle of degrees (see Sec. 4.1). The deprojected image of NGC 253 in the Ks-band is shown in Fig. 9. This is very similar to that derived by Davidge (2010).
In order to derive the deprojected ellipticity for the bar, an important parameter to constrain the bar strength and bar length (see Sec.6.1 for a detailed discussion), we applied the isophotal analysis to the deprojected image in the Ks-band. The deprojected ellipticity radial profile is shown in Fig. 7 (middle-left panel, red points). In the bar region, the pattern is very similar to that of the ellipticity radial profile for the observed image, although, as expected, the ellipticity value and the position of the peak change. The deprojected bar appears longer and less eccentric. The ellipticity reaches its maximum of about 0.65 at larger distances from the center, i.e. R=160 arcsec (2.7 kpc). As expected, the outer disk becomes more circular once deprojected.

4.3 Light and Dust distribution
To describe the light distribution of the major structural components of NGC 253 we extracted the one dimensional (1D) light profiles along the disk major axis (P.A. = 52 degrees) and along the bar major axis (P.A. = 72 degrees) in the J and Ks-band shallow images. These are derived by averaging the counts in a wedge with an opening angle of 5 degrees that extends out to the outer limiting radius derived in Sec. 2.1. Furthermore, we produced the 2D J-Ks color map and extract the J-Ks color profiles along P.A. 52 and 72 degrees. Even if the light profiles in the J band are much more affected by dust, the same components are detected in both J and Ks-band images.
Disk structure: bar, ring and spiral arms - The J and Ks surface brightness profiles along the disk major axis and along bar major axis (Fig. 10 left and right panel, respectively) are characterized by a bright and rather concentrated bulge. Over the average light distribution, some peaks are observed. On the NE side, two peaks are detected for arcsec ( kpc); on the SW side another peak is located at arcsec (2.6 kpc). They are related to the ring-like component enclosing the bar (see Sec. 3 and Fig. 3). At larger radii in the disk regions, as already detected in the average surface brightness profile derived from the isophote fit (see Sec. 4.1), the surface brightness has the typical behavior of a down-bending Type-II profile, observed for disk galaxies (Pohlen & Trujillo 2006; Erwin et al. 2008), with a break radius of arcsec ( kpc).
The signature of the bar in the light profiles along degrees (Fig. 10 right panel) appears on both sides, between arcsec ( kpc), as a plateau followed by a steep decline compared to the underlying exponential disk (Pohlen et al. 2000). This is most evident in the Ks-band. The distance from the galaxy center at which the turn-over in profile slope occurs (at about 118 arcsec, or 2 kpc), can be considered as a rough estimate of the bar projected length (Lütticke et al. 2000). An estimate of the bulge length is given by the region where light peaks over to the bar and the exponential disk. We derived arcsec (1 kpc).
Fig. 11 shows the J-Ks color profiles along the major axes of the disk (left panel) and bar (right panel). On average, both profiles show that: i) at small radii, close to the center, the galaxy is redder ( mag along the major axis) with respect to the outer regions; ii) the color profiles decrease rapidly and reach a value of mag at arcsec (0.84 kpc) as we move away from the center; and iii) the color gradient becomes almost linear with mag to the outermost radii. On both E and W sides along the disk major axis, we associate the peaks in the surface brightness profiles of Fig. 10 (left panel) in the range arcsec ( kpc) with the ring and spiral arms. Projected on the disk major axis (see Fig. 11 - left panel), we see that these features are redder than the underlying disk, with 1.2 mag for the ring and mag for the spiral arms. At larger radii, in particular for , the disk tends to be bluer as varies from 0.9 to about 0.7 mag on NE side, and from 0.7 to about 0.5 mag on SW side. Between arcsec ( kpc), the color profile along the bar major axis is on average redder mag than the disk. We also report the presence of two redder ( mag) peaks, which correspond to the bright edges of the bar (see Sec. 6.1 for an detailed discussion).
The two-dimensional J-Ks color distribution is shown in Fig. 12. The reddest regions, i.e. mag, correspond to the NW arm, the edges of the bar along the EW direction, and the nuclear regions. From the J-Ks color map, one can infer that the dust is confined to the spiral arms and the ring in NGC 253. Dust lanes are curved with their concave side toward the bar major axis and they curl around the nucleus at small radii.
The nuclear region - Fig. 13 shows an enlarged view of both light and color profiles within the nuclear region at arcsec (0.84 kpc). Inside 15 arcsec (0.25 kpc), the light profiles along the disk and bar major axes are very irregular and asymmetric with respect to the center77 7 The central pixel adopted to extract the light and color profiles coincides with the kinematic center found by Müller-Sánchez et al. (2010), given at the beginning of the Sec. 4., and reflect the peculiar nuclear structure of NGC 253. Several small peaks of light are observed and for arcsec, the surface brightness remains almost constant at about mag arcsec-2 and mag arcsec-2 (see Fig. 13, left panel). Along the bar major axis, the light profiles are much more peaked and reach a maximum value of mag arcsec-2. Several compact sources, brighter than the underlying diffuse light distribution in the nuclear ring (see Sec. 3 and Fig. 5), can be identified as being responsible for the observed peaks of the surface brightness profiles. The flat regions can be due to dust absorption that is still quite high even in the Ks-band. This is suggested by the J-Ks color profile which increases by more than one magnitude within 20 arcsec from the galaxy center (see Fig. 13, right panel). Inside arcsec (0.08 kpc), the J-Ks color profile along the bar major axis shows a rapid decrease toward bluer colors, where the minimum is mag. This corresponds to a “blue hole” in the J-Ks color map (see the bottom panel of Fig. 12). The color map also shows redder filamentary structures, with mag, that are most evident in the SE regions of the galaxy, starting from the galaxy nucleus and extending in the orthogonal direction. Such “polar” filaments were observed by Schulz & Wegner (1992), and recently confirmed by ALMA observations (Bolatto et al. 2013); they could be made of dust associated with the outflow material from the burst of newly formed stars. Similar features are observed in the edge-on spiral galaxy NGC 891 (see Whaley et al. 2009, and references therein).


5 Two dimensional model of the light distribution in the Ks band
The current morphological analysis suggests that NGC 253 is dominated by three main structures at different distances from the galaxy center: the bright nucleus, the bar and the extended disk. In addition to the smooth light distribution of these main components we observe the following substructures (see Sec. 3 and Sec. 4, and Fig. 3, Fig. 4 and Fig. 5): a nuclear ring, a ring at the end of the bar and spiral arms. In order to measure the structural parameters of the main galaxy components and quantify the observed substructures, in terms of their total luminosity and radial extensions, we adopted the following approach. In the Ks-band, which is less perturbed by dust, we performed i) a 1D least-square fit of the light profiles along disk and bar major axes with masked substructures; ii) produced a "maximum" symmetric two dimensional (2D) model by assuming that the galaxy light distribution arises solely from the above three components (i.e. bulge, bar and disk); and iii) subtracted the 2D model from the original image to create a residual image with only the substructures. We then measureed the luminosity and extensions of the substructures on this residual image.
The light distribution of the bulge and bar in NGC 253 is modeled by a Sersic law (Sérsic 1963; Kim et al. 2014)
| (2) |
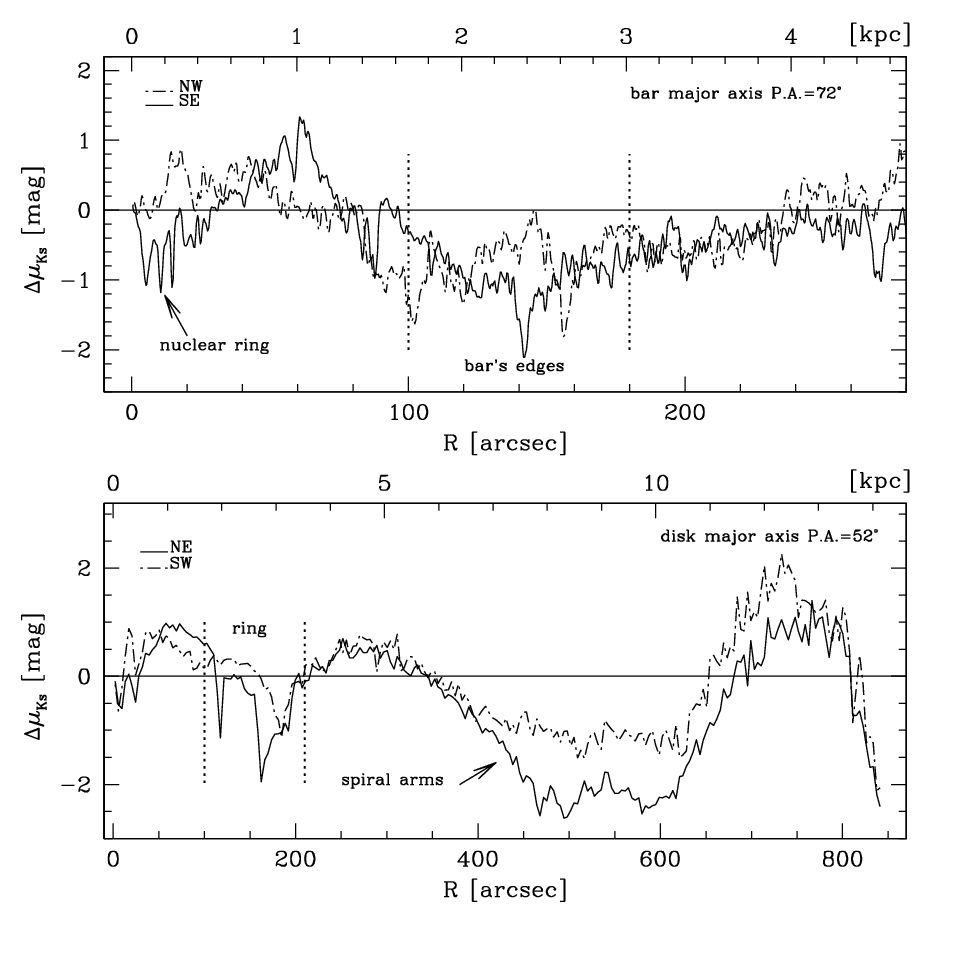
where is the galactocentric distance, and are the effective radius and effective surface brightness, and . For the disk, as described in Sec. 4.1, we adopted a double exponential law to describe the down-bending profile of this component (see also Fig. 6). The maximum symmetric 2D model is made by using the GALFIT package (Peng et al. 2002), where the scale radii ( and ) and the shape parameters are fixed to those values of the 1D fit, while the total magnitudes, axial ratios and P.A.s are left free. A summary of the structural parameters for each component is listed in Table 3 and the results are shown in Fig. 14. In the 2D residual image (bottom-left panel of Fig. 14) all the substructures characterising NGC 253 are clearly visible as regions where the galaxy is brighter than the model: the nuclear ring, the bright regions at the end of the bar from which the two prominent spiral arms emerge, and the ring which encloses the bar.
The difference between the observed and fitted light profiles, along the disk major axis and along the bar, is shown in the right panels of Fig. 14. Along the disk major axis (bottom panel), the largest deviations ( mag) are in the regions corresponding to the ring at arcsec (3 kpc), where the bright bumps are mag brighter than the underlying average light distribution. For arcsec ( kpc), the extended bumps, mag brighter than the double-exponential fit, are due to the spiral arms. The bulge is less prominent with respect to the other components in NGC 253, since the Bulge-to-Total ratio .
Along the bar’s major axis (Fig. 14, upper panel) the fit is very good (better than 0.2 mag), except for the nuclear regions arcsec (0.34 kpc), where the peaks in the galaxy brighter than the model are associated with the nuclear ring (see Sec. 3 and Fig. 5), and for arcsec (2.3 kpc) where the largest deviations of about 2 mag occur close to the edges of the bar.
| Component | Model | n | |||||||
|---|---|---|---|---|---|---|---|---|---|
| mag | mag arcsec-2 | mag arcsec-2 | arcsec | kpc | arcsec | kpc | |||
| Bulge | Sersic | 7.31 | 0.15 | ||||||
| Bar | Sersic | 6.45 | 1.4 | ||||||
| Inner Disk | exp | 4.45 | 2.9 | ||||||
| Outer Disk | exp | 5.19 | 1.5 |

6 Results: the structure of NGC 253
The study of the bar structure is a key issue in addressing the evolution of self-gravitating disk galaxies. Bars play a major role in shaping the present properties of disks, since they are responsible for the re-distribution of the angular momentum and matter within the disk. The response of a disk to a bar can result in the formation of pseudo-bulges, a 3D boxy bar and of substructures such as spiral arms and rings (Athanassoula 2013, see the review by). In this framework, we discuss the case of NGC 253 and explore the connections between the observed substructures in the disk and the orbital resonances predicted by the disk response to the perturbation by the bar.
6.1 The bar structure in NGC 253
The analysis of the light distribution in the shallow J and Ks band images of NGC 253 (in Sec. 3 and 4) indicates the presence of an extended bar with very bright edges that connect to the outer spiral arms (see Fig. 3). The isophotal analysis (see Fig. 7, right panel) suggests that the bar is boxy in the inner region and tends to be disky at larger radii, giving a typical peanut-shaped end. On average, the bar is redder than the disk with mag (see Fig. 11).
In this section, we give a more accurate estimate of the length of the bar and of its strength using the isophote fits, light and color distributions. Furthermore, we discuss whether the bright features occurring at the edges of the bar are ansae, i.e. the typical symmetric enhancement observed at the end of the stellar bars in many barred galaxies.
The estimate of the length of the bar - The previous estimate of the bar length was about 150 arcsec by Forbes & Depoy (1992) from H band images. It was made by measuring the bar extension on the image from the center out to the luminous edge. Taking advantage of the very low dust absorption in the Ks image, we can determine a new and accurate estimate of the deprojected length of the bar ().
According to the method by Gadotti et al. (2007), the observed bar length () is 1.2 times the radius at which the ellipticity is maximum. Given that the ellipticity reaches its maximum at arcsec, 1.5 kpc, (see Fig. 7), we estimate arcsec (1.7 kpc). This value is very similar to the preliminary estimate of the bar projected length derived by the light profiles, given in Sec. 4.3 (see also Fig. 10). The deprojected bar length is derived by the following relation to the observed bar length: , where is the angle between the bar and the disk major axis, and i is the inclination angle. For a 2D bar, given the angle projected on the sky (), one has . From the isophote fitting, we estimate and , thus giving and arcsec, which is 2.5 kpc. The uncertainty on this quantity takes the errors in the ellipticity and P.A., given by the fit of the isophotes, into account, which are 0.002 and 4 degrees, respectively.
The bar strength - Theoretical predictions (Athanassoula 1992a; Athanassoula 1992b) suggest that the degree of dust-lane curvature in barred galaxies is inversely proportional to the bar strength, i.e. dust lanes with greater curvature are found in the weaker bars. This theoretical expectation was confirmed by observations (Comerón et al. 2009; Knapen et al. 2002). For a sample of barred galaxies, with a known value of the bar’s strength parameter , Knapen et al. (2002) quantified the degree of the dust-lane curvature by the ratio (in unit of degree/kpc), with higher values of corresponding to dust lanes with higher curvature. The diagram of versus (Knapen et al. 2002, see Fig.11 of) shows a clear trend, where higher values of correspond to lower values of , i.e. weaker bars. Following the technique described by Knapen et al. (2002), we estimated the curvature of the dust lane in NGC 253. From the deprojected J-Ks color map (shown in Fig. 12), we measured the change in the angle of the tangent to the dust lane. To do this, we have choosen two locations: one where the tangent is almost parallel to the bar’s major axis and the second one where the dust lane curves toward the end of the bar. The locations where the dust lanes connect to the nuclear regions are excluded since the curvature changes too abruptly. For NGC 253 we derived degree/kpc. When compared with the barred galaxies in the sample studied by Knapen et al. (2002), the measured value is in the typical range for weak bars, which are characterized by the strength parameter (Knapen et al. 2002, see Fig. 11 of).
The edges of the bar - The J and Ks images of NGC 253 show round-like and luminous blobs at the ends of the bar (see Fig. 3). These are also evident as high-frequency substructures in the unsharp masked Ks image (Fig. 4). When fitting the surface brightness profiles in the Ks-band along the bar major axis (P.A.=72 degrees), we find that the peak flux at the edges of the bar is symmetrically located at arcsec (1.5 kpc) and is 0.5 mag brighter than the average bar surface brightness (see Fig. 14). The morphology and light distribution of these luminous blobs resemble those typically observed for the ansae in other galaxies (Martinez-Valpuesta et al. 2007, see Fig. 1 and Fig. 2 in).
These regions are redder mag than the average J-Ks color along the bar major axis (see Fig. 11): this observational evidence and the weak bar in NGC 253 are not consistent with the ansae, since the latter do not show any color enhancements and appear mostly in strong bars (Martinez-Valpuesta et al. 2007). An alternative explanation comes from the map of NGC 253 (Hoopes et al. 1996, see Fig. 2 of), which support the identification of these bright regions with area of star formation. The redder colors are well explained by the dust absorption.
6.2 Rings in NGC 253: the role of the orbital resonances
The high angular resolution and the large field-of-view of the VISTA images, together with lower dust absorption in the J and Ks-band, provide robust proof of the existence of two rings within the disk of NGC 253. There is a nuclear ring with a radius of about 15 arcsec (0.2 kpc); it is not uniform, with several bright knots, mostly concentrated on the NE side (see Fig. 5). The brightest peak of the whole galaxy light, in the Ks band, is located on the SW side of this structure, at 5.5 arcsec ( kpc) far from the kinematic center of the galaxy (see Sec. 3). The offset between the kinematic and photometric center has also been observed in other barred galaxies hosting a nuclear ring (Mazzuca et al. 2011), and it varies in the range kpc. It is used as a test for the shape of the potential, since the degree of such a difference is an indication of non-circular motion (Franx et al. 1994). Thus, in the case of NGC 253, a dynamical model is needed to test if such a difference is due to a strong deviation from an axisymmetric potential.
A second ring is located in the main disk enclosing the bar (see Fig. 4), in the range arcsec ( kpc). This component contains active star formation as suggested by the map published by Hoopes et al. (1996), (see Fig. 2 of their paper).
We now discuss the origin of these two rings in turn. Rings within the central kiloparsec are frequently observed in normal disks and barred galaxies (Buta & Crocker 1993; Buta & Combes 1996; Knapen 2005; Comerón et al. 2010) and are most likely associated with resonance orbits. In barred galaxies, the bar plays a crucial role in the redistribution of the angular momentum. The gas is pushed into orbits near dynamical resonances by the bar’s torque and the star formation is triggered by the high gas density in these regions (see Athanassoula 2013, for a review). For barred spiral galaxies with a bar pattern speed and an angular velocity , there are two basic resonance regions at different distances from the galaxy center (Lindblad 1974). These are the Inner Lindblad Resonance (ILR), where , and K is the epicyclic frequency, and the Outer Lindblad resonance (OLR) where . Rings can be formed in the vicinity of the ILRs and at the Ultra-Harmonic Resonance (UHR), where (Buta & Combes 1996). The radius where the UHR occurs lies between the ILR and the corotation radius, for which .
In NGC 253 we can estimate the radii at which the resonances occurs by using the rotation curve along the disk major axis measured by Arnaboldi et al. (1995), and verify whether the nuclear and second ring correspond to any of them. A first attempt was done by Arnaboldi et al. (1995), based on the previous and very uncertain bar length (Forbes & Depoy 1992), that derived a CR radius kpc, an km/s/kpc, and thus predicted an ILR at about 1 kpc and an OLR outside the optical disk. We accurately measured () the intrinsic bar length in Sec. 6.1 to be arcsec kpc. From , the radius of corotation is then arcsec, 3 kpc, (Contopoulos & Grosbol 1989). Contrary to the measured bar length, this quantity has much larger uncertainty, 20, thus, including also the error on , has a total uncertainty of about 50 arcsec ( kpc). The measured circular velocity at is km/s (Arnaboldi et al. 1995), hence the bar pattern speed is km/s/kpc. In Fig. 15 we plot the angular velocity in the disk of NGC 253 and the curves relative to , and . An estimate of the corresponding radius for ILR and OLR are given by the loci where insects the and curves, respectively. We find that the ILR falls at kpc and the OLR at kpc. The curve relative to is also added to the plot, and we estimate the location of the UHR at kpc. Taking into account the error estimate on , the could vary from km/s/kpc up to km/s/kpc, as lower and upper limits, respectively. This implies that the uncertainty on the ILR is about 0.1 kpc. The OLR could fall at 4 kpc, for , and at 7 kpc, for . Finally, the UHR could be in the range kpc, for , and at 2.4 kpc, for . The estimated radius for the ILR is comparable with that of the nuclear ring, within the errors.
The OLR is also inside the optical disk, which extends out to 14 kpc (see Sec. 4 and Fig. 3). The presence of the OLR at arcmin (4.9 kpc) is very close to the peak of the HI surface density observed in the radial range arcmin ( kpc) (Puche et al. 1991). Both the dynamics of spiral patterns and simulations of bar perturbation predict that gas piles up at the OLR (Barnes 1996, see e.g.), and this prediction has been confirmed by observations of other spiral galaxies (Clemens & Alexander 2001). This observational evidence further confirms the reliability of the OLR estimate from the bar pattern speed km/s/kpc.
We now evaluate whether the ring at 2.9 kpc, enclosing the bar, may also originate from orbital resonances. The ring is located very close to where CR lies. However we do not expect a ring to form at corotation, as stellar orbits do not accumulate at this radius (Lindblad 1974). We may also consider this second ring as originating from the UHR radius, however the latter occurs at a smaller radius kpc, even considering the large uncertainties on and thus on , that gives a maximum value for UHR at 2.4 kpc. Thus, bar perturbation theory seems to exclude a resonance origin for this ring. An alternative origin for this ring may be a merger event or a transient structure formed during an intermediate stage of bar formation (see Comerón 2013, and reference therein). Simulations by Athanassoula et al. (1997) show that the impact of a small satellite on a barred spiral galaxy can generate a pseudo-ring that encloses the bar. A merging event has already been considered as a possible explanation for the extra-planar distribution of HI gas in NGC 253 (Boomsma et al. 2005) and its connection to the and X-Ray emission (see Sec. 1). The resolved stellar population studies of the deep VISTA data for NGC 253 show a disturbed disk with extra-planar stars and substructures in the inner halo, also supporting a possible merger event (Greggio et al. 2014, and reference therein).
Alternatively, the bar in NGC 253 could still be forming, and we would be looking at an intermediate phase in the evolution of the bar. The N-body simulations that study the role of gas accretion on bar formation and renewal can also account for the formation of rings surrounding the bar (Bournaud & Combes 2002). These are only speculative suggestions that need to be tested by detailed dynamical models of bar and disk evolution.

6.3 The steep outer disk profile in NGC 253
The most extended component in the shallow images of NGC 253 is the main disk that dominates the J and Ks light out to 1034 arcsec (17 kpc) and 830 arcsec (14 kpc) respectively. In the deep J-band images, the disk extends further out to 1305 arcsec (22 kpc), see Fig. 6.
The light distribution in the disk is characterized by a down-bending Type II profile, with a break at arcsec, i.e. 9.3 kpc (see Sec. 4.1 and the right panel of Fig. 6). The Type II down-bending surface brightness profiles are frequently observed in normal and barred galaxies, where the radial slope may deviate from a pure exponential decline beyond 3-5 disk scale lengths (van der Kruit 1979; Pohlen et al. 2002; Erwin et al. 2008; Pohlen & Truijllo 2006; Munoz-Mateos et al. 2013). For NGC 253 the break is observed at about 3 times the scale length of the inner disk, precisely in the Ks band, and in the J band.
Two possible mechanisms are proposed to explain the observed outer break in the disks of galaxies: an angular momentum exchange and a threshold in star formation. Theoretical studies also showed that bars can generate such disk breaks (Pfenniger & Friedli 1991; Debattista et al. 2006; Foyle et al. 2008), and in such cases, the break resides within the OLR. Observations are in good agreement with the above simulations, showing that the location of the break radius is consistent with the location of the estimated OLR (Erwin et al. 2008; Muñoz-Mateos et al. 2013) in many disks with down-bending profiles.
Pohlen & Trujillo (2006) investigated the location of the break in a sample of spiral galaxies, by dividing the Type II class of profiles into two subcategories, classical or OLR break (named Type II-CT and Type II-OLR, respectively), according to the physical origin of the break. They found that for Type II-CT the break radius is, on average, at kpc, and spans a range from 5.1 kpc to 14.7 kpc. For the Type II-OLR the location of the break spans a wider range, from 2.4 kpc to 25 kpc, with an average value of the break radius of kpc. Muñoz-Mateos et al. (2013) recently investigated the connection between the bars and the location of breaks. In general, most breaks can be found anywhere in the range of surface brightness AB mag arcsec-2 or, equivalently, kpc-2. They also found that the range of possible break-to-bar radii is a function of the total stellar mass, i.e. the most massive disks () have , consistent with the range of OLRs for these galaxies. Galaxies with larger break radii tend to host weaker bars (i.e. with ).
By studying the dependence of the star formation rate (SFR) on the density and dynamics of the interstellar gas in disks, Kennicutt (1989) proposed a different mechanism for the down bending profile in exponential disks. The break sets in because of a critical radius where star formation is inhibited, with the result that a visible change in slope or truncation in luminosity profile is generated at this distance from the galaxy center. The critical radius for star formation can be estimated by the break in the H surface brightness profile (Martin & Kennicutt 2001) and can be compared with the break radius estimated from the light profiles of the underlying stellar population.
What is a realistic explanation for the observed break in the disk of NGC 253? On the basis of the joint analysis of the new NIR VISTA and previous kinematical data for the NGC 253 disk, we place the OLR of the bar at arcmin (4.9 kpc). Taking into account the large uncertainties on and thus on , the maximum value for OLR radius is 7 kpc. The break radius in the light profiles of NGC 253 is at 9.3 kpc. Even if this value is comparable with both the estimates derived by Pohlen & Trujillo (2006) for Type II-CT and Type II-OLR profiles, it is much further out than the location of the OLR. This suggests that the angular momentum exchange, driven by the bar, may not be the origin of the down-bending profile for the disk of NGC 253. This is further confirmed by the ratio for NGC 253, which is more than a factor of two greater than the range of values estimated by Munoz-Mateos et al. (2013) for galaxies with breaks in their light profiles consistent with the OLRs. On the other hand, considering the average deprojected ellipticity of the bar in NGC 253 (0.55, see Fig. 7), the estimated break radius turns out to be consistent with the location of the ones measured in low-mass disk galaxies, with large break radii and hosting weak bars. This is consistent with previous observational studies indicating that “classical breaks” at larger radii are more common in late-type disk galaxies, while the ”OLR breaks" are more frequent in early-type disks (Pohlen & Trujillo 2006; Erwin et al. 2008; Muñoz-Mateos et al. 2013).
On the basis of the above discussion, it is unlikely that the orbit resonances are responsible for the observed break in the surface brightness profile of the outer disk in NGC 253. Hence we consider the alternative origin due to a threshold in the star formation. In NGC 253, the H surface brightness profile is published by Hoopes et al. (1996; see Fig. 6 of that paper). For arcmin ( kpc) the slope changes and shows a sharper decline with respect to smaller radii. The observed break in the H profile falls in the same range where the break in the NIR light profiles are observed. This suggests that some mechanism has inhibited the star formation in the disk of NGC 253 from this radius outward. Both the H and the HI distribution are less extended than the stellar counterpart, reaching a distance from the center of galaxy of 11 kpc (Boomsma et al. 2005). In particular, the deep data in the J band show that the "outer disk" is a factor of two more extended than the H and HI, reaching a distance of 22 kpc from the center (see Fig. 6). This is also confirmed in deep optical band observations by Malin & Hadley (1997). As shown by Greggio et al. (2014), the halo of the galaxy starts from about 20 arcmin ( kpc). The HI distribution (Puche et al. 1991) exhibits a peak in the range arcmin ( kpc). At this HI peak, the neutral gas surface density also has a peak of M, from which it then declines to a value of M at the break radius kpc. This value is significantly lower than the critical surface density at this radius, which is M according to the Kennicutt law (Kennicutt 1989; Martin & Kennicutt 2001). This clearly suggests that some past mechanism has redistributed the gaseous disk and subsequently inhibited the star formation. As already suggested by Boomsma et al. (2005), there are several mechanisms that may be responsible for the truncation of the gaseous disk in NGC 253 and the consequent inhibition of the star formation: the gas in the outer layers may have been ionized by the hot stars and starburst in the disk of NGC 253; the gas may have been removed by the ram pressure stripping of other galaxies in the Sculptor group or, finally, a merger event may have led to significant disturbances in the disk and halo.
7 Summary
We have performed a detailed photometric analysis of the barred spiral galaxy NGC 253 from the deep and shallow data in the J band and shallow data in the Ks band, taken during the Science Verification run of the new VISTA telescope on Paranal. The disk, which extends out to 22 kpc in the deep J band image, hosts three prominent features (see Figure 3): i) the bright and almost round bulge with a diameter of about 1 kpc; ii) the bar, up to 1.7 kpc, with a typical peanut shape ending in very bright edges; and iii) the spiral arms which dominate in the regions of the disk. In addition to the average light distribution of these main components, the following two substructures are observed (see Fig. 4 and Fig. 5): a nuclear ring with a diameter of 0.5 kpc; and a second ring enclosing to the bar with an average radius of 2.9 kpc located in the disk. All the above components are already visible in the J-band image (Fig. 2), but are more clearly identified in the Ks image (see Fig. 3). In Table 4 we list the main parameters for the structural components in the disk of NGC 253 (radial extension, ellipticity, P.A., and average colors), based on our photometric analysis.
| Main components in NGC 253 | ||||
| P.A. | J-Ks | |||
| kpc | degree | mag | ||
| bulge | 0.6 | 0.4 | 58 | 1 - 2 |
| bar | 1.7 | 0.4 - 0.7 | 72 | 1 -1.3 |
| inner disk | 2.9 | 0.7 - 0.8 | 52 | 0.8 - 1 |
| outer disk | 1.5 | 0.8 | 52 | 0.3 - 0.8 |
| substructures in NGC 253 | ||||
| nuclear ring | 0.2 | 0.6 | 52 | 1.5 - 1.8 |
| ring | 2.9 | 0.8 | 52 | 1.2 |
On the basis of the results from the quantitative photometry carried out in this study, we have described the structure of the nucleus, bar and disk, the connection between the observed substructures in the disk and the Lindblad resonances predicted by the bar/disk kinematics (Sec. 6). The main results of this analysis are:
- •
from the degree of the curvature of the dust-lane in the J-Ks color map, we obtain an indication for a weak bar in NGC 253 (see Sec. 6.1). Since the bright knots at the end of the bar are redder than the inner regions, and also given the late-type morphology and strength of the bar, these bright regions are not the ansae typically observed in other barred galaxies, but rather they are regions of local star formation (see Sec. 6.1);
- •
from the measurement of the bar’s deprojected length on the new Ks image, we derive a new value for the corotation radius (CR) in NGC 253, located at kpc. We then estimate the bar pattern speed, km/s/kpc, and the corresponding radii for LRs. We find that the ILR is at kpc, the OLR is at kpc, and the UHR is in the range kpc;
- •
the nuclear ring observed in NGC 253 is located at the ILR. Its morphology and radius is similar to those found for other nuclear rings with a resonant origin observed in several other barred galaxies (Buta & Crocker 1993; Comerón et al. 2010; Mazzuca et al. 2011);
- •
the presence of the OLR at kpc is consistent with the peak of the HI surface density observed at similar radii. We cannot associate the ring at 2.9 kpc with UHR, which is expected at smaller radii. The ring may, in fact, be the result of a minor merger event or, alternatively, a transient structure formed during an intermediate stage of bar formation;
- •
the disk of NGC 253 has a down-bending profile with a break at 9.3 kpc, which corresponds to about 3 times the scale length of the inner disk. We conclude that such break may most likely arise from a threshold in star formation. The exact mechanism which is responsible for the truncation of the gaseous disk in NGC 253, and the consequent inhibition of the star formation, is still to be identified. Three possible mechanisms are presented: ionization of the gas in the outer layers by the hot stars and starburst in NGC 253, ram pressure stripping of the gas by the other galaxies in the Sculptor group or by a merger event.
A merger event has been invoked several times already and by independent authors to explain the current morphology of NGC 253 (Boomsma et al. 2005). This may in fact explain the presence of an extended asymmetrical stellar halo plus a Southern spur, in the deep optical images and recently confirmed by the new deep VISTA data (Greggio et al. 2014), the HI off-plane plume, elongated perpendicular to the disk major axis, the truncation of the gaseous disk and the consequent inhibition of the star formation and the presence of the ring at the barÕs edges, that is clearly detected in the new VISTA shallow images.
To conclude, the new VISTA imaging data presented in this paper provide a detailed and more complete view of NGC 253, and illustrate the amazing capability of the VISTA telescope for studies that require high angular resolution on a large field of view.
Acknowledgements.
This work is based on observations taken at the ESO La Silla Paranal Observatory within the VISTA Science Verification Program ID 60.A-9285(A). We are very grateful to the referee, Michael Pohlen, for his comments and suggestions that improved this work. We thank Jorge Melnick for initiating the VISTA Science Verification and its organization, Thomas Szeifert and Monika Petr-Gotzens for the assistance and help during the observing run, and Jim Lewis, Simon Hodgkin and Eduardo Gonzalez-Solares from CASU for their expert contribution to the VISTA data processing. E.I wish to thank ESO for the financial support and hospitality given during her several visits in 2011 and 2012 to work on the SV data. The authors wish to thank M. Capaccioli, E.M. Corsini, T. de Zeeuw, E. Emsellem, K.C. Freeman and O. Gerhard for useful comments and discussions.References
- Arnaboldi et al. (1995) Arnaboldi, M., Capaccioli, M., Cappellaro, E., Held, E. V., & Koribalski, B. 1995, AJ, 110, 199
- Athanassoula (1992a) Athanassoula, E. 1992a, MNRAS, 259, 328
- Athanassoula (1992b) Athanassoula, E. 1992b, MNRAS, 259, 345
- Athanassoula (2013) Athanassoula, E. 2013, Bars and secular evolution in disk galaxies: Theoretical input, ed. J. Falcón-Barroso & J. H. Knapen, 305
- Athanassoula et al. (1997) Athanassoula, E., Puerari, I., & Bosma, A. 1997, MNRAS, 286, 284
- Barnes (1996) Barnes, J. E. 1996, Dynamics of Galaxy Interactions, ed. R. C. Kennicutt, Jr., F. Schweizer, & J. E. Barnes, 275
- Bolatto et al. (2013) Bolatto, A. D., Warren, S. R., Leroy, A. K., et al. 2013, Nature, 499, 450
- Boomsma et al. (2005) Boomsma, R., Oosterloo, T. A., Fraternali, F., van der Hulst, J. M., & Sancisi, R. 2005, A&A, 431, 65
- Bournaud & Combes (2002) Bournaud, F. & Combes, F. 2002, A&A, 392, 83
- Buta & Combes (1996) Buta, R. & Combes, F. 1996, Fund. Cosmic Phys., 17, 95
- Buta & Crocker (1993) Buta, R. & Crocker, D. A. 1993, AJ, 105, 1344
- Clemens & Alexander (2001) Clemens, M. S. & Alexander, P. 2001, MNRAS, 321, 103
- Comerón (2013) Comerón, S. 2013, A&A, 555, L4
- Comerón et al. (2010) Comerón, S., Knapen, J. H., Beckman, J. E., et al. 2010, MNRAS, 402, 2462
- Comerón et al. (2009) Comerón, S., Martínez-Valpuesta, I., Knapen, J. H., & Beckman, J. E. 2009, ApJ, 706, L256
- Contopoulos & Grosbol (1989) Contopoulos, G. & Grosbol, P. 1989, A&A Rev., 1, 261
- Dalton et al. (2004) Dalton, G. B., Caldwell, M., Ward, K., et al. 2004, in Society of Photo-Optical Instrumentation Engineers (SPIE) Conference Series, Vol. 5492, Ground-based Instrumentation for Astronomy, ed. A. F. M. Moorwood & M. Iye, 988–997
- Davidge (2010) Davidge, T. J. 2010, ApJ, 725, 1342
- Debattista et al. (2006) Debattista, V. P., Mayer, L., Carollo, C. M., et al. 2006, ApJ, 645, 209
- Emerson & Sutherland (2010) Emerson, J. & Sutherland, W. 2010, The Messenger, 139, 2
- Emerson et al. (2004) Emerson, J. P., Sutherland, W. J., McPherson, A. M., et al. 2004, The Messenger, 117, 27
- Erwin et al. (2008) Erwin, P., Pohlen, M., & Beckman, J. E. 2008, AJ, 135, 20
- Fabbiano & Trinchieri (1984) Fabbiano, G. & Trinchieri, G. 1984, ApJ, 286, 491
- Forbes & Depoy (1992) Forbes, D. A. & Depoy, D. L. 1992, A&A, 259, 97
- Foyle et al. (2008) Foyle, K., Courteau, S., & Thacker, R. J. 2008, MNRAS, 386, 1821
- Franx et al. (1994) Franx, M., van Gorkom, J. H., & de Zeeuw, T. 1994, ApJ, 436, 642
- Greggio et al. (2014) Greggio, L., Rejkuba, M., Gonzalez, O. A., et al. 2014, A&A, 562, A73
- Hoopes et al. (1996) Hoopes, C. G., Walterbos, R. A. M., & Greenwalt, B. E. 1996, AJ, 112, 1429
- Iodice et al. (2012) Iodice, E., VISTA Team, VST SV Team, et al. 2012, Mem. Soc. Astron. Italiana, 83, 1174
- Irwin et al. (2004) Irwin, M. J., Lewis, J., Hodgkin, S., et al. 2004, in Society of Photo-Optical Instrumentation Engineers (SPIE) Conference Series, Vol. 5493, Optimizing Scientific Return for Astronomy through Information Technologies, ed. P. J. Quinn & A. Bridger, 411–422
- Kennicutt (1989) Kennicutt, Jr., R. C. 1989, ApJ, 344, 685
- Kim et al. (2014) Kim, T., Gadotti, D. A., Sheth, K., et al. 2014, ApJ, 782, 64
- Knapen (2005) Knapen, J. H. 2005, Astronomy and Geophysics, 46, 060000
- Knapen et al. (2002) Knapen, J. H., Pérez-Ramírez, D., & Laine, S. 2002, MNRAS, 337, 808
- Lindblad (1974) Lindblad, P. O. 1974, in IAU Symposium, Vol. 58, The Formation and Dynamics of Galaxies, ed. J. R. Shakeshaft, 399–411
- Lütticke et al. (2000) Lütticke, R., Dettmar, R.-J., & Pohlen, M. 2000, A&A, 362, 435
- Malin & Hadley (1997) Malin, D. & Hadley, B. 1997, PASA, 14, 52
- Martin & Kennicutt (2001) Martin, C. L. & Kennicutt, Jr., R. C. 2001, ApJ, 555, 301
- Martinez-Valpuesta et al. (2007) Martinez-Valpuesta, I., Knapen, J. H., & Buta, R. 2007, AJ, 134, 1863
- Mazzuca et al. (2011) Mazzuca, L. M., Swaters, R. A., Knapen, J. H., & Veilleux, S. 2011, ApJ, 739, 104
- Milvang-Jensen et al. (2013) Milvang-Jensen, B., Freudling, W., Zabl, J., et al. 2013, A&A, 560, A94
- Muñoz-Mateos et al. (2013) Muñoz-Mateos, J. C., Sheth, K., Gil de Paz, A., et al. 2013, ApJ, 771, 59
- Müller-Sánchez et al. (2010) Müller-Sánchez, F., González-Martín, O., Fernández-Ontiveros, J. A., Acosta-Pulido, J. A., & Prieto, M. A. 2010, ApJ, 716, 1166
- Peng et al. (2002) Peng, C. Y., Ho, L. C., Impey, C. D., & Rix, H.-W. 2002, AJ, 124, 266
- Pfenniger & Friedli (1991) Pfenniger, D. & Friedli, D. 1991, A&A, 252, 75
- Pietsch et al. (2000) Pietsch, W., Vogler, A., Klein, U., & Zinnecker, H. 2000, A&A, 360, 24
- Pohlen et al. (2000) Pohlen, M., Dettmar, R.-J., Lütticke, R., & Schwarzkopf, U. 2000, A&AS, 144, 405
- Pohlen & Trujillo (2006) Pohlen, M. & Trujillo, I. 2006, A&A, 454, 759
- Puche et al. (1991) Puche, D., Carignan, C., & van Gorkom, J. H. 1991, AJ, 101, 456
- Radburn-Smith et al. (2011) Radburn-Smith, D. J., de Jong, R. S., Seth, A. C., et al. 2011, ApJS, 195, 18
- Schlafly & Finkbeiner (2011) Schlafly, E. F. & Finkbeiner, D. P. 2011, ApJ, 737, 103
- Schulz & Wegner (1992) Schulz, H. & Wegner, G. 1992, A&A, 266, 167
- Scoville et al. (1985) Scoville, N. Z., Soifer, B. T., Neugebauer, G., et al. 1985, ApJ, 289, 129
- Sérsic (1963) Sérsic, J. L. 1963, Boletin de la Asociacion Argentina de Astronomia La Plata Argentina, 6, 41
- Whaley et al. (2009) Whaley, C. H., Irwin, J. A., Madden, S. C., Galliano, F., & Bendo, G. J. 2009, MNRAS, 395, 97