A simplified spectrometer based on a fast digital oscilloscope for the measurement of high energy -rays
Abstract
A simplified digital spectrometer for the study of -rays with energies up to MeV is presented and tested. The spectrometer is only consisted of a fast digital oscilloscope and three scintillation detectors which can work in single or in coincidence modes: two BGO-detectors comprising cm BGO-crystalls and one plastic detector which includes an organic polystyrene-based scintillator. The basic properties of the spectrometer (energy resolution, time resolution, -rays detection efficiency) were studied exhaustively also using a Geant4-based Monte-Carlo simulation. Several numerical algorithms for processing of waveforms in offline mode were proposed and tested to perform digital timing, pulse area measurement and processing of pile-up events without rejection. As a result, the spectrometer demonstrated better energy resolution than was obtained by a common 10-bit CAMAC ADC with the same detectors. And the developed algorithm based on the pulse shape analysis for processing of pile-up events showed high efficiency under severe conditions (the portion of pile-ups contained ). The measured maximum counting rate of the spectrometer was waveforms/sec.
Keywords:
Digital spectrometer , Digital oscilloscope , High energy -rays , Pile-up events , Geant4 simulationPACS
29.30.Kv , 29.40.Mc , 29.85.-c1 Introduction
The study of energy and angular spectra of high energy -rays emitted in the spontaneous fission of heavy nuclei remains one of the most attractive ways to create a complete picture of the evolution of the fissioning system (emission of prescission -rays [1], excitation of giant dipole resonances in fission fragments [2, 1]), and to search for exotic radioactivity of heavy nuclei [3, 4]. While the emission process of -rays and neutrons with energies MeV has been studied well enough, the nature of -rays with energies MeV accompanying the spontaneous fission of heavy nuclei should be clarified. Actually, Kasagi et al. [5] reported the emission of high energy -rays with energies up to 160 MeV from the spontaneous fission of . Similar results were obtained by Pandit et al. [6] up to 100 MeV and by Ploeg et al. [7] up to 40 MeV. The measured value of -ray emission probability at 40 MeV was and at 160 MeV was . These results are in contradiction with those were obtained by other three research groups: Pokotilovsky [8] established upper limits of and at and 100 MeV respectively, and Luke et al. [9] and Varlachev et al. [10] established upper limits of and photon per fission for the integrated yield of -rays with energies MeV and MeV respectively.
In these experiments large complex setups were used. For example, in the paper of Kasagi et al. [5] high energy -rays were detected by a seven-element array (each element had a size of ), which was controlled by analog CAMAC electronics. In the other experiments efforts inclined mostly to construct setups using large volume and detectors with an active anticoincidence shield [8, 9, 10] or using multidetector arrays [6, 7], but application of analog electronics for data acquisition and data processing continued. To analyse the reasons why the experimental groups [5, 8, 9, 7, 10, 6] obtained so different results, we note here the crusial problems of the experimental study of this phenomenon: such rare nuclear events occur on the probability level of , and results are strongly influenced by cosmic background and the pile-up effect. We suggest the analog apparatus has to be changed by the digital one to move on. Rapid develoment of fast digital oscilloscopes and appearance of new scintillation materials can really improve and simplify the experimental setup. All modules of the analog electronics can be replaced by only one fast digital storage oscilloscope and BGO-scintillators with smaller sizes can be used instead of large volume and crystals.
In this paper the detailed description of the -ray spectrometer based on a fast digital oscilloscope is presented together with numerical algorithms for timing, pulse area measurement and processing of pile-up events without rejection. This spectrometer was used to study high energy -rays emission accompanying the spontaneous fission of heavy nuclei [11, 12]. Application of a fast digital oscilloscope simplifies the setup greatly and achives much better performance over the analog apparatus in the case of long time experiments. In addition, new numerical algorithm for processing of pile-up events without rejection was successfully tested, and calibration of the spectrometer up to MeV with results of the time-of-flight method implementation to distinguish -rays and neutrons are presented.
2 Setup and software
Fig.1 shows a schematic diagram of the spectrometer, which consists of two BGO-detectors, one plastic detector and a fast digital storage oscilloscope Tektronix TDS 7704B (4 channel inputs, 7 GHz bandwidth, 20 GS/s maximum sampling rate, 8-bit ADC). The BGO-detectors were composed of cm BGO crystals coupled with Photonis XP 4312 photomultiplier tubes (PMT). The plastic detector was composed of a polystyrene-based scintillator with a size of cm and Photonis XP 4312 PMT. The detectors were attached to rails, which determined angles between the BGO-detectors and the plastic detector. The values of the angles were equal to and (Fig.1). A radioactive source (, PuBe and so on) was placed at a distance of 10 cm from the BGO-detectors and at 50 cm from the plastic detector.

Anode pulses of the PMTs were sent directly to the inputs of the digital oscilloscope, where continuous output signals coming from the detectors were digitized into discrete waveforms and stored in the oscilloscope memory after triggering condition was satisfied. Later the waveforms were saved to the oscilloscope’s hard disk and were transferred to a PC through a LAN interface, where they were processed by numerical algorithms in offline mode. Time duration of the waveforms was set to 2 s, which was enough to analyse the shape of BGO-pulses (the scintillation primary decay time of a BGO crystal is ns). The sampling time interval was chosen to 0.2 ns ( sampling points per waveform).
All operations of the digital oscilloscope (waveforms acquisition, data acquisition, oscilloscope parameters setup and others) were controlled by special software written in C++ using a PlugPlay oscilloscope driver. The application connected to the oscilloscope by a TekVisa interface and could perform the following operations:
- 1.
to collect and to save pulses waveforms to a hard disk;
- 2.
to save trigger time for each detected pulse (this is needed for time series analysis);
- 3.
to measure a counting rate on each channel;
- 4.
to reset parameters of the oscilloscope and to save they to a file;
- 5.
to input, to save and to load an order of operations to perform.
Before measurements the oscilloscope was set up to required states in which the oscilloscope will perform operations in the future. These states of the oscilloscope were saved to files. Later a sequence of operations was inputted in the application, so that the oscilloscope could load the desired states in time. After the application was started the spectrometer was needed nobody to control. This method allowed us to conduct experiments without any human control for up to 4 months with periodic pauses for calibration of the spectrometer.
High energy -rays could be detected in two ways: in single mode or in coincidences with low energy -rays and neutrons, which were detected by the plastic detector. Low energy -rays and neutrons were clearly distinguished by the time-of-flight histogram constructed from the time-mark differences between the input waveforms from the plastic detector and any of the BGO-detectors.
2.1 Timing analysis algorithm
In this paper the aim of timing analysis was to acquire the “arrival times” of detected pulses, which were used for pulse area measurements and to distinguish -rays from neutrons by the time of flight. In Ref. [13] it was demonstrated that the constant fraction timing method is the best one, which achieves the highest time resolution. According to this method the time-mark is placed on the leading edge of a pulse at the certain constant fraction level of its full amplitude. The level of was chosen in this work (see Fig.2).
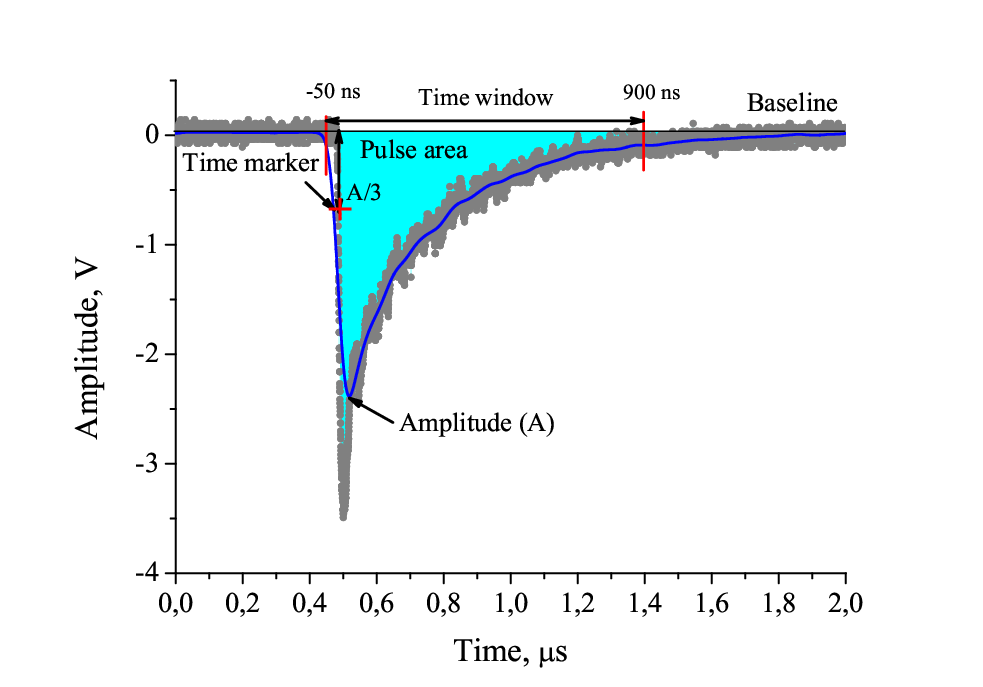
Timing analysis included smoothing of the pulses and search for places for the time-marks on the fronts of the smoothed pulses (see Fig.2). The smoothing was performed by a convolution of the pulses with a Gaussian function. A parameter ns was chosen for the amplitude measurements and ns for the time-mark place searches (a Gaussian function with the parameter value was a good approximation of the front of a BGO-detector pulse, whereas smoothing of the pulses using the parameter value showed the best time resolution). A source of with an activity of fission/sec was used to test the algorithm. The time-difference spectrum of - and neutron- coincidences from the source is presented in Fig.3. The time resolution of the spectrometer was 2.2 ns (the risetime of PMT was 2.1 ns). Is was measured as full-width at half-maximum (FWHM) of the - peak, which was approximated by a Gaussian function. The bump on the left side of the - peak corresponds to events when the BGO-detector registered a neutron and the plastic detector registered a -quantum.
2.2 Pulse area measurement algorithms
The simplest method to measure -ray energy is to calculate area under a pulse within a fix integration time window. It is convenient to dispose this time window relative to the time-mark of a pulse. The boundaries of the integration time window was chosen so that the BGO-detectors achieved the best energy resolution for standard -ray sources: , and PuBe. The best value of the energy resolution was obtained using the time window ns relative to the time-mark, which corresponds to the “0 ns” mark. For the plastic detector the time window ns was chosen relative to the time-mark to capture a pulse completely.
Another approach to pulse area measurement is to use the model description of the pulse shape of inorganic scintillators consisting of the sum of three exponents: the first exponent describes the front of a pulse, the other two — “fast” and “slow” components of scintillation light emission, which describe the tail of a pulse:

| (1) |
where and — the relative magnitudes of the fast and slow components; — the pulse risetime; and — the fast and slow decay time constants. The values of and can be found by approximation of the pulse shapes. Hence, a pulse area equals to the integral of function from Eq. (1) from 0 to :
| (2) |
This method requires much more calculation time than the first one and shows worse energy resolution on standard -ray sources. Nevertheless, the model of the shape of a BGO pulse is useful if pile-up events occur. In this case there is a high probability that more than one pulse is found within the integration time window, so the pulse area measurement cannot be done. To narrow the integration time window pulses were smoothed as it was described in paragraph 2.1 (the parameter value was used). The energy resolution of the BGO-detectors on the 4.43 MeV -line from a PuBe source was using the integration time window ns relative to the time-mark and using the ns one.
2.3 Pile-ups processing algorithm
The study of high energy -rays emission accompanying the spontaneous fission of heavy nuclei requires processing of pile-up events. There are two reasons for this: i) it is important to prove that pulses corresponding to high energy -rays are not overlapped by low energy -quanta; ii) rejection of pile-up events reduces the measured probability of -rays emission. So, the use of fast signal digitization coupled with numerical processing of waveforms can solve this problem.
An example of a numerical algorithm for processing of pile-up events was described in Ref. [14]. The pulses were fitted by means of the Levenberg–Marquardt method with six free parameters to reconstruct the shapes of pulses overlapped in pile-ups. Once the first pulse was reconstructed using Eq. (1), it was subtracted from the original pulse and so on. The shape of scintillation pulses in Ref. [14] depended on whether a neutron or a -quantum was detected. In this paper we present a new algorithm for processing of pile-ups. As BGO scintillator has one primary decay time constant ns ( from Ref. [15]) and considering only the pulse tail, Eq. (1) can be reduced to a very short form with only one free parameter :
| (3) |
where — the pulse amplitude; is the primary decay time constant. Hence, the non-linear curve-fitting problem originated from Eq. (1) does not need to be solved what gives greater computational speed of the algorithm. The algorithm puts the time-marks and measures the pulse area if the time difference between the arrival times for every next two pulses in a waveform exceeds 300 ns (to measure the pulse area) and the contribution to the current pulse area from the previous pulses is less than 20% (to apply the algorithm of timing analysis). The algorithm consisted of the following steps:
- 1.
The waveform smoothing as it was described in paragraph 2.1;
- 2.
Search for the number of pulses and their places in a waveform using two user-specified thresholds — the second derivative threshold and the deviation threshold ;
- 3.
Application of the foregoing algorithms to put the time-marks and to measure area of the found pulses;
- 4.
Correction of pulse area to the contribution from the previous pulses.
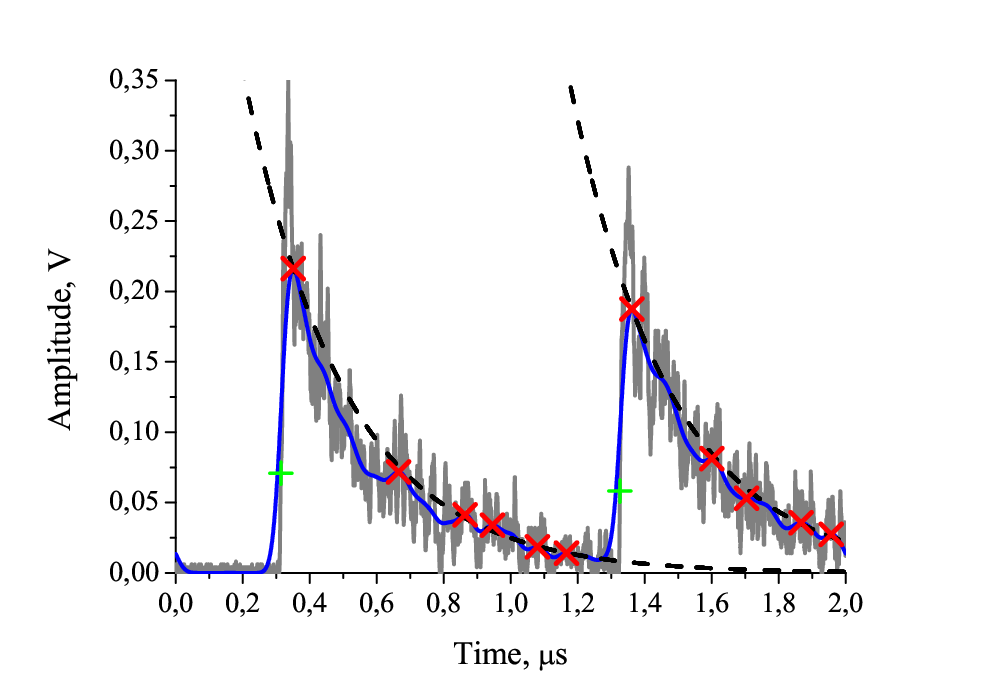
Double numerical differentiation of a waveform was used to find the first pulse so that the second derivative exceeded the threshold . This threshold determines the minimum pulse amplitude (area) that can be recognized. So, the tails of the previous pulses can be found, what gives greater accuracy in the pulse baseline measurement. On the next step an exponent with the decay time constant from Eq. (3) was drawn from the amplitude of the smoothed pulse. A pile-up event was registered when one or some of calculated deviations from local maximums of the smoothed pulse to the exponent (red crosses in Fig.4) exceeded the value of the threshold . A new exponent was drawn from the amplitude of the found pulse and so on. The value of determines the minimum area of an overlapped pulse, which can be recognized by this algorithm. Finally, the contribution to the current pulse area from the previous pulses was calculated as follows:
| (4) |
where — the area contribution from a previous pulse, — calibration coefficient, — the area value of the previous pulse measured within the integration time window ns for the smoothed pulse. The points and are the boundaries of the integration time window for a current i-th pulse. If a current pulse was preceded by several pulses, only the area of the last one was measured, because the previous pulses had already influenced on it.
In the plastic detector pile-up events were unlikely, because pulses coming from the plastic detector had short time duration ( ns) and a distance from the detector to a source was 50 cm. So only the second derivative threshold was used to find the number of pulses in waveforms and all found maximums of second derivative above the threshold are considered belong to independent pulses.
3 Results and discussion
3.1 Calibration and energy resolution of the BGO-detectors, MeV
The BGO-detectors were calibrated using laboratory standard low energy MeV -ray sources: , and . Its spectra are presented in Fig.5. Two peaks in the measured energy spectrum of a PuBe source were used for calibration — the total absorption peak (4.43 MeV -line) and the single escape peak (3.92 MeV). The values of the obtained energy resolution of the BGO-detectors were 15%, 11% and 6.8% for a , a and a PuBe sources, respectively. The energy resolution was plotted in Fig.6 as a function of . A straight line passing through the origin is fitted to the points.


Also the energy resolution value of the BGO-detectors was measured using a 10-bit CAMAC ADC. The measured energy spectra of a and a sources obtained by the CAMAC apparatus are presented in Fig.7. The energy resolution of the BGO-detectors was 13% and 7.4% for a and a PuBe sources respectively.
In the method based on the application of a fast digital oscilloscope the pulse area measurement compensates the worse amplitude resolution by means of a high sampling time discrimination rate. A 10-bit ADC selects the amplitude value by division to the number of ADC-channels and a digital oscilloscope with an 8-bit ADC and sampling points per waveform selects the pulse area by division on the number of elementary cells . That is the reason why the spectrometer based on a fast digital oscilloscope with an 8-bit ADC showed a advantage in the energy resolution over the analog apparatus using a 10-bit ADC with the same detectors and at the same distance from the detector to a source. Another advantage of the digital processing method is an opportunity to process the pulse shapes many times with the use of different numerical algorithms and to develop optimal ones.
3.2 Calibration of the BGO-detectors by cosmic muons
In the energy range MeV the BGO-detectors were calibrated by energy losses from cosmic muons in the BGO-crystals. The BGO-detector responce to muons is appoximately equal to that to -rays (in Ref. [16] it was shown that calibration constants and , defined as the ratio between the energy released into a crystal and the corresponding measured electric signal , are appoximately equal and ). BGO-crystal was placed vertically to detect muons passing through the scintillator along its axis in coincidences with the plastic detector, which was placed above the BGO-detector. The measured energy spectrum of cosmic rays is shown in Fig.8 where the peak is corresponded to energy losses from cosmic muons while the exponent tail is thought belong to cosmic -rays, because an anticoincidence shield was not used. The value of muon energy losses in the BGO-crystal was calculated using a Monte-Carlo simulation and was equal to MeV.


The energy calibration curve for the BGO-detector is presented in Fig.9. The fitting of the experimental points by a straight line was done up to 70 MeV. To test the linearity of the calibration curve in the energy range MeV a “long” cm BGO-crystal was used. This crystal was placed vertically and horizontally so that muons passed different thickness of the BGO crystal along and across its axis. Monte-Carlo simulations showed that in the case of vertical oriented position the maximum of the muon peak is corresponded to MeV of energy loss in the BGO crystal and in the case of horizontal oriented position to MeV.
The energy calibration curve for the “long” BGO-crystal is presented in Fig.10 where straight line fit passing through the origin was plotted across the following three points: MeV from a PuBe source, and 128 MeV using cosmic muons at vertical and horizontal oriented positions of the detector. The calibration curve was found to be linear up to MeV within the measurement errors.


3.3 Response function investigation
A Monte-Carlo simulation was used to investigate the response function of the BGO-detectors to -rays. The calculated responce functions to the -ray energies = 10, 20, 50 and 100 MeV are presented in Fig.11. A distance between the leading edge of the BGO crystal and a point -ray source was 10 cm. For each value of the same number of emitted -rays were generated. In Fig.11 it is shown that the total absorption peak (TAP) decreases with the increasing of . The ratio of the number of events in the TAP to the total number of detected events was equal to 25.6%, 9.8%, 0.6% and 0.02% for =10, 20, 50 and 100 MeV respectively. So, we suggest that the energy equal to one hundred MeV will be an upper limit for this type of -spectrometer.
At second, the dependence of the response function on -rays with fixed energy MeV at different distances from the leading edge of the BGO crystal to a point -ray source was investigated. The calculated responce functions for three values of distance (10, 20 and 50 cm) are shown in Fig.12. The influence of edge effects (incomplete -rays absorption due to emission of secondary -rays and electrons outside the detector) on the shape of the response function is clear.
Also it was shown using a Geant4-based Monte-Carlo simulation that high energy -rays detection efficiency of a cm BGO scintillator is approximately equal to the one for a cm scintillator from Ref. [9]. Therefore, the ratio of the maximum cross-sectional area of the NaI crystal to the BGO one will be , so the contribution of cosmic ray events will be times less for the BGO-crystal.
3.4 Testing of pile-ups processing
The algorithm for processing of pile-ups which was mentioned above in paragraph 2.3 (called the “original” algorithm) was tested using one BGO-detector and a PuBe source with an activity of neutron/sec. The PuBe source was placed at eight different distancies (from 5 to 70 cm) from the detector. waveforms were collected for each distance to test efficiency of the “original” algorithm. The obtained experimental data were also processed by the “simplified” algorithm which found only one pulse with maximum amplitude in each waveform. The comparison of the data processing results for the PuBe energy spectrum is presented in Fig.13 for two values and 70 cm.

Both algorithms demonstrated similar results at cm. At cm the total absorption peak of the -spectrum contained greater events in the case of processing by the “original” algorithm. A theoretical estimate of the overlapped pulses portion is the same value (31%). For cm a theoretical estimate is 0.05% portion of pile-ups that is in agreement with the experimental result (). So, the “original” algorithm was successfully tested under a counting rate up to waveforms/sec for the BGO-detector (measured at cm) and the portion of pile-up events more than 30%.
The maximum counting rate of the oscilloscope with the used-specified setup (the horizontal time window duration 2 s, points per waveform) was measured to be waveforms/sec. The measurements were performed using a digital functional generator Tektronix AFG 3102, which sent a rectangular pulse train with a 1% duty cycle to the oscilloscope input.
4 Conclusion
A complete digital spectrometer based on a fast digital oscilloscope was developed and tested together with numerical algorithms for processing the shapes of pulses coming in coincidences from two BGO- and one plastic scintillation detectors to distinguish low energy neutrons and -rays by the time-of-flight method. The time resolution of the spectrometer was 2.2 ns. Calibration of the BGO-detectors was performed using standard -ray sources and cosmic muons. The response function of the BGO-detectors was investigated using a Geant4-based Monte-Carlo simulation which showed that there is an upper limit for the use of these detectors related to the escape effect of total -ray energy absorption in BGO-detectors at MeV.
Numerical algorithms for digital timing, pulse area measurement and processing of pile-up events are presented and tested in this work. They demonstrated a 10% advantage in the energy resolution of the BGO-detectors over a 10-bit CAMAC ADC. Also new numerical algorithm for processing of pile-up events without rejection was successfully tested for a counting rate waveforms/sec and the portion of overlapped pulses more than . The maximum counting rate value of waveforms/sec was obtained for the spectrometer.
The developed digital methods of acquisition and processing of the pulse shapes are universal, they are useful for solving a variety of practical problems — for the study of the amplitude-time properties of promising scintillators [17, 18], rare nuclear transformations (bremsstrahlung emission accompanying -decay and fission of heavy nuclei, in heavy ion reactions) and so on.
References
References
- [1] P. Glassel, R. Schmid-Fabian, D. Schwalm, D. Habs, H. U. v. Helmolt, 252-Cf fission revisited — new insights into the fission process, Nuclear Physics A 502, 9 (1989) 315–324.
- [2] H. van der Ploeg, J. C. S. Bacelar, A. Buda, C. R. Laurens, A. van der Woude, Emission of photons in spontaneous fission of 252-Cf, Phys. Rev. C 52, 4 (1995) 1915–1923.
- [3] H. Otsu, N. Sakamoto, H. Okamura, H. Sakai, Search for spontaneous pi- emission from a 252-Cf source, Z. Phys. A - Hadrons and Nuclei 342 (1992) 483–485.
- [4] M. Giorgini, Search for a possible spontaneous emission of muons from heavy nuclei, in: 11th ICATPP Conference on Astroparticle, Particle, Space Physics, Detectors and Medical Physics Applications, Como (Italy), 5–9 October 2009.
- [5] J. Kasagi, H. Hama, K. Yoshida, M. Sakurai, Nucleus-nucleus bremsstrahlung observed in the spontaneous fission of 252-Cf, J. Phys. Soc. Jpn. 58 (1989) 620–625.
- [6] D. Pandit, S. Mukhopadhyay, S. Bhattacharya, S. Pal, A. De, S. R. Banerjee, Coherent bremsstrahlung and GDR width from 252-Cf cold fission, Physical Letters B 690 (2010) 473–476.
- [7] H. van der Ploeg, R. Postma, J. C. Bacelar, T. van den Berg, V. E. Iacob, J. R. Jongman, Large gamma anisotropy observed in the 252-Cf spontaneous fission process, Physical Review Letters 68, 21 (1992) 3145–3147.
- [8] Y. N. Pokotilovsky, An experimental upper limit of gamma-ray emission with energy 20 MeV accompanying the spontaneous of 252-Cf, Yadernaya Fizika 52 (1990) 942–943 [in russian].
- [9] S. J. Luke, C. A. Gossett, R. Vandenbosh, Search for high energy gamma-rays from the spontaneous fission of 252-Cf, Physical Review C 44, 4 (1991) 1548–1554.
- [10] V. A. Varlachev, G. N. Dudkin, V. N. Padalko, Does the coherent bremsstrahlung of fission fragments exist?, Journal of Experimental and Theoretical Physics Letters 82, 7 (2005) 390–393.
- [11] N. V. Eremin, A. A. Paskhalov, S. S. Markochev, G. Mandaglio, M. Manganaro, G. Fazio, G. Giardina, M. V. Romaniuk, New experimental method of investigation the rare nuclear trasformations accompanying atomic process: bremsstrahlung emission in spontaneous fission of 252-Cf, International Journal of Modern Physics E 19, nos.5&6 (2010) 1183–1188.
- [12] N. V. Eremin, S. S. Markochev, A. A. Paskhalov, G. Mandaglio, M. Manganaro, G. Fazio, G. Giardina, M. V. Romaniuk, Investigation of the high energy gamma-rays accompanying spontaneous fission of 252-Cf in double and triple neutron-gamma coincidences, Journal of Physics: Conference Series 282 (2011) 012017.
- [13] J. Nissila, K. Rytsola, R. Aavikko, A. Laakso, K. Saarinen, P. Hautojarvi, Performance analysis of a digital positron lifetime spectrometer, Nucl. Instr. and Meth. A 538 (2005) 778.
- [14] F. Belli, B. Esposito, D. Marocco, M. Riva, Y. Kaschuck, G. Bonheure, A method for digital processing of pile-up events in organic scintillators, Nucl. Instr. and Meth. A 595 (2008) 512–519.
- [15] V. V. Avdeichikov, L. Bergholt, M. Guttormsen, J. E. Taylor, L. Westerberg, B. Jakobsson, W. Klamra, Y. A. Murin, Light output and energy resolution of CsI, YAG, GSO, BGO and LSO scintillators for light ions, Nuclear Instruments and Methods in Physics Research A 349 (1994) 216–224.
- [16] J. A. Bakken, L. Barone, A. Bay, J. J. Blaising et al., Results on the calibration of the L3 BGO calorimeter, Nucl. Instrum. Meth. A 343 (1994) 456–462.
- [17] N. V. Eremin, S. S. Markochev, A. A. Paskhalov, Application of fast digital shape analysis for investigation amplitude-temporal properties of inorganic scintillators: YAP, BGO, CsI, BaF2, in: Book of Abstracts 60 International Conference on Nuclear Physics ”Nucleus 2010”, Saint-Petersburg, 2010, p. 363.
- [18] S. S. Markochev, N. V. Eremin, V. I. Arbuzov, A method of digital processing of the shape of inpulses applied to investigation of promising scintillators, Functional Materials 20, no.3 (2013) 393–396.