The Deep Full-Stokes Radio Sky–References
The Deep Full-Stokes Radio Sky
Abstract
The new broad-band capabilities of large radio interferometers such as the GMRT and JVLA allow for long-integration mosaic imaging observations to create ultra-deep full-polarization images of the sky over wide frequency ranges. Achieving rms sensitivities of order 1 Jy, these observations explore the radio source population at flux densities well below the regime dominated by classical radio galaxies and Active Galactic Nuclei. We present initial results from radio sources revealed with deep mosaicking observations with the GMRT and JVLA at respectively 0.6 and 5 GHz, and evidence that the Jy sensitivity level marks the transition to detection of polarized emission from a population of sources dominated by emission from magnetic fields in the disks of starburst and normal galaxies.
keywords
polarization – radio continuum: galaxies – magnetic fields1 Introduction
Magnetic fields are an essential part of many astrophysical phenomena, but fundamental questions remain about their evolution, structure and origin. Exploring the magnetic universe is one of the key science themes of the Square Kilometre Array project (Schilizzi et al., 2008). Polarimetry of radio synchrotron emission is one of the most successful probes of magnetic fields. Imaging the deep polarized sky will be required to probe the evolution and role of cosmic magnetism over a significant fraction of cosmic history.
Taylor et al. (2007) and Grant et al. (2010) first studied populations with polarized flux densities below 1 mJy at 1.4 GHz. At these levels the polarized population remains dominated by radio galaxies and AGN with total flux densities of 10’s of mJy. A key goal of deep polarization imaging is the detection of polarized emission from galaxy disks. The integrated fractional polarization of a sample of nearby disk galaxies was measured at 4.8 GHz by Stil et al. (2009), who showed that at least 60% of normal spirals are polarized at higher than 1%. Radiation from more distant galaxies begins to become a significant fraction of the radio wavelength source population below a total intensity flux density of a few mJy (e.g. Condon 1984). Detection of polarized emission from galaxy disks in the distant universe thus requires imaging observations capable of detecting down to Jy levels and below. In this paper we provide an initial report on deep polarization imaging observations with the GMRT and JVLA to begin the exploration of the Jy polarized sky.
2 Observations and Imaging
GMRT observations were carried in several sessions from 2011 to 2013. An area of 1.2 sq degrees of ELAIS N1 was covered by a mosaic of 7 pointings arranged in a hexagon pattern centred on = 16h 10m 30s, = 54o 35 00′′. Each pointing was observed for approximately 30 hours in three 10-hour sessions. Data were taken in 256 spectral channels in four polarization states covering a 32 MHz bandwidth centred at 612 MHz. The flux scale, bandpass and absolute position angle calibration was secured by observations of 3C286 twice in each observing session. Time dependent gains and on-axis polarization leakage corrections were measured by frequent observations of J1549+506. To reduce the noise and mitigate the effect of off-axis gain and polarization response in the central regions of the mosaic, the separation of the pointings on the sky was closely spaced at 16′, or 38% of the FWHM.
JVLA observations of a smaller, 0.13 sq degree, region centred on the GMRT field were obtained in the C and B configurations during 2012 and 2013, using 3C286 and J1624+5652 for primary and secondary polarization calibration. Each of 10 closely-spaced (3.5′ or 35% of the FWHM) pointings was observed for about 3 hours in each array configuration, for a total of 60 hours. Data were taken in 1024 channels over a 2 GHz band centred at 5 GHz. Additional observation in A configuration are ongoing.


Both GMRT and JVLA visibilities were calibrated, imaged and mosaicked using the CASA processing software. The central 0.9 sq degrees of the GMRT mosaic image are shown in Figure 1. The rms noise in this mosaic is 10.3 Jy/beam before primary beam correction. The angular resolution is 6.1. Within the region defined by the half-power point of the 6 outer pointings, there are 2800 sources above a flux density of 50 Jy. The JVLA 5 GHz mosaic image is shown at right in Figure 2. The angular resolution of the JVLA image is 2.5′′ and the rms noise in this image is 1.05 Jy/beam before primary beam correction. Within an area of 0.12 square degrees 483 radio sources are detected above a flux density of 5 Jy.
The GMRT image shows a handful of classical bright double-lobed radio galaxies. However the majority of the sources form a dense “background” of compact sources scattered throughout the image that are largely unresolved at 6′′ resolution. The Stokes differential source counts derived from the mosaic are shown in Figure 3. The counts flatten at about 1 mJy and continue approximately flat down to the detection limit. Simulated counts by Massardi et al. (2010), also shown on the figure, indicate that below about 450 Jy, the population is dominated by star forming galaxies. A smaller fraction of more nearby "normal" galaxies is expected to dominate over AGN at around 100 Jy.
![[Uncaptioned image]](1405.0117v1/counts610.png)
|
|
3 Polarization of the Jy Sky

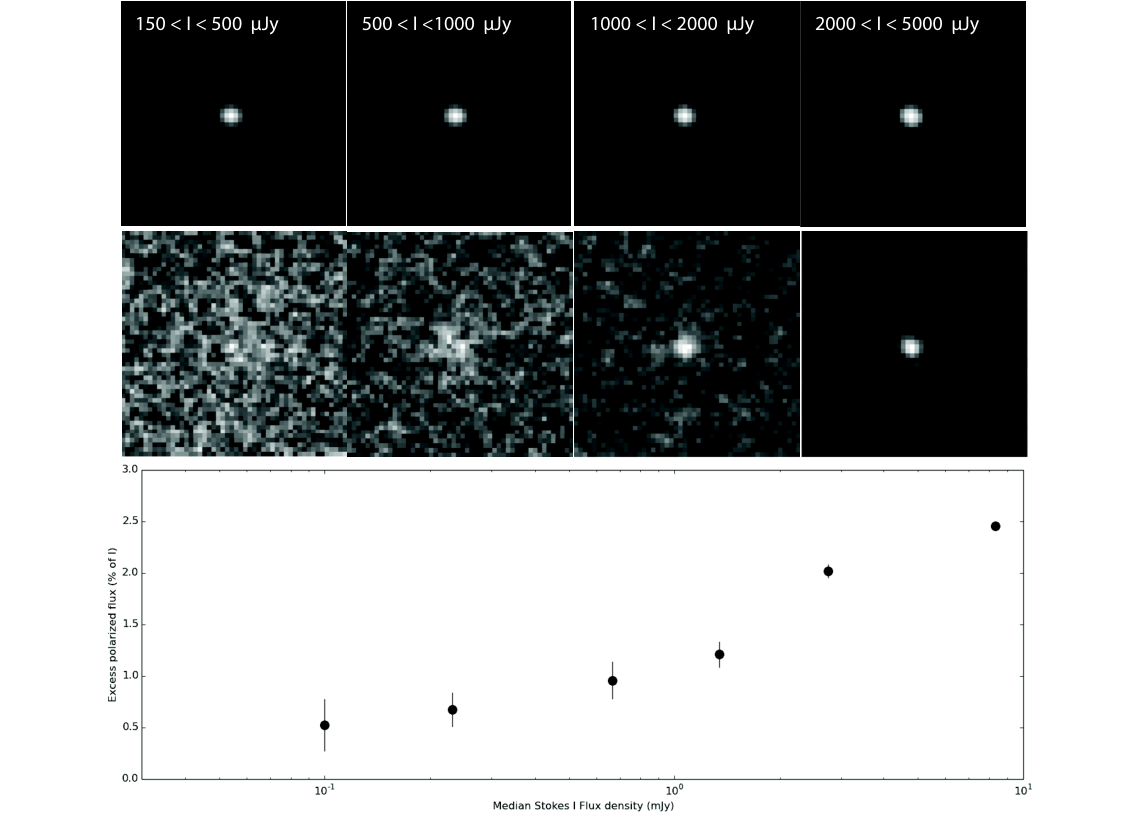
The rms noise in the GMRT Stokes and images is 7.2 Jy, about 30% lower than Stokes . Figure 4 shows the polarized intensity mosaic of the same region shown in Figure 1. Numerous polarized sources are seen. Virtually all of the stronger classical double radio galaxies are visible. To explore statistically the potential presence of polarized signals from the fainter population we undertook a stacking analysis. For all sources in six bins of total flux density ranging from 60 Jy to 10 mJy, median stacked images in Stokes and polarized intensity were created. Sample results are shown in Figure 5. There is evidence of polarized signals down to Stokes I flux densities of 200 Jy – well into the flux density regime of star forming galaxies.
![[Uncaptioned image]](1405.0117v1/polcount_paper.png)
|
|
Derivation of actual median percent polarizations from the stacking analysis will require Monte Carlo simulations, since there is a non-linear relationship between intrinsic and observed polarized intensity in stacking (Stil et al. 2014). However the results suggest a decrease in median fractional polarization below Stokes I flux densities of about a mJy. This decrease may reflect a smaller overall fraction of polarized sources perhaps arising from a weak AGN component within star forming galaxies or a small fractional polarization arising from galaxy disks. The latter is consistent with the polarization properties of galaxies predicted of Stil et al. (2009) in which internal depolarization effects from thermal plasma decreases the fractional polarization of disk emission at frequencies below a few GHz. In this case higher fractional polarization would occur at higher frequencies, where internal depolarization is reduced. Figure 6 show the polarized source counts from the JVLA 5 GHz images. The dot-dashed in the figure shows the predicted polarized counts for disk galaxies based on the Stil et al. polarization properties of nearby galaxies.
These preliminary results suggest that we are beginning to probe polarized emission from distant galaxies at Jy flux densities. Detection to deeper fractional polarization levels will require off-axis corrections using the wide-band AW projection (Bhatnagar et al., 2013) with GMRT beam measurements which are underway (Jagannathan et al., 2014). Beyond this, the new broad-band upgrade to the GMRT will improve sensitivity by an order of magnitude, allowing polarization imaging at the sub-Jy regime, and opening up the systematic study of the magnetic properties of galaxies in the distant universe as a major step toward the SKA.
References
- Bhatnagar et al. (2013) Bhatnagar, S., Rau, U. and Golap, K., 2013, ApJ, 770, 91.
- Condon (1984) Condon, J.J. 1984, ApJ, 287, 461.
- Garn et al. (2008) Garn, T., Green, D.A., Riley, J.M., Alexander. P., 2008, MNRAS, 383, 75.
- Grant et al. (2010) Grant, J., Taylor, A.R., Stil, J.M., et al., 2010, ApJ, 714, 1689.
- Jagannathan et al. (2014) Jagannathan, P., Taylor, A.R., Bhatnagar, S., et al. 2014, BASI, (this volume).
- Massardi et al. (2010) Massardi, M., Bonadli, A., Negrell, M., et al. 2010, MNRAS, 404, 532.
- Schilizzi et al. (2008) Schilizzi, R.T., Dewdney, P.E., and Lazio, J., 2008, Proceedings of the SPIE, 7012.
- Stil et al. (2014) Stil, J.M., Keller, B., George, S., and Taylor, A.R. 2014, ApJ, submitted.
- Stil et al. (2009) Stil, J. M., Krause, M., Beck, R. and Taylor, A. R. 2009, ApJ, 693, 1392.
- Taylor et al. (2007) Taylor, A.R., Stil, J.M., Grant. J.K., et al. 2007, ApJ, 666, 201.
- Wilman et al. (2008) Wilman, R.J., Miller, L., Jarvis, M.J., et al. 2008, MNRAS, 388, 1335.