Faint Population III supernovae as the origin of the most iron-poor stars Note: submitted to the Astrophysical Journal Letters
Abstract
The most iron-poor stars in the Milky Way provide important observational clues to the astrophysical objects that enriched the primordial gas with heavy elements. Among them, the recently discovered iron-deficient star SMSS J031300.36-670839.3 shows a remarkable chemical composition with non-detection of iron ([Fe/H]) and large enhancement of carbon and magnesium relative to calcium. We investigate supernova yields of metal-free (Population III) stars to interpret the abundance pattern observed in this star. We report that the high [C/Ca] and [C/Mg] ratios and upper limits of other elemental abundances are well reproduced with the yields of core-collapse supernovae (that have normal kinetic energies of explosion of erg) and hypernovae () of Population III 25 or 40 stars. The best-fit models assume that the explosions undergo extensive matter mixing and fallback, leaving behind a black hole remnant. In these models, Ca is produced by static/explosive O burning and incomplete Si burning in the Population III supernova/hypernova, in contrast to the suggestion that Ca is originated from the hot-CNO cycle during the presupernova evolution. Chemical abundances of four carbon-rich iron-poor stars with [Fe/H], including SMSS J031300.36-670839.3 are consistently explained by the faint supernova models with the ejected mass of 56Ni less than 10.
Subject headings
Stars: abundances — stars: Population III — supernovae: generalI. Introduction
Characteristic masses of the first stars (Population III or Pop III stars) and the nature of their supernova explosions are critically important to determine their role in the cosmic reionization and subsequent star formation in the early universe [6, e.g.]. Cosmological simulations have shown that the Pop III stars could be very massive , as the result of cooling of primordial gas via hydrogen molecules [5, e.g.]. More recent studies, however, propose the mechanisms in which lower mass stars can form through radiation feedback from growing protostars and/or disk fragmentation [20, 13, 19, 7, 37].
Abundance patterns of the lowest-metallicity stars in our Galaxy provide us with a rare opportunity to observationally constrain the masses of the Pop III stars. The chemical abundances in the four iron-poor stars with [Fe/H], HE 0107-5240 [11], HE 1327-2326 [15, 1], HE 0557-4840 [32], and SDSS J102915172927 [8] (see Hansen et al. [17] for a recent discovery of another metal-poor star in this metallicity range) do not show signature of pair-instability supernovae of very massive () stars as their progenitors [31, and references therein]. Instead, the observed abundances in these stars are better explained by the yields of core-collapse supernovae of moderately massive Pop III stars with several tens of [43, 44, 27, 21, 40, 42, 41, 18, 25].
Another important insight into the nature of the Pop III stars is that a large fraction of most iron-poor stars are carbon-rich [17, e.g.]. Iwamoto et al. [21] suggests that the large enhancement of carbon observed in both HE 0107-5240 and HE 1327-2326 is explained by their models with mixing of supernova ejecta and their subsequent fallback on to the central remnant. These models with different extent of the mixing regions simultaneously reproduce the observed similarity in [C/Fe] and more than a factor of differences in [O, Mg, Al/Fe] between the two stars.
A metal-poor star SMSS J031300.36-670839.3 (SMSS J0313-6708), recently discovered by SkyMapper Southern Sky Survey, provides us with a new opportunity to test theoretical predictions about the Pop III stars [23, 24]. Follow-up spectroscopic observations found that this object shows an extremely low upper limit for its iron abundance ([Fe/H]); more than dex lower than the previous record of the lowest iron-abundance stars.
In this letter, we extend the study of Iwamoto et al. [21] and examine whether the abundances of the five stars with [Fe/H], including the most iron-deficient star SMSS 0313-6708, can be consistently explained by the supernova yields of Pop III stars which undergo the mixing and fallback.
II. Models
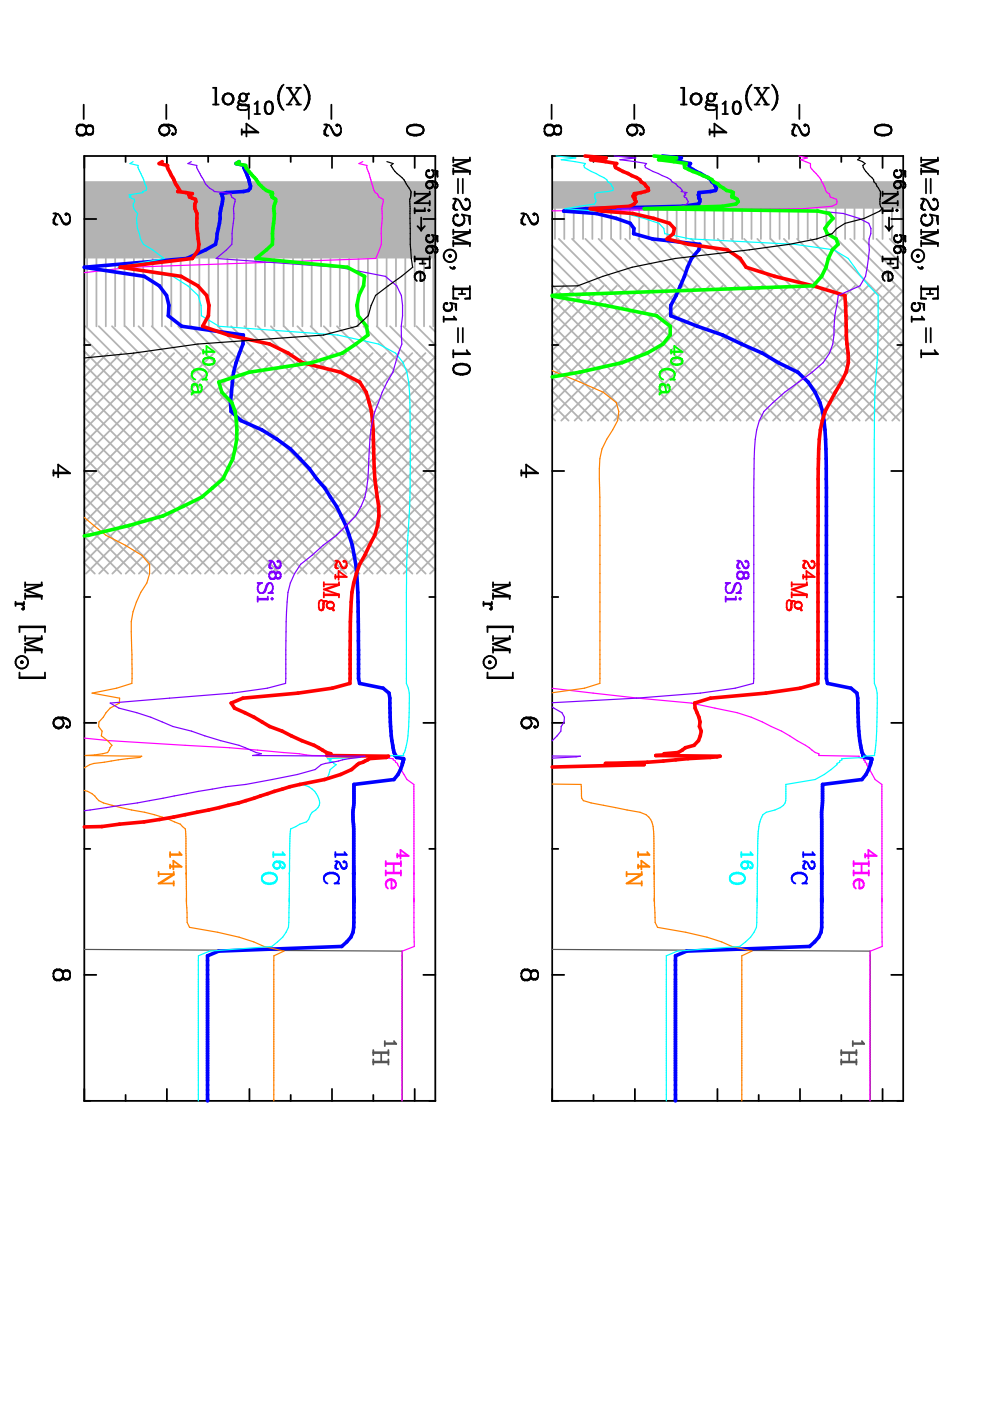
We employ the Pop III supernova/hypernova yields of progenitors with main-sequence masses of [21] and [39] and assume kinetic explosion energies, , of erg for the model and for the model in the same way as in Tominaga et al. [40]. The abundance distribution after the explosions of the models with and as a function of the enclosed mass () are illustrated in Figure 1.
For the parameters that describe the extent of the mixing-fallback, we follow the prescription of Umeda & Nomoto [43] and Tominaga et al. [40] as briefly summarized below. We assume that the supernova ejecta within a range between an initial mass-cut and are mixed and a fraction of the mixed material fall back onto the central remnant, presumably forming a black hole. This approach has been compared with a hydrodynamical calculation of jet-induced explosions [42] and it is demonstrated that the prescription of the mixing-fallback applied to a one-dimensional calculation mimics an angle-averaged yield of the aspherical supernovae.
We assume that the is approximately located at the outer edge of the Fe-core [40, and for and , respectively: ]. The value of is varied within with steps of 0.1 to better fit the observed abundance patterns. Then we calculate the grids of supernova yields for the range of - with steps of and for - () and 2.0-16.0 () with steps of . These ranges have been chosen so that the is searched approximately in the range between the location of the and the outer boundary of the CO core (see Figure 1). Using this grid of yields, parameter sets (, ) that reproduce the observed [C/Ca] and [C/Mg] ratios in SMSS 0313-6708 are searched. In addition to SMSS 0313-6708, we adopt the same parameter-search method for the four other iron-poor stars with [Fe/H] (see Tominaga et al. [41] for models with other ).
We adopt the observational data analyzed with 3D and/or NLTE corrections (see the captions of Figure 2 and 3 for details) and normalized with the solar abundances of Asplund et al. [2]. For Ca abundances, we use abundances estimated from Ca I lines for the four other iron-poor stars. We should note, however, that there are uncertainties in the Ca abundances for the 3D and NLTE effects [26, 28, e.g.], which affects the normalization of Figure 3. We also consider Ca II abundances when we draw our conclusions.
III. Result
Table 1 summarizes the model parameters (, , ) that best reproduce the observed abundance patterns of the five iron-poor stars. The resultant masses of the central remnant () and ejected masses of 56Ni, which finally decays to 56Fe, are indicated in the last two columns. Since only C, Mg, and Ca have been measured for SMSS 0313-6708, all four models (, , , and ) can equally well fit the observed abundance ratios as indicated in Table 1. For the other four stars, the parameters have been constrained using a larger number of elements and thus only the best-fit models are shown.
III.1. The best-fit models for SMSS 0313-6708
Figure 2 shows the abundance patterns relative to Ca of the best-fit models for (top) and 40 (bottom). In each panel, the models of the supernova (: solid lines with squares) and hypernovae ( and 30 for and 40: solid lines with triangles) are shown with the observed abundances in SMSS 0313-6708 (filled circles and arrows for the upper limits). In the following we describe comparison of each model with the observed abundance pattern.
, , supernova model: The model yield that fits the observed [C/Ca] and [Mg/Ca] ratios are consistent with the upper limits of other elements except for Na and Al. Because the predicted Na and Al abundances vary by more than a few dex depending on overshooting [21] and stellar rotation [29], and on the reaction rate of 12C16O [10, and references therein] in the presupernova models, we restrict our discussion for Na and Al to their relative yields between the supernova and hypernova models.
In our model, the observed large [Mg/Ca] ratio results from the large mixing region () and the small ejected fraction, ; as seen in Figure 1, the material in the layer containing Ca is mostly falls back while the material in the outer layer containing Mg is partly ejected. The abundances of iron-peak elements in the model depend on the adopted . For , the ejected mass of 56Ni is less than for these models, which is extremely small compared to those estimated for nearby supernovae [3, 31, 56Ni: ].
, , hypernova model: The higher explosion energy induces explosive burning at the bottom of the He layer, which leads to an extra production of Mg at as can be seen in the bottom panel of Figure 1. Consequently, a large value of (), which results in a large fallback of Mg synthesized at , best explain the observed [C/Mg] ratio. The [O/Ca] ratio is smaller than that of the supernova model as a result of the associated fallback of oxygen for the given [Mg/Ca] ratio. The [O/Ca] ratio, however, can be as large as depending on and as shown by the dotted gray line in Figure 2.
The [Na/Ca] and [Al/Ca] ratios of the hypernova yields are lower than those predicted by the supernova model. This is due to the more extended explosive O and C burning regions in the more energetic explosion [cross-hatched regions in Figure 1, in which more Na and Al are consumed to synthesize heavier nuclei [30]]. The larger with small also leads to the smaller amount of ejected Na and Al than the supernova model.
The abundance differences between the odd and even atomic number iron-peak elements are smaller for the hypernova model. This results from enhanced production of odd-Z iron-peak elements due to the higher entropy and larger neutron excess in the Si burning region in the more energetic explosion [30, e.g.].
, , supernova model: Compared to the supernova model with , the outer boundary of the Mg-rich layer extends to a larger mass at . Consequently, the models with best-fit the observed [C/Mg] ratio.
, , hypernova model: The hypernova model for the progenitor is characterized by larger [Si/Ca] and [S/Ca] ratios because of more extended explosive O and C-burning region, in which elements such as O and C are consumed to synthesize Si and S. Aluminum is also synthesized in the explosive C burning layer but destroyed in the explosive O burning layer to synthesize Si. In comparison to the supernova model, predicted abundances of V, Mn, Co and Cu relative to Ca are larger, similar to the hypernova model.
| Name | [Fe/H]aafootnotemark: | [C/Ca]aafootnotemark: | [C/Mg]aafootnotemark: | (ini) | (out) | |||||
|---|---|---|---|---|---|---|---|---|---|---|
| (dex) | (dex) | (dex) | () | (erg) | () | () | () | () | ||
| SMSSJ0313-6708 | 4.4 | 1.2 | 25 | 1 | 2.0 | 5.6 | 5.6 | 2.1 | ||
| 25 | 10 | 1.7 | 6.4 | 6.4 | 1.1 | |||||
| 40 | 1 | 2.0 | 12.7 | 12.7 | 3.4 | |||||
| 40 | 30 | 2.5 | 14.3 | 14.3 | 1.9 | |||||
| HE0107-5240 | 2.9 | 2.6 | 25 | 1 | 1.7 | 5.7 | 5.7 | 1.4 | ||
| HE1327-2326 | 3.3 | 1.8 | 25 | 1 | 1.7 | 5.7 | 5.7 | 1.1 | ||
| HE0557-4840 | 1.2 | 1.1 | 25 | 1 | 1.7 | 5.7 | 5.7 | 2.2 | ||
| SDSSJ102915172927 | 40 | 30 | 2.0 | 5.5 | 6.0 | 2.8 |
III.2. Four other iron-poor stars with [Fe/H]
Figure 3 shows the abundance patterns of the best-fit models for four other iron-poor stars with [Fe/H]. We note that the N abundances are not included from the fitting because of their uncertainty in the progenitor models [21]. For the three carbon-enhanced stars (HE 1327-2326, HE 0107-5240, and HE 0557-4840) shown in the top-three panels, the supernova models of with adopting the parameters and best explain the observed abundances (squares). The hypernova models with (triangles) tend to yield higher [Mg/Ca] ratios than the observed values, which is due to the explosive synthesis of Mg at the bottom of the He layer.
The abundance pattern of SDSS J102915172927 with no carbon enhancement is in better agreement with the hypernova yields of and (triangles). This is due to the relatively high [Si/Ca] ratio observed in this star, which is better explained by the larger Si/Ca ratio in the higher explosion energy model. Such an energy dependence can be understood from the comparison of the abundance distributions between the top and bottom panels of Figure 1. In the hypernova model (bottom), the region where the postshock temperature becomes high enough to produce a significant amount of Si extends to larger than in the supernova model (top).
III.3. Comparison of the five most iron-poor stars
Figure 4 summarizes the best-fit parameters () obtained for the five iron-poor stars (star: SMSS 0313-6708, square: HE 1327-2326, pentagon: HE 0107-5240, three-pointed star: HE 0557-4840, and asterisk: SDSS J102915172927). The results for the model and are shown from the top-left to bottom-right panels. The regions where the [C/Ca] and [C/Mg] ratios measured within in SMSS 0313-6708 are realized are shown by orange and green, respectively.
In the parameter space, the [C/Ca] ratio is at maximum when is located at the layer where carbon burning takes place ( in the and model; top panel of Figure 1). At a given , the [C/Ca] is larger for smaller (larger fallback), because Ca synthesized in the inner layer falls back more efficiently for smaller than C synthesized in the outer layer. As a result, the high [C/Ca] ratio (orange in Figure 4) in SMSS 0313-6708 is reproduced with an extensive fallback ().
The [C/Mg] ratio is at maximum when the is located at the outer edge of the Mg-rich ejecta. The ejection of a large amount of C and the fallback of most of the Mg-rich layer lead to the large [C/Mg] ratios. The observed [C/Mg] ratio in SMSS 0313-6708 is close to the maximum for the observed [C/Ca]. Consequently, mixing up to (for ) and (for ) and small are required (green in Figure 4). We note that the gap in the [C/Mg] constraint, which is only seen in the hypernova models, stems from the explosive Mg production in the energetic explosion (Section III.1). The resultant [C/Mg] ratio at the gap is lower than the observed [C/Mg] ratio.
For the three other iron-poor stars showing carbon enhancement, the best-fit value of is as large as that required for SMSS 0313-6707 with . The obtained parameters and remain similar if we take the average of Ca I and Ca II abundances instead of Ca I abundances, which gives 0.2 dex systematically lower [C/Ca] than in Table 1. They also remain similar if only C, Mg, and Ca abundances are taken into account in the fitting. This is because these elements are synthesized in the different layers and dominant in each layer (the thick lines in Figure 1) and thus their abundance ratios are mostly determined by the mixing-fallback.
The abundance pattern of SDSS J102915172927, which does not show carbon enhancement, is best reproduced by the 40 model with and (asterisk in Figure 4). If we use the average of Ca I and Ca II abundances, a model with and best reproduce the observed abundances (gray triangles with the dotted line in the bottom panel of Figure 3).
The differences in masses, energies and the state of mixing-fallback in the fitted models may explain populations with and without carbon enhancement in the Galactic halo stars [34, e.g.]. Analyses based on a larger number of sample are required to examine whether or not the properties of Pop III supernovae/hypernovae can reproduce the abundance patterns and the relative fraction of the C-enhanced and the C-normal metal-poor populations in the Galactic halo.
The gray-filled region in Figure 4 represents the range of the parameters that give the ejected Fe mass less than , which presumably corresponds to faint Pop III supernovae. All three stars showing the C enhancement are located in the faint supernova region.
IV. Discussion
As shown in the previous section, the abundance measurements (C, Mg, and Ca) in SMSS 0313-6707 are reproduced with the Pop III supernova/hypernova yields ( and ), with the model parameters corresponding to faint supernova/hypernova with extensive mixing and prominent fallback. In order to discriminate models with different masses and energies, additional abundance measurements for oxygen as well as iron-peak elements including V, Mn, Co, and Cu are particularly useful.
The ejected mass of 40Ca is only in the faint supernovae/hypernovae models. To be compatible with the observed calcium abundance ([Ca/H]), the supernova ejecta should be diluted with of the primordial gas. In the case of the supernova models with , this is consistent with the suggested relation between the supernova energy versus swept-up gas mass with primordial composition [38], as adopted in Tominaga et al. [40], for the assumed number density of hydrogen cm-3. On the other hand, this relation predicts that the hypernova sweeps up much larger amount of hydrogen ( for cm-3) than the above values. A recent cosmological simulations of the transport of the metals synthesized in a Pop III supernova, however, suggests a wide range of metal abundances in the interstellar gas clouds after an explosion of a Pop III star [35], and thus the hypernova could work as the source of the chemical enrichment for the formation of stars with [Ca/H].
In our model, Ca is produced by hydrostatic/explosive O burning and incomplete Si burning in the Pop III supernova or hypernova with masses or . This is different from the 60 model adopted in Keller et al. [24], where Ca is originated from the hot CNO cycle during the main-sequence phase. Synthesis of Ca in the hot CNO cycle is also seen in the models of Umeda & Nomoto [45]. On the other hand, Ca produced in this mechanism is not seen in the 25 and 40 progenitors analyzed in this paper. The mass fraction of Ca near the bottom of the hydrogen layer in these progenitors is .
In order to clarify which of these nucleosynthesis sites are responsible for the observed Ca, we note a different prediction between the two scenarios. Our models suggest that a certain amount of Fe distributed in the inner region as well as explosively synthesized Ca are ejected as a result of the assumed mixing at . This results in the [Fe/Ca] ratio of - , depending on the . Consequently, our models of the faint supernova/hypernova predict the metallicity distribution function (MDF) to be continuous even below [Fe/H]. On the other hand, the model adopted in Keller et al. [24], in which Ca is produced in the hot-CNO cycle, predicts [Fe/Ca], which is not observed in other extremely iron-poor stars. Because of the distinct Ca production sites, the MDF could be discontinuous in the most metal-poor region. Future photometric and spectroscopic surveys to discover lowest metallicity stars and their MDF provide clues to discriminate these mechanisms.
The models adopted in this work suggest that the faint Pop III supernovae could be the origin of the observed abundance patterns and the variation among the most iron-poor carbon-rich stars. To understand physics of faint Pop III supernovae, multi-dimensional simulations are necessary. A large-scale mixing as suggested for the carbon-enhanced stars are not predicted in the models with Rayleigh-Taylor mixing alone [22]. Instead, a more likely origin of such large-scale mixing-fallback would be the jet-induced supernova/hypernova, where the inner material can be ejected along the jet-axis while a large fraction of the material along the equatorial plain falls back [42].
References
- [1] Aoki, W., Frebel, A., Christlieb, N. et al. 2006, ApJ, 639, 897
- [2] Asplund, M., Grevesse, N., Sauval, A. J., & Scott, P. 2009, ARA&A, 47, 481
- [3] Blinnikov, S., Lundqvist, P., Bartunov, O., et al. 2000, ApJ, 532, 1132
- [4] Bonifacio, P., Caffau, E., Venn, K. A., & Lambert, D. L. 2012, A&A, 544, 102
- [5] Bromm, V., & Larson, R. B. 2004, ARA&A, 42, 79
- [6] Bromm, V., & Yoshida, N. 2011, ARA&A, 49, 373
- [7] Bromm, V., 2013, RPPh, 76k, 2901
- [8] Caffau, E., Bonifacio, P., François, P., et al. 2011, Nature, 477, 67
- [9] Caffau, E., Bonifacio, P., François, P., et al. 2012, A&A, 542, 51
- [10] Chieffi, A., & Limongi, M. 2002, ApJ, 577, 281
- [11] Christlieb, N., Bessell, M. S., Beers, T. C., et al. 2002, Natur, 419, 904
- [12] Christlieb, N., Gustafsson, B., Korn, A., et al. 2004, ApJ, 603, 708
- [13] Clark, P. C., Glover, S. C. O., Klessen, R. S., & Bromm, V. 2011, ApJ, 727, 110
- [14] Collet, R., Asplund, M., & Trampedach, R. 2006, ApJ, 644, L121
- [15] Frebel, A., Aoki, W., Christlieb, N. et al. 2005, Nature, 434, 871
- [16] Frebel, A., Collet, R., Eriksson, K., Christlieb, N., & Aoki, W. 2008, ApJ, 684, 588
- [17] Hansen, T., Hansen, C. J., Christlieb, N., et al. 2014, ApJ, 787, 162
- [18] Heger, A., & Woosley, S. E. 2010, ApJ, 724, 341
- [19] Hirano, S., & Yoshida, N. 2013, ApJ, 763, 52
- [20] Hosokawa, T., Omukai, K., Yoshida, N., & Yorke, H. W., 2011, Science, 334, 1250
- [21] Iwamoto, N., Umeda, H., Tominaga, N., Nomoto, K., & Maeda, K. 2005, Science, 309, 451
- [22] Joggerst, C. C., Woosley, S. E., & Heger, A. 2009, ApJ, 693, 1780
- [23] Keller, S. C., Schmidt, B. P., Bessel, M. S., et al. 2007, Publications of the Astronomical Society of Australia, 25, 1
- [24] Keller, S. C., Bessel, M. S., Frebel, A., et al. 2014, Nature, 506, 463
- [25] Kobayashi, C., Ishigaki, N. M., Tominaga, N., & Nomoto, K., 2014, ApJ, 785, L5
- [26] Korn, A. J., Richard, O., Mashonkina, L., Bessell, M. S., Frebel, A., & Aoki, W. 2009, ApJ, 698, 410
- [27] Limongi, M., Chieffi, A., & Bonifacio, P. 2003, ApJ, 594, L123
- [28] Lind, K., Melendez, J., Asplund, M., Collet, R., & Magic, Z. 2013, A&A, 554, 96
- [29] Meynet, G., Hirschi, R., Ekstrom, S., et al. 2010, A&A, 521
- [30] Nakamura, T., Umeda, H., Iwamoto, K., et al. 2001, ApJ, 555, 880
- [31] Nomoto, K., Kobayashi, C., & Tominaga, N. 2013, ARA&A, 51, 457
- [32] Norris, J. E., Christlieb, N., Korn, A. J., et al. 2007, ApJ, 670, 774
- [33] Norris, J. E., Christlieb, N., Bessell, M. S., Aplund, M., Eriksson, K., & Korn, A. J. 2012, ApJ, 753, 150
- [34] Norris, J. E., Yong, D., Bessell, M. S., et al. 2013, ApJ, 762, 28
- [35] Ritter, J. S., Safranek-Shrader, C., Gnat, O., Milosavljević, & Bromm, V. 2012, ApJ, 761, 56
- [36] Schneider, R., Omukai, K., Limongi, M., et al. 2012, MNRAS, 423, L60
- [37] Susa, H., 2013, ApJ, 773, 185
- [38] Thornton, K., Gaudlitz, M., Janka, T.-TH., & Steinmetz, M. et al. 1998, ApJ, 500, 95
- [39] Tominaga, N., Maeda, K., Umeda, H.,et al. 2007, ApJ, 657, L77
- [40] Tominaga, N., Umeda, H., & Nomoto, K. 2007, ApJ, 660, 516
- [41] Tominaga, N., Iwamoto, N., & Nomoto, K. 2014, ApJ, 785, 98
- [42] Tominaga, N. 2009, ApJ, 690, 526
- [43] Umeda, H., & Nomoto, K. 2002, ApJ, 565, 385
- [44] Umeda, H., & Nomoto, K. 2003, Nature, 422, 871
- [45] Umeda, H., & Nomoto, K. 2005, ApJ, 619, 427
- [46] Woosley, S. E., & Weaver, T. 1995, ApJS, 101, 181