Cost-Effective HITs for Relative Similarity Comparisons
Abstract
Similarity comparisons of the form “Is object a more similar to b than to c?” are useful for computer vision and machine learning applications. Unfortunately, an embedding of points is specified by triplets, making collecting every triplet an expensive task. In noticing this difficulty, other researchers have investigated more intelligent triplet sampling techniques, but they do not study their effectiveness or their potential drawbacks. Although it is important to reduce the number of collected triplets, it is also important to understand how best to display a triplet collection task to a user. In this work we explore an alternative display for collecting triplets and analyze the monetary cost and speed of the display. We propose best practices for creating cost effective human intelligence tasks for collecting triplets. We show that rather than changing the sampling algorithm, simple changes to the crowdsourcing UI can lead to much higher quality embeddings. We also provide a dataset as well as the labels collected from crowd workers.
Introduction
Recently in machine learning [\citeauthoryearTamuz et al.2011, \citeauthoryearJamieson and Nowak2011, \citeauthoryearvan der Maaten and Weinberger2012, \citeauthoryearMcFee2012], there has been a growing interest in collecting human similarity comparisons of the form “Is a more similar to b than to c?” These comparisons are asking humans to provide constraints of the form , where represents some perceptual distance between and . We will refer to these constraints as triplets. By collecting these triplets from humans, researchers can learn the structure of a variety of data sets. For example, the authors of [\citeauthoryearMcFee2012] were able to learn music genres from triplet comparisons alone with no other annotations. Specifically in computer vision, human similarity comparisons are useful for creating perceptually-based embeddings. In [\citeauthoryearAgarwal et al.2007], the authors created a two dimensional embedding where one axis represented the brightness of an object, and the other axis represented the glossiness of an object. In this work we focus on creating perceptual embeddings from images of food.
For any set of points, there are on the order of by unique triplets. Collecting such a large amount of triplets from crowd workers quickly becomes intractable for larger datasets. For this reason, a few research groups have proposed more intelligent sampling techniques [\citeauthoryearTamuz et al.2011, \citeauthoryearJamieson and Nowak2011]. However, the difficulty of collecting a large number of triplets is also related to the time and monetary cost of collecting data from humans. To investigate this relationship more closely, we chose to study a triplet human intelligence task (HIT). In this work we provide a better understanding of how the HIT design affects not only the time and cost of collecting triplets, but also the quality of the embedding, which is usually the researcher’s primary concern.


Traditionally, an MTurk task designed to collect triplets would show crowd workers three images, labeled a, b, c. The worker is then asked to select either image b or image c, whichever looks more similar to image a. See the top of Fig. 1 for an example. Although this is the most direct design to collect triplets, it is potentially inefficient. Instead, we chose to investigate triplets collected from a grid of images. In the grid format, a probe image—analogous to image “a” in the triplet representation—is shown next to a grid of images. The crowd worker is then asked to choose the most similar images from the grid. This layout allows us to collect images that are more similar to the probe image than the remaining images, yielding triplets with one screen to the user. We can change the number of triplets per grid answer by varying and , but this also affects the amount of effort a crowd worker must exert to answer the question. We are not the first to realize that a grid is more efficient for collecting triplets—such techniques were also used by [\citeauthoryearWah et al.2014, \citeauthoryearTamuz et al.2011]—but we believe we are the first to investigate more thoroughly the effectiveness of triplets collected with a grid. This is important because previous authors acknowledge neither the efficiency gain nor the potential drawbacks of the grid triplets they rely on.
This paper outlines several UI modifications that allow researchers to multiply the number of triplets collected per screen for perceptual similarity learning. We show that simple changes to the crowdsourcing UI—instead of fundamental changes to the algorithm — can lead to much higher quality embeddings. In our case, using our grid format allows us to collect several triplet comparisons per screen. This leads to much faster convergence than asking one triplet question at a time. Researchers with tight deadlines can create reasonable embeddings with off-the-shelf algorithms and a low crowdsourcing budget by following our guidelines.
Our contributions are:
- •
A set of guidelines to use when collecting similarity embeddings, with insights on how to manage the trade-off between user burden, embedding quality, and cost;
- •
A series of synthetic and human-powered experiments that prove our methods’ effectiveness;
- •
Evidence that each individual triplet sampled with a grid may capture less information than a uniformly random triplet, but that their quantity outweighs the potential quality decrease;
- •
A dataset of 100 food images, ingredient annotations, and roughly 39% of the triplet comparisons that describe it, to be made available upon publication.
Related Work
Perceptual similarity embeddings are useful for many tasks within the field, such as metric learning [\citeauthoryearFrome et al.2007], image search/exploration [\citeauthoryearFerecatu and Geman2009], learning semantic clusters [\citeauthoryearGomes et al.2011], and finding similar musical genres and artists [\citeauthoryearvan der Maaten and Weinberger2012, \citeauthoryearMcFee2012]. Our work is useful to authors who wish to collect data to create such embeddings. The common idea behind all of this work is that these authors use triplets to collect their embeddings.
In our work, we collect human similarity measurements of images in the form of triplets. The authors of [\citeauthoryearHeikinheimo and Ukkonen2013] proposed an algorithm for collecting triplets from humans as well. However in [\citeauthoryearHeikinheimo and Ukkonen2013], the triplets that were collected did not have a probe image. because they formulated the question differently [\citeauthoryearYi et al.2013] focuses on estimating user preferences from crowd sourced similarity comparisons. However [\citeauthoryearYi et al.2013] uses pairwise comparisons rather than triplets.

Our work bears much similarity to Crowd Kernel Learning [\citeauthoryearTamuz et al.2011] and Active MDS [\citeauthoryearJamieson and Nowak2011]. These algorithms focus on collecting triplets one at a time, but sampling the best triplets first. The idea behind these systems is that the bulk of the information in the embedding can be captured within a very small number of triplets, since most triplets convey redundant information. For instance, Crowd Kernel Learning [\citeauthoryearTamuz et al.2011] considers each triplet individually, modeling the information gain learned from that triplet as a probability distribution over embedding space. Active MDS [\citeauthoryearJamieson and Nowak2011] consider a set of triplets as a partial ranking with respect to each object in the embedding, placing geometric constraints on the locations where each point may lie. In our work we focus on altering UI design to improve speed and quality of triplet collection.
Method
Instead of asking “Is more similar to or ?”, we present humans with a probe image and ask “Mark images that are most similar to the probe,” as in Fig. 1. This way, with a grid of size , a human can generate triplets per task unit. This kind of query allows researchers to collect more triplets with a single screen. It allows crowd workers to avoid having to wait for multiple screens to load, especially in cases where one or more of the images in the queried triplets do not change. This also allows crowd workers to benefit from the parallelism in the low-level human visual system [\citeauthoryearWolfe1994]. Since many of these observations involve human issues, we conclude that the right way of measuring embedding quality is with respect to human cost rather than the number of triplets. This human cost is related to the time it takes crowd workers to complete a task and the pay rate of a completed task. Some authors [\citeauthoryearWah et al.2014, \citeauthoryearTamuz et al.2011] already incorporate these ideas into their work but do not quantify the improvement. Our goal is to formalize their intuitive notions into hard guidelines.
It is important to note that the distribution of grid triplets is not uniformly random, even when the grid entries are selected randomly and even with perfect answers. To our knowledge, no authors that use grids acknowledge this potential bias even though it deteriorates each triplet’s quality, as we will show in our experiments. Figure 3 shows a histogram of how many times each object occurs in our triplet answers. When using grid sampling, some objects can occur far more often than others, suggesting that the quality of certain objects’ placement within the recovered embedding may be better than others. The effect is less pronounced in random triplets, where objects appear with roughly equal frequency. This observation is important to keep in mind because the unequal distribution influences the result.
Synthetic Experiments
We aimed to answer two questions: Are the triplets acquired from a grid of lower quality than triplets acquired one by one? Second, even if grid triplets are lower quality, does their quantity outweigh that effect? To find out, we ran synthetic “Mechanical Turk-like” experiments on synthetic workers. For each question, we show a probe and a grid of objects. The synthetic workers use Euclidean distance within a groundtruth embedding to choose grid choices that are most similar to the probe. As a baseline, we randomly sample triplet comparisons from the groundtruth embedding using the same Euclidean distance metric. After collecting the test triplets,we build a query embedding with t-STE [\citeauthoryearvan der Maaten and Weinberger2012] and compare this embedding to the groundtruth. This way, we can measure the quality of our embedding with respect to the total amount of human effort, which is the number of worker tasks. This is not a perfect proxy for human behavior, but it does let us validate our approach, and should be considered in conjunction with the actual human experiments that are described later.
Datasets. We evaluated our UI paradigm on three datasets. First, we used MNIST1k, a handwritten digit dataset containing 1,000 random digits across 10 classes. To generate groundtruth comparison triplets, we use Euclidean distance between feature vectors. Second, we use the music similarity dataset from [\citeauthoryearvan der Maaten and Weinberger2012] as a point of comparison. This set contains 9,107 human-collected triplets for 412 artists. Finally, we present results on a subset of LFW [\citeauthoryearHuang et al.2008], the Labeled Faces in the Wild dataset. We considered identities that have between 32 and 77 images in the set, using the face attribute vectors extracted by [\citeauthoryearKumar et al.2009]. This leaves us with a total of 938 73-dimensional feature vectors from 20 identities. To generate groundtruth triplets, we again considered Euclidean distance. These three datasets provide us with a healthy balance of synthetic and real-world nonvectorial data.
Metrics. Our goal is not to build a competitive face or written digit recognizer; rather, we simply wish to evaluate the quality of a perceptual embedding constructed with the help of synthetic workers. To do this, we evaluate each embedding’s quality using two metrics from [\citeauthoryearvan der Maaten and Weinberger2012]: Triplet Generalization Error, which counts the fraction of the groundtruth embedding’s triplet constraints that are violated by the recovered embedding; and Leave-One-Out Nearest Neighbor error, which measures the percentage of points that share a category label with their closest neighbor within the recovered embedding. As pointed out by [\citeauthoryearvan der Maaten and Weinberger2012], these metrics measure different things: Triplet Generalization Error measures the triplet generator UI’s ability to generalize to unseen constraints, while NN Leave-One-Out error reveals how well the embedding models the (hidden) human perceptual similarity distance function. We use these metrics to test the impact that different UIs have on embedding quality.
Results. Across all three datasets, our experiments show that even though triplets acquired via the grid converge faster than random triplets, each individual grid triplet is of lower quality than an individual random triplet. Figure 4 shows how the music dataset embedding quality converges with respect to the number of triplets. If triplets are sampled one at a time (top two graphs), random triplets converge much faster on both quality metrics than triplets acquired via grid questions. However, this metric does not reveal the full story because grid triplets can acquire several triplets at once. When viewed with respect to the number of screens (human task units), as in the bottom two graphs in Figure 4, we now see that the grid triplets can converge far faster than random with respect to the total amount of human work. This leads us to conclude that “quality of the embedding wrt. number of triplets” is the wrong metric to optimize because framing the question in terms of triplets gives researchers the wrong idea about how fast their embeddings converge. A researcher who only considers the inferior performance of grid triplets on the “per-triplet” metric will prefer sampling triplets individually, but they could achieve much better accuracy using grid sampling even in spite of the reduced quality of each individual triplet, and as we shall see in our human experiments, this translates into decreased cost for the researcher. In other words, efficient collection UIs are better than random sampling, even though each triplet gathered using such UIs does not contain as much information.
Why does this happen? In all cases, the 12 images within the grid were chosen randomly; intuitively, we expect a uniform distribution of triplets. However, because certain objects are more likely than others to be within each grid’s “Near” set, certain objects will appear in the triplet more often than others. This leads to a nonuniform distribution of correct triplets, as shown in Fig. 3. Here, we can see that the non-uniformity creates a difference in performance.
The other two datasets—MNIST and Face—show very similar results so we do not report them here. In all cases, any size of grid UI outperforms random selection. However, we do see a small spread of quality across different grid sizes. As in the music dataset, the error is lowest when we force our synthetic workers to select 3 close images out of 12 as opposed to selecting the 4, 5, or 6 closest images. This difference is more pronounced in the “Leave-One-Out NN” metric. This could be because selecting the 3 closest images allows the metric to be more precise about that image’s location in the embedding since it is compared to fewer neighbors. Our synthetic workers always give perfect answers; we do not expect imperfect humans to reflect this effect.

Human Experiments
These synthetic experiments validate our approach, but they have several problems. In particular, there is no reason why humans would behave similarly to a proxy oracle as described above. Further, we must also consider the effort of our workers, both in terms of the time it takes to complete each task and how much money they can make per hour—metrics that are impossible to gather via synthetic means. To verify that these approaches build better embeddings even when humans provide inconsistent triplets, we ran Mechanical Turk experiments on a set of 100 food images sourced from Yummly recipes with no groundtruth. The images were filtered so that each image contained roughly one entree. For example, we avoided images of sandwiches with soups. Example images are shown in Fig. 5. For each experiment, we allocated the same amount of money for each hit, allowing us to quantify embedding quality with respect to cost. Upon publication, the dataset as well as the collected triplets will be available for download.
Design. For each task, we show a random probe and a grid of random foods. We ask the user to select the objects that “taste most similar” to the probe. We varied across and varied across . We ran three independent repetitions of each experiment. We paid $0.10 per HIT, which includes 8 usable grid screens and 2 catch trials. To evaluate the quality of the embedding returned by each grid size, we use the same “Triplet Generalization Error” as in our synthetic experiments: we gather all triplets from all grid sizes and construct a reference embedding via t-STE. Then, to evaluate a set of triplets, we construct a target embedding, and count how many of the reference embedding’s constraints are violated by the target embedding. Varying the number of HITs shows how fast the embedding’s quality converges.
Baseline. Since we wish to show that grid triplets produce better-quality embeddings at the same cost as random triplets, we should collect random comparisons from our crowd workers for comparison. Unfortunately, collecting all comparisons one at a time is infeasible (see our “Cost” results below), so instead, we construct a groundtruth embedding from all grid triplets and uniformly sample random constraints from the embedding. This is unlikely to lead to much bias because we were able to collect 39% of the possible unique triplets, meaning that t-STE only has to generalize to constraints that are likely to be redundant. All evaluations are performed relative to this reference embedding.
Results
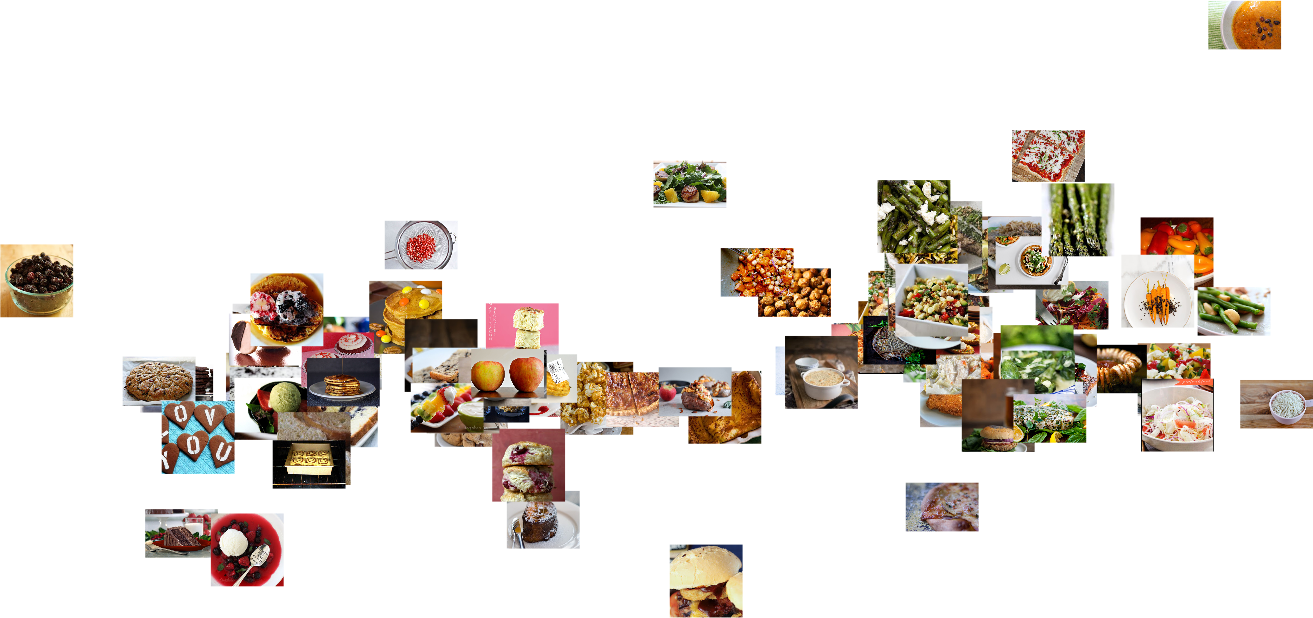
Two example embeddings are shown in Fig. 2.
Cost. Across all experiments, we collected 14,088 grids, yielding 189,519 unique triplets. Collecting this data cost us $158.30, but sampling this many random triplets one at a time would have cost us $2,627.63, which is far outside our budget11 1 There are possible unique triplets and each triplet answer would cost one cent. We additionally need to allocate 10% to Amazon’s cut and 20% of our tasks are devoted to catch trials.. If we had used the 16-choose-4 grid strategy (which yields 48 triplets per grid), we would be able to sample all unique triplets for about $140—a feat that would cost us $6737.50 by sampling one at a time.
| Grid choose | Error at $1 | Time/screen (s) | Wages ($/hr) |
|---|---|---|---|
| : 4, : 1 | 0.468 | 3.57 | $10.09 |
| : 2 | 0.369 | 3.45 | $10.45 |
| : 8, : 1 | 0.400 | 3.04 | $11.85 |
| : 2 | 0.311 | 5.79 | $6.22 |
| : 4 | 0.273 | 7.65 | $4.71 |
| : 12, : 1 | 0.406 | 4.17 | $8.64 |
| : 2 | 0.294 | 6.78 | $5.31 |
| : 4 | 0.235 | 8.67 | $4.15 |
| : 16, : 1 | 0.413 | 6.72 | $5.36 |
| : 2 | 0.278 | 8.84 | $4.07 |
| : 4 | 0.231 | 9.59 | $3.76 |
| Random | 0.477 | – | – |
| CKL | 0.403 | – | – |
Quality. As we spend more money, we collect more triplets, allowing t-STE to do a better job generalizing to unseen redundant constraints. All embeddings converge to lower error when given more triplets, but this convergence is not monotonic because humans are fallible and there is randomness in the embedding construction. See Fig. 7 for a graphical comparison of grids with size 4,8,12, and 16. When viewed with respect to the number of triplets, random triplets again come out ahead; but when viewed with respect to cost, the largest grid converges more quickly than others, and even the smallest grid handily outperforms random triplet sampling.
This time, we observe a large separation between the performance of various grid sizes. Grid 16-choose-4, which yields triplets per answer, uniformly outperforms the rest, with Grid 12-choose-4 (at triplets per answer) close behind. Both of these outperform 8-choose-4 (16 triplets/answer) and 4-choose-2 (4 triplets/answer).
We also compare our performance with the adaptive triplet sampling strategy of [\citeauthoryearTamuz et al.2011]. CKL picks triplets one-at-a-time but attempts to select the best triplet possible to ask by maximizing the information gain from each answer. In our experiments, it did not outperform random sampling; further analysis will be future work.
Though catch trials comprised 20% of the grid answers we collected, we found that the results were generally of such high quality that no filtering or qualification was required.
Time. Fig. 6 shows how fast each human takes to answer one grid question. Our smallest task was completed in 3.5 seconds ( ), but even our largest grid (16 choose 4) can be completed in less than 10 seconds. Times varies widely between workers: our fastest worker answered 800 questions in an average of 2.1 seconds per grid task for 8-choose-1 grids.
Worker Satisfaction. At our standard 1-per-grid/$0.10-per-HIT rate, our workers are able to make a respectable income, shown in Tab. 1. The smallest tasks net more than $10/hour by median, but even our largest task allows half of our workers to make $3.76 for every hour they spend. If the fastest, most skilled worker sustained their average pace in 8-choose-1 grids, they could earn over $17 per hour.
Since there is a trade-off between grid size and worker income, it is important to consider just how far we can push our workers without stepping over the acceptable boundaries. Across all of our experiments, we received no complaints, and our tasks were featured on multiple HIT aggregators including Reddit’s HitsWorthTurkingFor subreddit and the “TurkerNation” forums as examples of bountiful HITs. Our workers did not feel exploited.
According to the HitsWorthTurkingFor FAQ 22 2 http://reddit.com/r/HITsWorthTurkingFor/wiki/index, “the general rule of thumb …is a minimum of $6/hour.” Though HITs below this amount may be completed, the best workers may pass for more lucrative HITs. Being featured in forums such as HitsWorthTurkingFor gave us an advantage since our hit was visible to a very large audience of potential skilled turkers. Though high payouts mean higher cost, in our case, the benefit outweighed the drawback.
Guidelines and conclusion
Throughout this paper, we have shown that taking advantage of simple batch UI tricks can save researchers significant amounts of money when gathering crowdsourced perceptual similarity data. Our recommendations can be summarized as follows:
- •
Rather than collecting comparisons one-at-a-time, researchers should use a grid to sample comparisons in batch, or should use some other UI paradigm appropriate to their task. However, researchers should not assume that such “batch” comparisons are of identical quality to uniformly random sampling—this is a trade-off that should be considered.
- •
If cost is an issue, researchers should quantify their results with respect to dollars spent. We found that using our simple UI paradigm can creates embeddings of higher quality than those created using algorithms that pick the best triplet one-at-a-time.
- •
Researchers should continuously monitor the human effort of their tasks, so that they can calculate an appropriate target wage and stand a better chance of being featured on “Good HIT” lists and be seen by more skilled Turkers.
- •
When using grids to collect triplets, researchers should consider the trade-off between size and effort. Consider that an -choose- grid can yield
(1) triplets per answer. Since this has a global maximum at , one appropriate strategy is to select the largest that yields a wage of $6/hour and set equal to .
There are several opportunities for future work. First, we should better quantify the relationship between , , and task completion time to build a more accurate model of human performance. Second, we should continue investigating triplet sampling algorithms such as “CKL” as there may be opportunities to adaptively select grids to converge faster than random, giving us advantages of both strategies.
Acknowledgments
We especially thank Jan Jakeš, Tomas Matera, and Edward Cheng for their software tools that helped us collect grid triplets so quickly. We also thank Vicente Malave for helpful discussions. This work was partially supported by an NSF Graduate Research Fellowship award (NSF DGE-1144153, Author 1) and a Google Focused Research award (Author 3).
References
- [\citeauthoryearAgarwal et al.2007] Agarwal, S.; Wills, J.; Cayton, L.; Lanckriet, G.; Kriegman, D. J.; and Belongie, S. 2007. Generalized non-metric multidimensional scaling. In International Conference on Artificial Intelligence and Statistics.
- [\citeauthoryearFerecatu and Geman2009] Ferecatu, M., and Geman, D. 2009. A statistical framework for image category search from a mental picture. IEEE TPAMI.
- [\citeauthoryearFrome et al.2007] Frome, A.; Singer, Y.; Sha, F.; and Malik, J. 2007. Learning globally-consistent local distance functions for shape-based image retrieval and classification. In IEEE ICCV.
- [\citeauthoryearGomes et al.2011] Gomes, R.; Welinder, P.; Krause, A.; and Perona, P. 2011. Crowdclustering. NIPS.
- [\citeauthoryearHeikinheimo and Ukkonen2013] Heikinheimo, H., and Ukkonen, A. 2013. The crowd-median algorithm. In First AAAI Conference on Human Computation and Crowdsourcing.
- [\citeauthoryearHuang et al.2008] Huang, G. B.; Mattar, M.; Berg, T.; and Learned-Miller, E. 2008. Labeled faces in the wild: A database forstudying face recognition in unconstrained environments. In Workshop on Faces in’Real-Life’Images: Detection, Alignment, and Recognition.
- [\citeauthoryearJamieson and Nowak2011] Jamieson, K., and Nowak, R. 2011. Low-dimensional embedding using adaptively selected ordinal data. In Allerton Conference on Communication, Control, and Computing.
- [\citeauthoryearKumar et al.2009] Kumar, N.; Berg, A. C.; Belhumeur, P. N.; and Nayar, S. K. 2009. Attribute and simile classifiers for face verification. In IEEE ICCV.
- [\citeauthoryearMcFee2012] McFee, B. 2012. More like this: machine learning approaches to music similarity. Ph.D. Dissertation, University of California, San Diego.
- [\citeauthoryearTamuz et al.2011] Tamuz, O.; Liu, C.; Belongie, S.; Shamir, O.; and Kalai, A. T. 2011. Adaptively learning the crowd kernel. In ICML.
- [\citeauthoryearvan der Maaten and Weinberger2012] van der Maaten, L., and Weinberger, K. 2012. Stochastic triplet embedding. In IEEE MLSP.
- [\citeauthoryearWah et al.2014] Wah, C.; Horn, G. V.; Branson, S.; Maji, S.; Perona, P.; and Belongie, S. 2014. Similarity comparisons for interactive fine-grained categorization. In IEEE CVPR.
- [\citeauthoryearWolfe1994] Wolfe, J. M. 1994. Guided search 2.0 a revised model of visual search. Psychonomic Bulletin & Review 1.
- [\citeauthoryearYi et al.2013] Yi, J.; Jin, R.; Jain, S.; and Jain, A. 2013. Inferring users’ preferences from crowdsourced pairwise comparisons: A matrix completion approach. In HCOMP.