Plectoneme tip bubbles: Coupled denaturation and writhing in supercoiled DNA
Abstract
Biological information is not only stored in the digital chemical sequence of double helical DNA, but is also encoded in the mechanical properties of the DNA strands, which can influence biochemical processes involving its readout [1]. For example, loop formation in the Lac operon [2] can regulate the expression of key genes, and DNA supercoiling is closely correlated to rhythmic circardian gene expression in cyanobacteria [3]. Supercoiling is also important for large scale organisation of the genome in both eukaryotic and prokaryotic cells. DNA can respond to torsional stress by writhing to form looped structures called plectonemes, thus transferring energy stored as twist into energy stored in bending. Denaturation bubbles can also relax torsional stress, with the enthalpic cost of breaking bonds being compensated by their ability to absorb undertwist. Here we predict a novel regime where bubbles form at the tips of plectonemes, and study its properties using coarse-grained simulations. These tip bubbles can occur for both positive and negative supercoiling and greatly reduce plectoneme diffusion by a pinning mechanism. They can cause plectonemes to preferentially localise to AT rich regions, because bubbles more easily form there. The tip-bubble regime occurs for supercoiling densities and forces that are typically encountered for DNA in vivo, and may be exploited for biological control of genomic processes.
Much remains to be understood about the physical mechanisms by which DNA supercoiling affects cellular control in biology. For this reason, the rich mechanical properties of DNA have been intensively studied by single-molecule techniques such as as magnetic and optical tweezers [4, 5, 6, 7, 8, 9, 10, 11, 12, 13], and by various theoretical techniques ranging from continuum models of DNA to atomistic simulations [14, 15, 16, 17, 18, 9, 19, 28, 20] (see also Section IX of the Supplementary Material).


Here we study the interplay between plectonemes and bubbles by employing a recently developed model, oxDNA [21, 22], that treats nucleotides as rigid bodies possessing three interaction sites that mediate short-ranged backbone, stacking, excluded volume and hydrogen bonding interactions. This resolution allows us, in contrast to standard continuum models, to study the effect of strand denaturations on the behaviour of supercoiled DNA. The model is simple enough to explore the time and length scales relevant to the formation and dynamics of plectonemes, something currently beyond the purview of atomistic simulations. OxDNA has successfully captured a range of systems where base pairs break and form, including nanotechnological devices [23], as well as biophysical processes such as overstretching [24] and cruciform formation [25], suggesting it is well suited for studying the interplay between writhing and denaturation in supercoiled DNA.
To begin, we test our model by calculating canonical “hat-curves” for the strand extension over a range of torsions and forces similar to those used in single molecule assays [4, 5, 6, 7, 8, 9, 10, 11, 12, 13] and found in vivo. Torsion is quantified using the length-independent superhelical density , defined such that for one full positive (negative) imposed turn per pitch length. We studied a strand of length 600 base-pairs (bp) using an “average-base” parameterisation that treats each base-pair as having the same strength, allowing us to focus on generic DNA behaviour [21]. Simulations are for one salt concentration, mM NaCl, and further details are described in Methods. Fig. 1a shows that, at a fixed force, and for increasing positive , the extension (here normalised by maximum extension ) does not change appreciably until at which point a buckling transition occurs to a writhed plectonemic structure. For the overall length of the strand decreases linearly for increasing because the extra writhe is stored in the growing plectoneme. For pN DNA strand extension is symmetric for . But for pN increasing negative supercoiling causes the formation of bubbles that absorb the twist, leading to little or no shortening of the strand. In all simulations, we observed at most one plectoneme, as is expected at high salt concentration and short strand length [11, 16]. We show in Supplementary Section II that good agreement can be achieved with single-molecule experiments [8, 12, 13], both for the hat curves and for direct torque response curves [10]. This agreement strengthens our confidence in the ability of oxDNA to predict behaviour for DNA under torsion and tension.
Here we address the unresolved question of how the system transitions between the plectoneme-dominated and bubble-dominated regimes. Instead of a simple competition between spatially separated bubbles and plectonemes, we observe a “tip-bubble” regime where states with a co-localised bubble/plectoneme pair are dominant. This novel regime can be seen in the population diagram Fig. 1b, and in our overall schematic state-diagram shown in Fig. 1c. We now explore these tip-bubble states in more detail.
At the plectoneme tip the DNA must bend back on itself relatively sharply. At low forces this is achieved by a homogeneously bent loop. However, as recognised in studies on DNA bending [26], when the curvature becomes too large an alternative is for the bending to be localized at a kink defect where typically a few base pairs are broken. Similarly, as the force is increased and the plectoneme becomes more tightly wound, a transition to a tip-bubble state can occur, as illustrated in Fig. 1d. Importantly, the sharper bending at the kink allows the same amount of writhe to be achieved by a smaller plectoneme, and thus the tip-bubble state is stabilized by an increase in the extension along the force. Additionally, for negative supercoiling the tip bubble is also able to absorb some of the negative twist, allowing the plectoneme to shrink further. The latter is the reason why, although tip bubble formation is seen for positive and negative supercoiling (Fig. 1c) the transition occurs at a significantly higher force for positive .
For negative supercoiling, larger bubbles absorb additional twist, allowing plectonemes to shrink further. However, small kinks are stable against bubble growth at forces around 1-1.5 pN, as shown in Fig. 1e, because larger bubbles cause a smaller contraction in plectoneme size per base pair disrupted than the initial kink. At large enough forces, the tip bubble does grow, eventually eliminating the plectoneme.
Fig. 1f shows a free-energy landscape in the vicinity of the transition from the tip-bubble regime to the bubble dominated regime. The landscape is relatively flat along the diagonal, showing that plectoneme size and bubble size can be easily interchanged, and that states with both bubbles and plectonemes of intermediate size are common. It is instructive to compare this scenario to what might be expected if bubbles and plectonemes did not co-localise. The free-energy landscape would then be bi-stable, with plectoneme and bubble states separated by a substantial free-energy barrier due to the significant nucleation costs of both. Here, instead, each state helps lower the nucleation cost of the other; namely, bubble growth occurs from the plectoneme tip, and the enhanced flexibility of a bubble allows the DNA to more easily writhe (Fig. 1g). Compared to separate bubbles and plectonemes, co-localisation thus leads to enhanced fluctuations in the extension (see inset of Fig. 1b) over a broader range of force. It is interesting to note that in the experiments of Refs. 12, 13 fluctuations were observed over a significantly wider range of force than was expected from their simple theory (see also Supplementary Sec. III).
Fig. 1h shows kymographs for the diffusion of the plectonemes. The upper panel is in a regime where tip bubbles form about 34% of the time. When there is no tip bubble, the plectoneme diffuses by a strand-slithering mechanism where the strand reptates through the fluctuating plectonemic structure. However, when there is a tip bubble, the plectonemes are effectively pinned because their diffusion requires the coupled motion of the plectoneme and the writhed bubble at its tip. For example, the plectoneme formed by positive supercoiling in the lower panel of Fig. 1h nearly always has a tip bubble, and so is effectively pinned.
To further quantify the dynamics of these plectonemes we calculated their diffusion coefficients (see also Supplementary Section VI). Fig. 2a shows diffusion coefficients for positive supercoiling. It is generally expected that plectoneme diffusion will slow down with increasing tension [27], an effect we observe by plotting the diffusion coefficient only for configurations with no tip bubble. However, the full diffusion coefficient exhibits a marked further decrease as the fraction of time that the system is pinned increases. Fig. 2b shows that the additional slow-down reflects the unpinned fraction.
A similar slowing down of plectoneme diffusion with increasing force for positive supercoiling was observed in the pioneering experiments of Ref. 11. Here we provide a microscopic mechanism for part of this rapid slowing of the diffusion, namely the creation of tip bubbles with increasing force. A further discussion of the comparison of our (much smaller) system to the experiments of Ref. 11 can be found in the Supplementary Section VI.
Bubble formation is known to be highly sequence dependent [28, 29]. To study how sequence affects the tip-bubble regime we performed additional simulations at and pN using a sequence-dependent parametrization of oxDNA for a fully random sequence with a GC content of 49, and a block-random sequence of the form 5’-SWSWS-3’, where S and W are 120 bp stretches with a GC content of approximately 70 and 30 respectively, and an overall average GC content of (sequences are given in Supplementary Section VIII). We first note that for these parameters, tip bubble prevalence is for the randomised sequence and for the block-random sequence (in contrast to for the average-base model), even though each has nearly the same number of GC as AT base pairs. These differences are unsurprising, as bubbles can form more easily in weaker AT-rich regions. This sequence dependence carries over into the hat-curves for negative ; for example, the random sequence deviates from the symmetry at lower forces than the average-base model does (see Supplementary Section VIII).
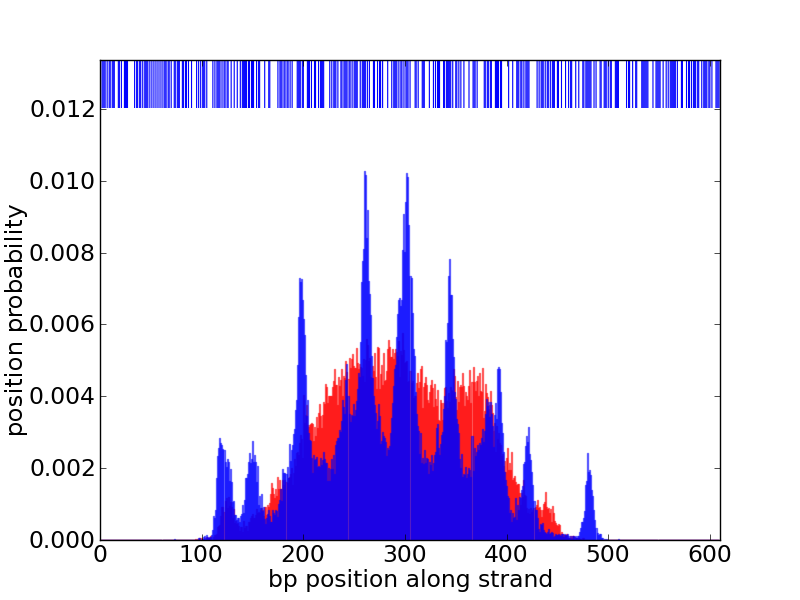
We show the distribution of plectoneme locations for the random and block-random sequences in Fig. 2c. Both sequences show (in contrast to the average-base model - see Supplementary Section VIII) strong preferential localisation of the plectonemes within AT-rich regions of the strand. Denaturations in tip-bubble plectonemes possess an average AT-content of and for the random and block-random sequence. Hence, local sequence properties can both influence the large-scale structure of DNA and stabilize denaturations in weak sequences by guiding plectoneme position. As relevant forces and torsions lie within the regime thought to be relevant for DNA in vivo [1], we speculate that plectoneme localisation can be used by the cell to regulate access to weak parts of the sequence, which are known to be important in several key biological processes including transcription and replication [29].
Methods
We performed dynamical simulations of oxDNA, using an Andersen-like thermostat described in Ref. 30 at K. Trajectories were generated using a time step of 12.1 fs, and production runs were started from pre-thermalized configurations and run for time steps. We studied DNA molecules of length 600 bp, subject to torsional stress, quantified using the length-independent superhelical density to facilitate comparison with different strand lengths .
Torsionally relaxed states were chosen by demanding vanishing torque on unwound molecules, .
During simulation runs, was fixed to values in the range by trapping the strand ends.
A stretching force with pN pN was applied to the molecule ends. Further details of the set-up, boundary conditions, and simulation techniques are described in Supplementary Section I.
Plectoneme structures were detected using an algorithm that compares the spatial distance between parts of the double strand to their proximity along the strand, allowing plectoneme position and size to be measured (see Supplementary Section IV).
To study the effect of strand length on our results, we also performed simulations of 1500-bp strands, which are described in more detail in Supplementary Section III.
For these simulations, we used a GPU version of the oxDNA code.
Acknowledgements
The authors are grateful to the Engineering and Physical Sciences Research Council. C.M. acknowledges financial and material support from German Academic Exchange Service (DAAD) and Studienstiftung des deutschen Volkes. T.E.O. acknowledges funding from University College, Oxford.
References
- [1] X. Wang, P. M. Llopis, and D. Z. Rudner, Nat. Rev. Genet. 14, 191 (2013).
- [2] Y. Zhang, A. E. McEwen, D. M. Crothers, and S. D. Levene, PLoS One 1, e136 (2006).
- [3] V. Vijayan, R. Zuzow, and E. K. O’Shea, Proc. Natl. Acad. Sci. USA 106, 22564 (2009).
- [4] T. R. Strick, J. F. Allemand, D. Bensimon, A. Bensimon, and V. Croquette, Science 271, 1835 (1996).
- [5] S. Forth, C. Deufel, M. Y. Sheinin, B. Daniels, J. P. Sethna, and M. D. Wang, Phys. Rev. Lett. 100, 148301 (2008).
- [6] A. N. Kapanidis and T. R. Strick, Trends Biochem. Sci. 34, 234 (2009).
- [7] F. Mosconi, J. F. Allemand, D. Bensimon, and V. Croquette, Phys. Rev. Lett. 102, 078301 (2009).
- [8] H. Brutzer, N. Luzzietti, D. Klaue, and R. Seidel, Biophys. J. 98, 1267 (2010).
- [9] R. Schöpflin, H. Brutzer, O. Müller, R. Seidel, and G. Wedemann, Biophys. J. 103, 323 (2012).
- [10] X. J. A. Janssen, J. Lipfert, T. Jager, R. Daudey, J. Beekman, and N. H. Dekker, Nano Lett. 12, 3634 (2012).
- [11] M. T. J. van Loenhout, M. V. de Grunt, and C. Dekker, Science 338, 94 (2012).
- [12] D. Salerno, A. Tempestini, I. Mai, D. Brogioli, R. Ziano, V. Cassina, and F. Mantegazza, Phys. Rev. Lett. 109, 118303 (2012).
- [13] A. Tempestini, V. Cassina, D. Brogioli, R. Ziano, S. Erba, R. Giovannoni, M. G. Cerrito, D. Salerno, and F. Mantegazza, Nucleic Acids Res. 41, 2009 (2013).
- [14] J. F. Marko and S. Neukirch, Phys. Rev. E 85, 011908 (2012).
- [15] B. C. Daniels and J. P. Sethna, Phys. Rev. E 83, 041924 (2011).
- [16] M. Emanuel, G. Lanzani, and H. Schiessel, Phys. Rev. E 88, 022706 (2013).
- [17] K. V. Klenin, A. V. Vologodskii, V. V. Anshelevich, A. M. Dykhne, and M. D. Frank-Kamenetskii, J. Mol. Biol. 217, 413 (1991).
- [18] A. V. Vologodskii, S. D. Levene, K. V. Klenin, M. Frank-Kamenetskii, and N. R. Cozzarelli, J. Mol. Biol. 227, 1224 (1992).
- [19] J. S. Mitchell, C. A. Laughton, and S. A. Harris, Nucleic Acids Res. 39, 3928 (2011).
- [20] S. P. Mielke, N. Grønbech-Jensen, V. V. Krishnan, W. H. Fink, and C. J. Benham, J. Chem. Phys. 123, 124911 (2005).
- [21] T. E. Ouldridge, A. A. Louis, and J. P. K. Doye, J. Chem. Phys. 134, 085101 (2011).
- [22] P. Šulc, F. Romano, T. E. Ouldridge, L. Rovigatti, J. P. K. Doye, and A. A. Louis, J. Chem. Phys. 137, 135101 (2012).
- [23] J. P. K. Doye, T. E. Ouldridge, A. A. Louis, F. Romano, P. Šulc, C. Matek, B. E. Snodin, L. Rovigatti, J. S. Schreck, R. M. Harrison, et al., Phys. Chem. Chem. Phys. 15, 20395 (2013).
- [24] F. Romano, D. Chakraborty, J. P. K. Doye, T. E. Ouldridge, and A. A. Louis, J. Chem. Phys. 138, 085101 (2013).
- [25] C. Matek, T. E. Ouldridge, A. Levy, J. P. K. Doye, and A. A. Louis, J. Phys. Chem. B 116, 11616 (2012).
- [26] A. Vologodskii and M. D. Frank-Kamenetskii, Nucleic Acids Res. 41, 6785 (2013).
- [27] P. G. de Gennes, Macromolecules 17, 703 (1984).
- [28] R. M. Fye and C. J. Benham, Phys. Rev. E 59, 3408 (1999).
- [29] B. Alberts, A. Johnson, P. Walter, J. Lewis, M. Raff, K. Roberts, and N. Orme, Molecular Biology of the Cell. (Taylor & Francis, 2007), 5th ed.
- [30] J. Russo, P. Tartaglia, and F. Sciortino, J. Chem. Phys. 131, 014504 (2009).
- [31] J. T. Padding and A. A. Louis, Phys. Rev. E 74, 031402 (2006).
- [32] A. A. Louis, Faraday Discuss. 133, 323 (2010).
- [33] T. Murtola, A. Bunker, I. Vattulainen, M. Deserno, and M. Karttunen, Phys. Chem. Chem. Phys. 11, 1869 (2009).
- [34] T. E. Ouldridge, P. Šulc, F. Romano, J. P. K. Doye, and A. A. Louis, Nucleic Acids Res. 41, 8886 (2013).
- [35] G. Călugăreanu, Rev. Roum. Math. Pures et Appl. 4, 5 (1959).
- [36] J. H. White, Am. J. Math. 91, 693 (1969).
- [37] F. B. Fuller, Proc. Natl. Acad. Sci. USA 68, 815 (1971).
- [38] C. Maffeo, R. Schöpflin, H. Brutzer, R. Stehr, A. Aksimentiev, G. Wedemann, and R. Seidel, Phys. Rev. Lett. 105, 158101 (2010).
- [39] S. Neukirch and J. F. Marko, Phys. Rev. Lett. 106, 138104 (2011).
- [40] J. D. Moroz and P. Nelson, Proc. Natl. Acad. Sci. USA 94, 14418 (1997).
- [41] R. D. Hills, L. Lu, and G. A. Voth, PLoS Comput. Biol. 6, e1000827 (2010).
- [42] J. F. Marko and E. D. Siggia, Science 265, 506 (1994).
- [43] J. F. Marko and S. Neukirch, Phys. Rev. E 88, 062722 (2013).
- [44] C. J. Benham, J. Mol. Biol. 225, 835 (1992).
- [45] W. R. Bauer and C. J. Benham, J. Mol. Biol. 234, 1184 (1993).
- [46] E. M. Strawbridge, G. Benson, Y. Gelfand, and C. J. Benham, Curr. Genet. 56, 321 (2010).
- [47] J.-H. Jeon, J. Adamcik, G. Dietler, and R. Metzler, Phys. Rev. Lett. 105, 208101 (2010).
- [48] G. L. Randall, L. Zechiedrich, and B. M. Pettitt, Nucleic Acids Res. 37, 5568 (2009).
- [49] S. Kannan and M. Zacharias, Phys. Chem. Chem. Phys. 11, 10589 (2009).
- [50] S. A. Harris, Phil. Trans. A 364, 3319 (2006).
- [51] T. B. Liverpool, S. A. Harris, and C. A. Laughton, Phys. Rev. Lett. 100, 238103 (2008).
Supplementary Material
I Simulation methods and boundary conditions
Simulation algorithm
As oxDNA is an implicit solvent model, it is inappropriate to directly integrate the equations of motion resulting from its interaction potentials, which would lead to ballistic particle motion.
Instead, we used the Andersen-like thermostat that is described in more detail in Ref. 30. It propagates the system for a set number of time steps according to Newton’s equations, using the common Verlet integrator with a time step of 12.2 fs.
Linear and angular velocities in the system are then assigned new values drawn from a Maxwell-Boltzmann distribution at K with probabilities and .
For all simulations performed for this work, we chose , and .
The time-scales reported in this paper were set by mass, energy and length scales used in the integrator.
However, making direct comparisons of time-scales between coarse-grained simulations and experiments is complex, see for example the discussions in Refs. 31, 32, 33, and in Supplementary Sec. VI, where we discuss diffusion.
Similar simulations settings have been successfully used in other applications of oxDNA (see e.g. Refs. 24, 34, 23).
Boundary conditions
In this work, we study the response of DNA to superhelical stress. A common measure of superhelical stress is the linking number , a topological quantity which equals the number of times the single strands wrap around each other. In topologically constrained systems, decomposes according to the Fuller-White-Călugăreanu relation [35, 36, 37], where is the number of single-strand crossings, and the number of self-crossings of the double strand axis of the system. To facilitate comparison to systems of different strand length, we quantify torsion using the length independent superhelical density defined as , where is the number of single-strand crossings in a torsionally relaxed, linear double strand.
To impose superhelical stress in a simulation, we constrain the ends of a double strand, and disallow passing of the double strand across the strand ends. Similar constraining boundary conditions have been successfully used before in simulations of cruciform extrusion [25]. A schematic overview of the boundary conditions applied is shown in Fig. S1.
Fixation is implemented by adding five boundary base pairs to the strand ends, which are trapped in harmonic potentials. These potentials acting on the -th trapped nucleotide have the form
| (1) |
where is the centre-of-mass position of the -th trapped nucleotide and the corresponding trap position is , chosen initially such as to fix a given twist angle of the strand. To keep the overall twist angle on the system fixed, but ensure free extensibility of the strand along the setup axis , we choose N/m and . The traps defined in this way only constrain the end nucleotides in a co-moving 2-dimensional plane perpendicular to the strand setup axis, while not hindering the strand in the direction. High trap stiffness in that plane ensures that fluctuations of the linking number in the course of a simulation are negligible.
Strands have finite lengths, which means that more distant parts of the system can pass around the strand ends. Such a process would change the linking number and thus the superhelical density of the system. We therefore prevent this process by introducing repulsion planes oriented perpendicular to the setup axis which co-move with the first boundary nucleotide of the two single strands in the system. Repulsion planes generate a potential
| (2) |
where r is the centre-of-mass position of an affected particle, R and are anchor point and orientation of the plane, and is the Heaviside step function. We choose and for the lower and upper repulsion planes respectively, and set R to the instantaneous positions of the the first and last double strand boundary base pair. To avoid hindering free strand extensibility in the direction, the repulsion planes do not interact with the next-to-last boundary base pairs at both strand ends. In all simulations, we chose pN/nm, which prevented the duplex from passing over its ends.
Microscopic determination of base-pair breaking
In several sections of this work, we determine if a given base pair is formed or broken.
As in previous applications of oxDNA [21, 22], a base-pair was counted as formed if the energy contribution from hydrogen-bonding was below J, corresponding to approximately of the typical energy of a fully formed hydrogen bond.
Sequences and symmetry of hydrogen bonding
The double strands studied in this work possess fully complementary sequences. Hydrogen bonding was only permitted between each nucleotide and its direct counterpart on the other single strand, excluding shifted bonds as shown in Fig. S2. This restriction was imposed to avoid non-generic secondary structure effects, and increase simulation efficiency. It has been successfully used before for other studies with oxDNA [25, 34, 24, 23]. The sequences used within the sequence-dependent parametrization are given in Supplementary Sec. VIII.
II Comparison of mechanical behaviour to experimental data
The mechanical behaviour we observe can be compared directly to experimental data from single molecule assays. Most available data has been obtained using magnetic [4, 8, 10, 7] or optical tweezers [5], which can measure the end-to-end extension and torque response of a single DNA molecule. Available datasets differ in molecule length , ionic strength of the buffer, and sequences properties of the DNA strands used in the respective experiments.
Here, we relate our results to experimental findings and explain the influence of different parameters on the quality of agreement. We note that oxDNA is limited to an ionic strength of mM, as the effective potentials of the model were parametrized at that salt concentration. Furthermore, for reasons of computational efficiency, we simulated double strands of length bp, for which equilibrium data for end-to-end extension can be obtained within about two weeks of runtime on a current CPU. This is shorter than the strand lengths typically used in experiment, which will affect the comparison of results.
In order to facilitate comparison to experimental data, we report our results in terms of the relative strand extension and the superhelical density , which are length-independent up to finite-size corrections vanishing in the long-strand limit [14]. Some uncertainty exists about the relaxed length , because in typical experimental assays, measurements of end-to-end distance take place on molecules which are attached to a cover slip and a bead via chemically functionalized ends. Attachment may slightly modify the effective free length of the double strand. The simulated system only uses a very short piece of strand to constrain the duplex ends (see Supplementary Sec. I) and therefore does not include these chemical attachment effects. Uncertainty about the effective free length of attachment may therefore introduce small systematic differences when comparing experiments to our simulations, especially when measuring the absolute length . By contrast, experimental measurements of the buckling superhelical densities and postbuckling slopes should be largely unaffected by the length of attachment, and may therefore be easier to compare with our simulations.
The buckling superhelical density is determined primarily by the values of bending persistence length and twist persistence length [8], which in oxDNA take the values nm and nm respectively [21]. As these values lie in the range of values reported for DNA [7], oxDNA might be expected to reproduce experimental values for . Differences with experiment may simply stem from small differences in the value of these constants, and would occur for any elastic model using these values for and .
The post-buckling slopes are thought to mainly depend on the radius of the plectoneme stem, which is set by the physics of twisting and bending, as well as by screened electrostatic interactions between the double strands [38, 39]. Good agreement of post-buckling slopes may thus be an indication for the consistency of oxDNA’s treatment of strongly screened electrostatics by excluded volume interactions.
In addition to reproducing elastic properties of the double strand, oxDNA provides a good representation of the melting curves of DNA, as well as several other systems where breaking of base pairs plays a role [21, 24, 23]. This gives us confidence to apply the model to study plectonemes, in which both effects of strand elasticity and double strand denaturation might be expected to be relevant.
All simulation results presented in this section were obtained using the average-base parametrization of oxDNA.
Details of the mechanical response of DNA to imposed twist may however depend on the specific sequence used.
In particular, the precise value of the crossover force between bubbles and plectonemic structures might be expected to depend on sequence properties of the DNA strand, as the enthalpic cost of bubble formation decreases with increasing AT content.
Therefore, AT-rich stretches represent preferred nucleation sites for denaturation bubbles, which can facilitate denaturation and therefore decrease .
The effect of different sequences is described in more detail in Supplementary Sec. VIII.
Molecular extension “hat curves”
Measurements of strand extension as a function of applied force and superhelical density are very reproducible, and have been measured in many setups for different ambient conditions [8, 7, 13, 12, 4, 10]. Here, we compare to a set of experiments performed at conditions close to those used in the parametrization of oxDNA. Our strand extension results are plotted together with experimental data in Figs. S3 - S5.
Fig. S3 shows a comparison to experimental data of Tempestini et al. [13] on a stand of length 7 kbp, with an effective free length of kbp. This effective length is inferred from the length of the attachment described in Ref. 13. The salt concentration used in these experiments is mM, the value at which oxDNA was parametrized. Post-buckling slopes are in good agreement with simulation data, whereas buckling occurs at slightly lower experimental superhelical density . This may be due to additive finite-size corrections predicted in continuum models of the buckling transition [14].
Fig. S4 shows a comparison to data by Salerno et al. [12], obtained at kbp and a lower salt concentration mM. Lower salt is expected to destabilize plectonemes and make bubbles more favourable, as electrostatic interactions of the backbone are less screened. In particular, this effect is expected to become more significant for , as has been shown experimentally [13]. Comparing to simulation results, we still observe good agreement in the post-buckling slopes for all forces when . In contrast, the crossover to the extended bubble state for happens at higher forces for oxDNA. That the force is higher is expected because of the difference in the salt concentration between simulation and experiment. Although appropriate hat curves are unavailable at higher salt for , data on the fluctuation of end-to-end lengths from Ref. 13 suggests that the transition to the extended bubble state occurs at roughly 1 pN, about 1 pN below our estimate for mM. We discuss these differences in more detail in Supplementary Sec. III on end-to-end fluctuations, and Supplementary Sec. VIII on sequence dependence, where we show that since AT rich regions are more likely to form bubbles, taking this into account with a sequence dependent model leads to lower forces for the crossover to bubbles than using an average base model for oxDNA does. Nevertheless, even if these effects don’t explain the full difference with experiment because oxDNA underestimates the stability of internal bubbles, this is unlikely to affect our qualitative results.
In the data of Refs. 12 and 13, deviations of the post-buckling slopes from linearity were observed at low stretching forces and high values of . Similar, more pronounced deviations are observed in our results due to finite-size effects arising from the interaction of the coiled DNA strand with the system boundaries (cf. Supplementary Sec. I). Boundary interactions become relevant when the diameter of the plectonemic region is comparable to the end-to-end extension of the double strand. This is expected to be the case at somewhat lower values of in the 600-bp system studied here, as compared to the roughly 10 times longer experimental systems of Refs. 12 and 13, shown in Figs. S3 and S4.
Fig. S5 depicts data obtained by Brutzer et al. [8] at mM, kbp and .
Close agreement is observed concerning both the buckling superhelical densities and the post-buckling slopes (Fig. S5).
We note that in this study, abrupt strand shortening at the buckling point was observed and ascribed to the energetic cost of forming the plectoneme end-loop.
Abrupt strand shortening was shown to become more pronounced with increasing ionic strength.
In oxDNA, we consistently observe a marked shortening of the strand at similar force around the buckling point (see Fig. S5; for an example with the sequence-dependent parametrization of oxDNA, see Fig. S26).
Torque response curves
The torque response of DNA to imposed twist has been studied for systems of different length and salt concentration [5, 7, 10]. A common feature of the torque response is a linear regime for low , followed by a torque overshoot at buckling and a constant post-buckling torque. The published dataset which is closest to the conditions used in oxDNA is the one recently measured by Janssen et al. [10] at mM and kbp using a variant of the magnetic tweezer setup. A comparison to the torque response data is shown in Fig. S6, exhibiting very good agreement for both the size and location of the torque overshoot, as well as the slope of the torque response in the linear regime and the magnitude of the constant post-buckling torque.
Correspondence to Moroz-Nelson theory
The effective twist persistence length of a DNA strand is renormalized because of thermal fluctuations [40].
By using a torsional directed walk model, Moroz and Nelson estimated the effect of fluctuations to lead to an effective twist persistence length of
| (3) |
where and are the microscopic bending and twist persistence lengths of the double strand respectively. In oxDNA, these values have previously been determined as nm and nm [21].
We determined the force-dependent effective twist persistence length of the simulated 600-bp system by fitting the slope of the linear regime of the torque response curve (see e.g. Fig. S6).
Good agreement of the measured torsional moduli with the theoretical prediction is observed (Fig. S7).
If the functional form of Eq. 3 was fitted to the data with and as free parameters, we obtain nm and nm, which are very similar to the previously determined values.
Note that the agreement shown in Fig. S7 is obtained without free fit parameters.
III Simulations of plectonemes of length 1500 bp
For reasons of computational efficiency, the majority of the data presented in the main paper of this work was taken from systems at a strand length of bp. In order to study the influence of differences in strand length and for comparison with experimental work we also performed simulations at strand length bp, for which a version of oxDNA for CUDA-enabled GPUs was used.
At forces between 1 and 3 pN, the 600-bp fluctuation spectrum exhibits enhanced fluctuations, and shows a two-peak substructure (see inset of Fig. 1b in the main text). The first peak may be explained by fluctuations arising from the initial opening of the tip bubble, while the second peak is due to the competition between a tip-bubble plectoneme and the extended bubble state. From this consideration, the first peak of the fluctuation spectrum might be expected to be approximately independent of system size, kink formation being a local effect associated with the plectoneme end-loop. On the other hand, the high-force peak of the enhanced fluctuation region is expected to grow linearly with system size for constant , as it is related to the plectoneme size, and the maximum size of a plectoneme is set by the absolute linking difference , where is the number of base pairs in the strand, and is the average number of base pairs per turn.
To test this expectation, we ran simulations of the 1500-bp system at and pN and pN, near the expected peaks in the fluctuation spectrum. In particular the second point is difficult to sample, as it involves a global redistribution of , which is known to be a relatively slow process [8]. We ran four independent simulations of a total simulation time of approximately s at pN and ten independent simulations of a total simulation time of approximately s at pN. The end-to-end distributions obtained for these state points at bp and bp are shown in Figs. S9 and S10. At pN, clear bimodal behaviour is observed, where a high-extension population represents the extended bubble state, and a low-extension population the tip-bubble plectoneme state. We note that a somewhat similar distribution has been reported from experiments in Ref. 8 for positive supercoiling, where the low-extension state is the unwrithed structure without bubbles and the high-extension case is expected to be plectonemes without tip-bubbles. In our case the low-extension population consists of plectonemes with tip bubbles and is much broader because plectonemes with tip bubbles of different sizes have comparable stabilities. We observe further substructure in the low-extension distribution for bp, but would caution that the sampling of large supercoiled structures converges slowly and so we have not been able to verify that this feature is robust. At any rate, we expect its influence on the standard deviation calculated for the distribution to be small.
Fluctuation results for both 600 bp and 1500 bp are plotted together in Fig. S8, corroborating the expectation that the first peak is largely independent of system size, while the second peak grows much more strongly, with an amplitude increase consistent with our expectation that it would grow roughly linearly with system size.
In a series of pioneering experiments [12, 13], the fluctuation spectrum in was measured for the first time for systems of effective length kbp, around the region for negative supercoiling where there is a crossover from plectonemes to a bubble state. By extrapolating the increase in observed in our simulations, we would predict fluctuations to have a maximum magnitude of roughly nm at the higher force peak which is consistent with what was observed in experiment. We note that these experiments probably could not resolve the first peak, as this is expected to remain very small. The overall width of the peak in the fluctuation spectrum observed in experiments is somewhat more narrow than it is in our simulations for . One reason is that the experiments would mainly resolve the higher force peak, for which the width at half maximum is smaller than the full spectrum we observe at this shorter length. A second reason is that generic finite size effects should lead to a narrowing of the fluctuation peak at a transition for increasing system size. Nevertheless, as also discussed in the main text, the experiments discussed above observed considerably wider peaks in the fluctuation spectrum than they predicted based on a simple model that only includes plectonemes and bubbles. We argue that the bubbles and tip-bubble plectonemes each lower the nucleation barrier for the formation of the other, leading to a broader fluctuation spectrum than one would observe for two states separated by a large nucleation barrier.
We also note that for a similar salt concentration, the experiments of Ref. 13 find the fluctuation peak at pN, a position about one pN lower than our large force peak. There may be a number of reasons for this. Firstly, there are still unexplored generic finite size effects that may lower the transition force for longer strands. Secondly, simulations for both strand lengths reported here have been performed for the average base parameterisation of oxDNA. As discussed in Supplementary Sec. VIII, when using a sequence-dependent model, the crossover between bubble and plectoneme states takes place at lower forces because bubbles preferentially form at AT rich regions. Moreover, for a random sequence, the longer the strand, the higher the probability for finding larger AT rich regions, which may also further enhance the probability of bubble formation. Taken together, these effects are expected to lower the forces at which the fluctuation peak occurs, bringing better agreement with the force at which a fluctuation maximum is observed in the experiments of Ref. 13. Finally, we note that it may also be the case that oxDNA overestimates the cost of forming twist-induced bubbles. It is hard to find direct comparisons to experiment for this phenomenon that would allow for an independent check. As previously mentioned, we we do find good agreement with experiment for force induced melting [24] or for simple duplex melting [21]. Nevertheless, even if it is the case that oxDNA overestimates the cost of forming bubbles this is unlikely to change our qualitative conclusions.
Finally, in Fig. S11, typical tip-bubble plectoneme configurations at bp observed for pN and are shown. We note that these structures are remarkably long-lived once they form. A kymograph for a tip-bubble plectoneme in the bp system at pN and is shown in Fig. S12, demonstrating that these structures can be stable on a s timescale.


IV Determination of plectoneme position, size and tip bubbles
Plectoneme position and size
Plectoneme position and size are determined using an algorithm which relies on the fact that in plectonemes, the spatial distance between two sites on the molecule is smaller than their separation along the strand (Fig. S13).
The algorithm only considers the midpoints between the centers of mass of corresponding bases on the single strands. It proceeds as follows:
- •
Start from strand end, loop over all midpoints
- –
If any part of the remaining strand with a distance of more than bp along the contour has a distance , record the current bp index as the beginning of a plectonemic region, if the beginning of a plectoneme has not yet been detected.
- –
If and a plectoneme beginning has been detected before, record the current bp index as the end of a plectonemic region and continue searching with the next bp
- –
- •
The plectoneme position is the mean between the bp indices of the beginning and end of a plectonemic region
- •
The plectoneme size is the difference between the bp indices of the beginning and end of a plectonemic region
We performed plectoneme detection using nm and bp. The results are not very sensitive to the precise choice of these parameters, as long as , where nm is the approximate rise of one base pair. hence imposes a cutoff on the minimum size of plectonemes that can be detected with the search algorithm. The parameter choice made here ensures that writhed bubbles are reliably not counted as a plectonemic state, thus avoiding false positive detections. The algorithm is able to detect multiple plectonemes along the DNA double strand. However, for the salt conditions and strand length used in this work, only one plectoneme occurs in the simulated system. Two simultaneous plectonemic regions were only detected transiently during initial formation of the plectoneme. In order to obtain a single-valued plectoneme coordinate in these rare cases, we only consider the largest plectoneme structure.
The plectoneme tip-bubble state
For all sequences used in this work, we observed co-localization of plectonemes and bubbles.
In these configurations the plectoneme position and the position of the midpoint of the largest denaturation bubble in the system coincide within a margin .
A plectoneme with a tip bubble is defined as follows:
- •
A denaturation bubble with size bp exists in the system.
- •
A plectoneme is detected in the system using the algorithm described in Supplementary Sec. IV.
- •
The bubble midpoint and the plectoneme position are separated by less than bp
The restriction to bubbles with size bp was introduced in order to discard short-lived single base-pair denaturations, which can occur in the strand due to thermal noise.
Fig. S14 shows distributions exhibiting strong co-localization of bubble and plectoneme. For a large majority of configurations, the bubble-plectoneme distance is less than 20 bp. We therefore chose bp for the detection of tip-bubble plectonemes.
V Interconversion between bubble and plectoneme size
Bubbles in the end loop tend to shorten plectonemes due to three effects. Firstly, a denaturation in the end loop constitutes a defect which allows the formation of a smaller, more tightly wound tip of the plectoneme structure, as shown in Fig. 1d of the main text. This causes an extension of the overall system. Secondly, denaturation bubbles naturally possess very small twist. Thirdly, denatured single strands can twist back on themselves in a negative way, thus even leading to a negative twist contribution. As the overall linking difference of the system is conserved according to the relation [35, 36, 37] (see Supplementary Sec. I), this increase in changes the system’s writhe component and thus the average plectoneme size. Fig. S15 shows free-energy landscapes of the system as a function of bubble and plectoneme size for different values of (see also Figs. 1e and 1f of the main text). In a 600-bp strand, due to thermal noise, very short-lived denaturations of small size can occur in a duplex at K. In order to separate out this contribution, bubbles with a size up of 1 or 2 bp were only taken into account if they were co-localized with a plectoneme.
Fig. S15 shows that after denaturation of the first two base pairs and consequent shape change of the end-loop, the size of plectonemes and bubbles can be interconverted in an approximately linear fashion, as seen also in Figs. 1e and 1f of the main text. For this system, the initial formation of a 2-bp tip bubble causes a decrease in plectoneme size by roughly 100 bp. Assuming that the equivalent plectoneme size is converted into extended strand length aligned with and neglecting changes in bending energy, the free energy gain due to this extension is pN nm for K. This free energy gain is on the same order of magnitude as the cost of forming a small double strand denaturation in oxDNA.
Fig. S16 shows free energy profiles as a function of bubble size, corresponding to projections of the 2-dimensional free energy landscapes of Fig. S15 onto the x-axis. At pN, a 2- bp tip bubble denaturation starts to become favourable. This small initial denaturation is particularly stable, as it enables kinking and therefore tighter winding of the end-loop, as shown in Fig. 1d of the main text. As the force increases, it becomes more favourable to grow larger bubbles, as can be seen in the free-energy plots in Figs. S15 and S16. For large enough force, the plectoneme disappears, and the dominant states are extended bubble states.
The thermodynamics of the crossover between tip-bubble plectonemes and extended bubbles is illustrated in Fig. S17, where the projection of Fig. S16 is separated into contributions due to plectonemes, and contributions due to bubble states without plectonemes. As discussed in Supplementary Sec. IV, the classification of tip-bubble plectonemes of small size somewhat depends on the cutoff of our plectoneme detection algorithm. However, as the transition from tip-bubble plectonemes to bubbles is fairly narrow (cf. Fig. 1b of the main text and Supplementary Sec. VII), this is not expected to significantly affect the force at which the crossover occurs. Fig. S17 clearly shows how, with increasing force, the system transitions from a regime with mainly tip bubbles, to a regime with mainly extended bubble states.
At parameter values where extended bubbles and tip-bubble plectonemes can coexist, local kinks induced by bubbles provide a preferred site for re-nucleation of a plectoneme. Structures and a corresponding kymograph are shown in Fig. S18 to illustrate the crossover dynamics between bubbles and plectonemes for and pN. The average size of both bubbles and plectoneme structures as a function of at is shown in Fig. S19.


VI Displacement behaviour of plectonemes
Diffusion
Fig. S20 shows the mean square displacement of plectoneme structures with and without tip bubbles in a 600-bp system, using the random sequence described in Supplementary Sec. VIII for , and , and a stretching force pN.
The data was extracted from sections of trajectories of a total simulated time of 140 s for each value of . On a s time scale, the mean-square displacements (MSD) of the positions of plectonemes without tip bubbles show an approximately linear behaviour in time, indicating diffusive motion of these structures.
In contrast, tip-bubble plectonemes do not show any signature of MSD on that time scale. The diffusion coefficient and the MSD are related by , allowing determination of from linear fits to the data shown in Fig. S20.
The determined diffusion constant for unpinned structures decreases as becomes more negative because of the larger plectonemes that form at larger .
The numerical values of determined from the fitting procedure are given in Table S1.
The diffusion constants obtained in this section are much higher than those measured in Ref. 11. There are several reasons for this difference. Firstly, at a strand length of 600 bp, even the highest superhelical density used to study diffusive motion, , corresponds to a linking difference of . Thus, plectonemes of at most 3-4 double strand self-crossings are expected. In practice, plectoneme structures are slightly shorter, due to positive values of . In contrast to this, linking differences were imposed in Ref. 11, leading to much larger plectoneme structures which are expected to diffuse more slowly than the simulated structures. Secondly, a high effective monomer diffusion coefficient m2s-1 was chosen in simulations for this work. This is a common choice in coarse-grained models, and increases the efficiency of sampling slow processes. From measurements of diffusive motion of DNA single strands, we estimate these effects to speed up the simulations by up to two orders of magnitude in simulated time [34]. Finally, underlying free-energy landscapes tend to be smoothed out in coarse-grained models, leading to accelerated motion of the simulated diffusion over barriers compared to the experimental system (see e.g. Ref. 41). The time scale used in our integrator is set by the mass, length and energy scales used, which determine the frequencies of intra-molecular vibration modes. Coarse-graining may affect differently processes such as the overall bending mode of the double strand, which are important for strand reptation, making it difficult to define a homogeneous time scale for all these processes. Therefore, it is generally safer to compare the relative time scale of two processes rather than their absolute duration.
In Ref. 11, experimental images were obtained with a 20 ms time resolution. This time-scale may be much larger than the lifetime of tip bubbles in a regime in which there is a finite population for both plectonemes with and without tip bubbles. Thus, diffusion constants measured in experiment determine an average over pinned and unpinned states, and provide an effective diffusion coefficient , as described in the main text.
| (kbp2s-1) | mean plectoneme size (bp) | |
|---|---|---|
| 161 | ||
| 218 | ||
| 272 |
Hopping
We observed long-range displacement of plectonemes by “hopping”.
In 21 independent simulations of a 600-bp system at pN and run for a total simulation time of 148 s, we observed 4 hopping events which involved rapid displacement of the plectoneme center position over a distance of more than 100 bp.
In all cases, the plectoneme in the initial location fully unformed, and then quickly re-formed at a distant site (see Fig. S21 for a detailed plectoneme position kymograph and strand structures).
Coexistence of two plectonemes was not observed in equilibrium, as expected at the high-salt conditions used in oxDNA [16, 11].
Due to the absence of equilibrium multi-plectoneme states in the 600-bp system, we observe hopping only close to the critical buckling superhelical density , where the system has a non-zero probability to dissolve a plectoneme and return to the extended state.
However, for DNA strands of length 1500 bp, we did observe long-range writhe exchange between two simultaneously present plectonemes in an out-of-equilibrium situation. Simulations were started from a linear, homogeneously undertwisted double strand at and pN. A typical example of such a run is shown in Fig. S22, where the kymograph initially shows the simultaneous presence of two plectonemes. Coexistence is followed by the disappearance of the smaller plectoneme, mediated by long-range transport of its writhe to the larger plectoneme,which then stays stable for a long time.
Van Loenhout et al. [11] found a similar long-range displacement behaviour over distances of up to 15 kbp at pN and . Some hopping events observed in the experiments of Ref. 11 showed immediate dissolution of the initial plectoneme, and re-nucleation at a distant site, which is reminiscent of the equilibrium mechanism described above. However, the experiments are performed at ambient conditions that permit stable coexistence of multiple plectonemes, so that the mechanism reminiscent of the one we observe in non-equilibrium situations is likely to be present as well.
A more detailed treatment of plectoneme hopping in strands of different lengths is an interesting open problem for further study.


VII Population frequencies of different DNA structures
This section shows the population frequencies of bubbles, plectonemes and tip-bubble plectonemes as a function of for different fixed values of , as in Fig. 1b of the main paper. The pictures correspond to “cuts” along axes parallel to the y-axis of the state diagram (cf. Fig. 1c of the main paper). We used a population of in these plots to define the boundaries in the state-diagram shown in Fig. 1c of the main paper.
For , there is a clear crossover from pure plectonemes to tip-bubble plectonemes and then to pure bubbles as a function of force. For , a broader crossover to the tip-bubble regime occurs. At low values of , the recognition of small plectonemes somewhat depends on the cutoff values chosen in the plectoneme detection algorithm, as described in Supplementary Sec. IV. As the transitions in this region of the state diagram are narrow as a function of and , this has only a small effect on the positions of state boundaries.
Note that as long as is large enough to allow stable tip bubbles, the transition from plectonemes to tip bubbles appears to be at a very similar force for different . The reason for this is that the crossover is mainly determined by a change in the end-loop structure, rather than in the rest of the plectoneme, which grows for increasing . Similar arguments may explain the observation that the transition from tip bubbles to extended bubbles also happens at the same force for different negative values of .
VIII Sequence-dependent properties
Underlying base sequences
In this work, we studied sequence-dependent properties of plectonemes using the sequence-dependent parametrization of oxDNA [22].
The sequences we used in the study of sequence-dependent behaviour are:
Random sequence:
5’-AGAGTACTTAGGCTTGACGATTTCGCGCCTGAACTTCTGATAACTCAGTCTGAGAGACTAAGTTGACGTTCTATCCATCATCA
GGTGGGCTCAGAGATTGTGCGGCAGACTTAAGTGTAGTACCAGCTGCTGGTCAATTTGATCTATGCTGATCCGCTCGGAACGGGCC
GTGAAAGAAGTACTCTCGCCTATAGAACGGTTAGTGCTACGACTTTTGCGCGACACAATGTGGTAGTTATCTTCTGTTTTCCTGAA
TAGTGAGCCTACCAGAAGAGGCCACCGACAAATCTGATGAGATAGACGGGAACACGGTTTGCGGAGCCTCTGAAACGCTTGTTTAT
GAGCAAGAGAGGTGCGGTGGGTATGACCGCCGTAGAAGTACCGTATTCTTCCGGGCTCGGTGGCAATGAACACTTAAGGGGCCGAC
ACATTCTGAAGTCAATCGATGGACGGACCTCAACCGTGCACCCTTCTATATACGTGTGGCTAGGATACTCTAGCGTTTACCCGCCG
TCTTCCACGATGCCGAATATAAGCCGAGGATAAAGGTGCAGACAAATATCAGGCTTCGCAGTTGTGTAACTTCCTGTATTGTTGTG
C-3’
This sequence was chosen at random, with a probability for each possible base identity.
Block-random sequence:
5’-AGACTCGACCGACCCGCGAGATCGGCTCCAGTCTCTGCGCCAAGTGCCGTTGCCCCGTCTCGTGGGCCGGTCGGTGAACCTTC
ATACGGTGGGAGTCGCTGAGGCCGTCCCATTTGTACCCATCGAACTCTTATTTTGTATTTTTTGGACATCCTCAGCTAACCACACG
AGCCAAGCTATAGATCAGATTTGGGTATTCGGCGATCTTTCTAATCAACTGTATCCGATGCTATACAGATACTTTATTCTAAGGCG
GTCCGCGATGCGCCCAGTCCGTTGACCGGGCGAGTCATGTCAGAGTCGGCAATTATCGGGCACGTCGCCGGGGTGATACGTCCCTG
TGTCACTAGGCATAGGTCGTAACATATGATTATATATACTTTCCACTTTATGTATATCATTTGCAAGTTAGACATAATAAGGATAT
ATAATATAAGAATCTCTTCACCTCTAAAGTGAGTGATTGGAATATAAGTATTTGCGCCACTACCCGGCCGAAAGCCCGCGGCTCCT
CGCGGGTAGGTTGCCGGGGACCCGCGTGAAGAAAGGATGAAGCACCCGGACGCCCGCCTGCGAGTTGGCCACGGGCCCATAACGGC
G-3’
Above, stretches of 120 bp length are colored, with blue regions having a high GC content and red regions a high AT content.
In an abbreviated form, the block-random sequence can be written as 5’--3’.
The overall GC content of the block-random sequence is . The GC contents of the individual 120 bp stretches is given in Table S2.
| stretch | GC content | AT content |
|---|---|---|
plectoneme position distribution in average-base model
As reported in Fig. 2c of the main paper, the distribution of plectonemes exhibits a marked sequence dependence which is induced by the sequence-dependent enthalpic cost of forming tip-bubble denaturations.
In order to distinguish this sequence-dependent effect from the generic localization behaviour, we also ran simulations under the same stretching force and undertwist ( and pN) for the average-base parametrization of oxDNA.
Comparison between the two sequences studied and the average-base parametrization are shown in Figs. S24 and S25. Due to the repulsion plane boundary described in Supplementary Sec. I and finite plectoneme size, the probability for the position of plectoneme midpoints decreases towards the strand ends.
A clear influence of the sequence on plectoneme position is shown in Figs. S24 and S25.

Sequence effects in extension curves
In Fig. S26 we compare extension “hat curves” obtained for both the average-base and sequence-dependent parametrization of oxDNA.
Sequence-dependent simulations were performed for the random sequence given above.
While outside the bubble regime, results show no significant difference, the sequence-dependent model exhibits a systematically larger extension when forces become big enough to allow denaturation.
This indicates that denaturation occurs more easily in the sequence-dependent case than for the average-base parametrization.
Such behaviour might be expected, as weak AT base pairs represent preferred sites of base-pair breaking, making denaturation of the strand less enthalpically costly, while not affecting the bending energy cost much. From simple considerations of energy scaling for the competition between denaturation and plectoneme formation, the crossover force can be estimated to depend on the free energy of base pair breaking as [12]. Hence, sequence-dependent differences in denaturation energy are expected to have a noticeable effect on strand extension properties. As denaturation bubbles can grow to significantly larger sizes than 1 bp, not only the overall AT content of the strand, but also the base distribution may influence extension properties (see also the previous discussion on the block random sequence). The detailed influence of sequence properties on strand extension behaviour represents an interesting problem for further study, which we are planning to address in the future.
IX Comparison to other modelling approaches
DNA under superhelical stress has been modelled using various approaches on different scales of resolution. Here, we briefly compare oxDNA to other models applicable to similar problems.
On a continuum level DNA is commonly described as a semi-flexible polymer. These models provide an efficient representation of DNA on large length scales, and have been widely used to study supercoiled DNA [42]. Continuum models have also been used to study the phase behaviour of DNA plectonemes and other states deviating from the linear B-helical configuration [43, 14, 39]. These models have been very successful at describing the effective mechanical behaviour of DNA on larger length scales. oxDNA captures the elastic behaviour of DNA, but also naturally has access to the physics of base-pair formation, which is important for the tip-bubble plectoneme regime we study in this work. It would be very interesting to refine continuum models by using oxDNA, to allow the direct calculation of tip-bubble plectonemes for positive and negative supercoiling.
To study the statistical properties of DNA denaturation, an important model has been developed by Benham and co-workers [44, 45, 28]. It is a thermodynamic model based on considering the effective free energy contributions of denatured and non-denatured strand regions. Its simplicity allows rapid calculations of the statistical denaturation properties of supercoiled DNA on a genomic level [46]. Among other applications, it has been used successfully to describe sizes and locations of denaturation bubbles in circular DNA [47]. However, the model does not explicitly account for DNA structure beyond denaturation, or provide microscopic information on strand dynamics, processes which are important for the tip-bubble plectoneme regime. It would be interesting to see if a similar thermodynamic model can be adapted to predict the distribution of locations and sizes of tip-bubble plectonemes.
On a much more structurally detailed level, DNA response to supercoiling has been studied in atomistic simulations [48, 49, 50]. As these simulations are computationally expensive, they have only recently been used to access extended DNA structures under superhelical stress. Atomistic simulations have been able to study local structural defects in small supercoiled minicircles, in particular microscopic properties of kinking at denaturations [51, 19]. Due to their computational expense, the timescales of these simulations are comparatively short, making the extraction of equilibrium properties difficult, in particular for writhed structures. For this reason, modelling of the properties of long DNA strands under twist and stretching force, as performed in this work, is currently outside the reach of fully atomistic models. It may be interesting to prepare locally bent configurations in a plectonemic state, and use atomistic simulations to observe the local detailed configuration of a tip bubble.
Coarse-grained models, which combine structural information on a higher level of resolution with the possibility to measure thermodynamically averaged quantities, are needed to fill the gap between thermodynamic models and continuum models on the one hand and atomistic models on the other hand. In Refs. 21, 22 and 23, we review a number of other coarse-grained DNA models, although the interplay between twist, writhe and denaturation has not received much attention. One model that has been used to study the interplay between denaturation and writhe is the coarse-grained model by Mielke et al. [20]. In this approach, a single coarse-grained unit represents 3 nucleotides. The authors considered 141-bp minicircles, which they twisted in a dynamical fashion, up to , a very high superhelical density. For a few runs, the authors saw evidence that initial denaturation occurred at weak points in the sequence, near the loops of the writhed figure-of-8 structures that would form prior to denaturation. As such, they saw tantalising evidence of coupled writhe and denaturation. As the model of Ref. 20 does not allow reversible base-pair denaturation, its applicability is limited to non-equilibrium situations. It would be interesting to study the same system with oxDNA to see if this result for minicircles is robust in equilibrium. One can imagine quite a number of other DNA configurations where the coupling of twist, writhe and denaturation may be interesting to study with oxDNA.