Downlink Analysis for a Heterogeneous Cellular Network
Abstract
In this paper, a comprehensive study of the the downlink performance in a heterogeneous cellular network (or hetnet) is conducted. A general hetnet model is considered consisting of an arbitrary number of open-access and closed-access tier of base stations (BSs) arranged according to independent homogeneous Poisson point processes. The BSs of each tier have a constant transmission power, random fading coefficient with an arbitrary distribution and arbitrary path-loss exponent of the power-law path-loss model. For such a system, analytical characterizations for the coverage probability and average rate at an arbitrary mobile-station (MS), and average per-tier load are derived for both the max-SINR connectivity and nearest-BS connectivity models. Using stochastic ordering, interesting properties and simplifications for the hetnet downlink performance are derived by relating these two connectivity models to the maximum instantaneous received power (MIRP) connectivity model and the maximum biased received power (MBRP) connectivity models, respectively, providing good insights about the hetnets and the downlink performance in these complex networks. Furthermore, the results also demonstrate the effectiveness and analytical tractability of the stochastic geometric approach to study the hetnet performance.
Index Terms:
Multi-tier networks, Cellular Radio, Co-channel Interference, Fading channels, Poisson point process, max-SINR connectivity, nearest-BS connectivity.I Introduction
The modern cellular communication network is an overlay of multiple contributing subnetworks such as the macrocell, microcell, picocell and femtocell networks, collectively called the heterogeneous network (or, in short, hetnets). The hetnets have been shown to sustain greater end-user data-rates and throughput as well as provide indoor and cell-edge coverage, further leading to their inclusion as an important feature to be implemented under the fourth-generation (4G) cellular standards [4, 5, 6, 7, 8, 9, 10].
Until recently, the analysis of such networks has been done solely through system simulations. Since the hetnets consist of a combination of regularly spaced macrocell base-stations (BSs) along with irregularly spaced microcell and picocell BSs and often randomly placed end-user deployed femtocell BSs, it is difficult to study the entire network at once using simulations. Further, the BSs in each of these networks have different transmission powers, traffic-load carrying capabilities and different radio environment that is based on the locations in which they are deployed. The many parameters involved in the design and modeling of the individual networks makes it difficult to narrow all the possibilities down to a limited set of simulation scenarios based on which one can make design decisions for the entire network. Under these circumstances, the development of an analytical model that captures all the design scenarios of interest is of great importance.
Towards this goal, a stochastic geometric model has been identified as a plausible analytical model as well as the most widely used one in academia. There is a rich set of results for studying the behavior of large systems with nodes deployed randomly (especially according to a homogeneous Poisson point process on the plane) and can be found in [11, 12, 13, 14]. For the cellular network, a strong motivation for viewing the BS arrangement as a homogeneous Poisson point process can be drawn from the study of the cellular systems in [15, 16, 17] which suggests that significant insights can be gained by bounding the downlink cellular performance between the ideal hexagonal grid model and the homogeneous Poisson point process based model. More interestingly, in [16, Fig.2.], it is claimed with the help of Monte-Carlo simulations that in the limit of strong log-normal shadow fading (standard deviation of the fading coefficient ), the downlink performance of an ideal hexagonal cellular system approaches the performance in a cellular system with randomly deployed base-stations according to a homogeneous Poisson point process. Recently, the above convergence has been analytically proved in [18, Theorem 3]. It is shown that the downlink performance of a cellular network with any deterministic arrangement of BSs (not just the ideal hexagonal grid model) converges to that of a Poisson point process based model as , and moreover even for realistic values of that are observed in the indoor environments, the latter model is a good approximation for the deterministic model. Results in [19, 20, 21] demonstrate that, with the Poisson point process based BS arrangement, the study of the cellular system has the distinctive advantage of being analytically tractable, unlike the studies based on the hexagonal grid model that are purely simulation-based.
In light of the above motivations, it is well-justified to study the hetnet performance by viewing the hetnet as composed of multiple tiers of networks (e.g. macrocell, microcell, picocell and femtocell networks), each modeled as an independent homogeneous Poisson point process, and such studies have been done in [22, 23, 24, 25, 26, 27, 28, 29] and by us in [1, 2, 3]. These studies mathematically characterize important performance metrics such as coverage probability (1 - outage probability), average ergodic rate, average load carried by BSs of each tier and load-awareness. Furthermore, such studies have facilitated the characterization of the improvements that techniques such as fractional frequency reuse and carrier aggregation bring to cellular performance as well as hetnet performance. In the following subsection, we differentiate our work from the other prior work on hetnets and list the contributions of this paper.
Contributions of the paper
Here, the hetnet is modeled to consist of open and closed access networks formed by the arrangement of BSs according to homogeneous Poisson point process with a certain density for each tier, and independent of the other tiers. The focus is on the downlink performance analysis; the MS has access to only the open-access tiers and connects to one of the BSs in these tiers. The closed access tiers only cause interference at the MS. Hence, we study the downlink performance where the hetnet consists of an arbitrary number of open and closed access tiers. Signals from BSs of a given tier have a constant transmit power, random fading coefficient that is i.i.d. across all the BSs of the same tier and independent of those of the other tiers with any arbitrary distribution, arbitrary path-loss exponent that is constant for all BSs of the same tier and different across different tiers, and the signal-to-interference-plus-noise-ratio (SINR) threshold for connectivity to a given open-access tier’s BS is . For such a general setting, expressions for the coverage probability at the MS are derived for both the max-SINR connectivity model and the nearest-BS connectivity model. In the former connectivity model, the MS is said to be in coverage if there exists at least one open-access BS with an SINR above the corresponding threshold, and under the latter connectivity model, the MS is said to be in coverage if at least one among the nearest BSs of each open-access tier has an SINR above the corresponding threshold.
The results shown here are generalizations of the existing results in [27, 29, 23, 3, 2]. In [26, 25], the coverage probability results are obtained for the hetnets under the max-SINR connectivity, but for the case where the fading coefficients for the BS transmissions are independent and identically distributed (i.i.d.) exponential random variables, and the path-loss exponents are the same for all the tiers. Using an entirely different approach, [24, 23, 22] derives the coverage probability for the hetnet with max-SINR and nearest BS connectivity models, but were again restricted to the i.i.d. exponential distribution case for fading. In [29], the authors study the hetnet coverage probability for the maximum biased received power (MBRP) connectivity model (which is a special case of the nearest-BS connectivity model, as will be seen later), and again for the exponential fading assumption for all BS transmissions. In [1, 2, 3], we derived the hetnet coverage probability for the case when the i.i.d. fading coefficients have an arbitrary distribution and the path-loss exponents are different for different tiers, for the maximum instantaneous received power (MIRP) connectivity model, which is a special case for the max-SINR connectivity model, as will be discussed later. Here, we derive the coverage probabilities for the general connectivity models (max-SINR and nearest-BS) for the general system settings mentioned above.
When the SINR thresholds of all the tiers are above 1, the hetnet coverage probability under max-SINR connectivity and MIRP connectivity are identical, and nearest-BS connectivity and the MBRP connectivity are identical. Further, in these special cases, simple analytical expression are derived for the coverage probability, average rate and the load carried by the BSs of each tier. The following section describes the system model in detail.
II System Model
This section describes the various elements used to model the wireless network, namely, the BS layout, the radio environment, and the performance metrics of interest.
II-1 BS Layout
The hetnet is composed of open-access tiers and closed-access tier, and the BS layout in each tier is according to an independent homogeneous Poisson point process in with density , for the open-access tier and closed-access tier, respectively, where and . The MS is allowed to communicate with any BS of the open-access tiers, but cannot communicate with any of the closed-access BSs.
II-2 Radio Environment and downlink SINR
The signal transmitted from each BS undergoes shadow fading and path-loss. The SINR at an arbitrary MS in the system from the BS of the open-access tier is the ratio of the received power from this BS to the sum of the interferences from all the other BSs in the system and the constant background noise , and is expressed as
| (1) |
where is the sum of the received powers from all the open-access tier BSs, are the constant transmit power, random shadow fading factor, constant path-loss exponent and the distance from the MS of the BS of the open-access tier. Similarly, is the sum of the received powers from all the closed-access tier BSs, lists the constant transmit power, random shadow fading factor, and the constant path-loss exponent of the BS of the closed-access tier. The fading coefficients are i.i.d. random variables with the same distribution as , . Further, following [20], it is assumed that . Finally, is the distance of the nearest BS belonging to the open-access ( closed-access) tier, and represents the distance from origin of the sets of points distributed according to the homogeneous Poisson point processes described in Section II-1. The various symbols introduced in this section are listed in Table I for quick reference.
| Symbol | Description |
|---|---|
| Number of open-access and closed-access tiers, respectively. | |
| BS densities of open-access and closed-access tiers, respectively. | |
| Constant transmission powers of the BSs | |
| of the K open-access tiers and closed access tier, respectively | |
| Path-loss exponents of the open and closed - access tiers ( > 2). | |
| i.i.d. fading gains of the open and closed-access tiers | |
| SINR thresholds for connectivity to a BS in the open-access tier | |
| Background noise power | |
| = |
II-3 BS connectivity models
A MS is able to communicate with a BS of the open-access tier if the corresponding SINR is above a certain threshold . In this case, the MS is said to be in coverage. The BS connectivity models provide a rule to determine which BS to connect to, and in this paper, we focus on the max-SINR connectivity model and the nearest-BS connectivity model. The MIRP connectivity model and the MBRP connectivity model are special cases of the max-SINR and nearest-BS connectivity models, respectively, and will be discussed in detail in the later sections.
Under the max-SINR connectivity model, the MS is said to be in coverage if there exists at-least one BS among all the open-access tiers with an SINR at the MS above the corresponding threshold, and is mathematically expressed as follows.
| (2) |
where corresponds to the BS of the tier as defined in (1) and is the maximum SINR at the MS among all the open-access tier BSs.
The MS is said to be in coverage under the nearest-BS connectivity model if there exists at least one of the nearest BSs of the open-access tiers with SINR at the MS above the corresponding threshold. This is mathematically expressed as
| (3) |
where (see (1)) is the SINR at the MS from the nearest BS among the tier BSs. In the following section, we derive expressions for the hetnet coverage probability for the above mentioned connectivity models.
III Hetnet Coverage Probability
In [14], a technique to compute the downlink coverage probability under max-SINR connectivity for a single-tier network was shown. In [26], this technique is used to compute the hetnet coverage probability for an open-access case where the fading coefficients for all the BSs in the system are i.i.d. unit mean exponential random variables and the path-loss exponents are the same for all tiers. Here, we generalize the technique developed in [14] to compute the hetnet coverage probability for both the max-SINR and nearest-BS connectivity models for a general system model explained in Section II.
The coverage probability expressions in (2) and (3) can be equivalently expressed as follows:
| (4) | |||
| (5) |
where is the maximum of the received powers from all the tier BSs, is the received power from the nearest BS among all the tier BSs, is the sum of the received powers from all the open-access BSs (closed-access BSs) in the system, and are defined in (1). We begin with computing the Laplace transform of the interference from the closed-access tiers, , .
Lemma 1.
The Laplace transform of the interference from the closed-access tiers is
| (6) |
Proof.
The proof for (6) is as follows. where is obtained because the BS arrangement for the closed-access tiers and the corresponding transmission and fading parameters are independent of each other, and evaluates the expectation in using the Campbell’s theorem of Poisson point process [30, Page 28], and (6) is obtained by evaluating the integral in . ∎
Next, we derive expressions for two Laplace transforms that are useful to obtain semi-analytical expressions for and , respectively.
Lemma 2.
| (7) | |||
| (8) |
where is from Lemma 1 and the random variables and are i.i.d. for all .
Proof.
See Appendix -A. ∎
The significance of Lemmas 1 and 2 are as follows. Notice from (4) and (5) that the hetnet coverage probability can be obtained if the joint probability density function (p.d.f.) of and is known. The joint p.d.f.s can be derived from the Laplace transform expressions in Lemma 2 using the following simple operations.
| (9) | |||
| (10) |
where denotes the joint p.d.f. of the involved random variables. This is shown for the max-SINR connectivity case in [14, Corollary 4], and exactly the same steps can be used to derive (9) and (10). It is not shown here to avoid repetition. Further, the partial derivative terms in the above equations can be easily computed and are given below.
| (11) | |||
| (12) |
When fading coefficients are i.i.d. unit mean exponential random variables , setting and , (11) reduces to [26, (2)]. Having computed the expressions for the joint p.d.f.’s in (9) and (10), the coverage probabilities can be easily obtained as shown below.
Theorem 1.
The hetnet coverage probability max-SINR connectivity and the nearest-BS connectivity models are as follows:
| (13) | |||
| (14) |
where , all the other symbols are in Table I, and the Laplace transform function in (13) and the derivative of the Laplace transform function in (14) are given in (7) and (12), respectively.
Proof.
Once the joint p.d.f. has been obtained (see (9) and (10)), the probability of the event in (4) can be derived as follows:
where expresses the probability of the coverage event in terms of the joint p.d.f., is obtained by substituting for the joint p.d.f. from (9), then interchanging the order of integrations of the variables and which is justified by the boundedness of the integrals. Finally, the above expression can be further simplified to obtain (13).
The same steps can be followed for obtaining (14), and are omitted for brevity. ∎
Using an alternate approach, expressions for the hetnet coverage probability are obtained in [22], again, when all the fading coefficients are i.i.d. exponential random variables. For a general system model as in this paper, to the best of our knowledge, the hetnet coverage probability has not been characterized, until now.
Nevertheless, the semi-analytical expressions are extremely complicated even for numerical computations, and little intuition and insights about the hetnet performances are obtainable from these expressions. As a result, a more qualitative study is imperative to better understand these soon-to-be-prevalent cellular networks. From now onwards, we conduct a more systematic study to bring out the properties and dependencies of the hetnet performance on the various parameters of the system. To begin with, we make the following observations about the hetnet performance.
Corollary 1.
The downlink coverage probability in the hetnet is the same as in another hetnet with the same open-access tiers as in the original hetnet (described in Section II-1) and one closed access tier where the BSs have unity transmission power, fading coefficient and path-loss exponent and are arranged according to a non-homogeneous Poisson point process with a BS density function
| (15) |
Proof.
Firstly, the BSs in the closed-access tiers only contribute to the interference as the MSs cannot be served by these BSs. Secondly, the total closed-access interference power is independent of the signal power and interference power at the MS from the open-access tiers. Next, satisfies the following stochastic equivalence where is the set of distances from the origin of BSs arranged according to a non-homogeneous Poisson point process with BS density function given in (15). This is obtained by first using the [20, Theorem 2] to obtain an equivalent BS arrangement for each closed-access tier according to non-homogeneous Poisson point process with unity transmission power, fading coefficient and path-loss exponent at each BS in the tier. Due to [20, Theorem 2], the equivalent BS arrangement has the same probability distribution for the interference caused at the MS as the original case. Next, since the BS arrangements, transmission and fading characteristics of the BSs of all closed-access tiers are independent of each other, using the Superposition theorem [30, Page 16], the closed-access tiers can be combined together to obtain a single closed-access tier with BS according to non-homogeneous Poisson point process with a BS density function equal to the sum of the BS density functions of the individual tiers obtained from the previous step, and is shown in (15). Again, the equivalence is such that the probability distribution of will be the same as that of the equivalent closed-access tier where the BSs have unity tranmission power and fading coefficients. ∎
Hence, we have shown an equivalence between a hetnet with closed-access tiers and another hetnet with a single closed-access tier. Next, we make an interesting observation regarding the hetnet downlink performance under the max-SINR connectivity model.
Corollary 2.
The hetnet performance under max-SINR connectivity with an arbitrary fading distribution at each tier is the same as in another hetnet with open-access and closed-access BS densities as and , respectively, and i.i.d. unit mean exponential distribution for fading at all the BSs in the network.
The above result is obtained by noting that the effect of fading is equivalent to scaling the density of BSs by the moment of the fading random variable, due to [20, Corollary 2]. A large body of work involving the stochastic geometric study of networks predominantly assume fading coefficients to be i.i.d. exponential random variables, as this greatly simplifies the analysis and renders itself to closed-form characterization of coverage probabilities and other related performance metrics of several networks including the hetnets (see [25]). A common criticism for all these works has been that the exponential distribution does not accurately capture the slow fading environment. Interestingly, the above corollary shows an example of a scenario wherein studies with exponential fading assumptions completely characterizes the arbitrary fading scenario. Unfortunately, the same is not true for the nearest-BS connectivity model. In the following section, we explore more properties for the hetnet downlink performance.
The importance of the Corollary 1 is that the SINR distribution of the two equivalent hetnets are the same for both the max-SINR and nearest-BS connectivity models. Hence, without loss of generality, we study the downlink performance where the hetnet consists of tiers of open access networks and a single closed access network. For the sake of simplicity, it is assumed that the closed-access tier has homogeneous Poisson point process based BS arrangement with a constant BS density , transmission power , path-loss exponent and i.i.d. fading coefficients with the same distribution as .
IV Qualitative study of hetnet downlink performance
We begin with some simple stochastic ordering results comparing the hetnet coverage probabilities for the two connectivity models.
Proposition 1.
For the same system parameters, .
The above result is easily proved by noting from (2) and (3) that , i.e. the coverage event corresponding to the nearest-BS connectivity is a subset of the max-SINR connectivity model.
When , commonly referred to as the unbiased case in the literature, the hetnet coverage probabilities of the max-SINR connectivity model is identical to the maximum instantaneous received power (MIRP) connectivity model. Under the MIRP connectivity, the MS connects to the BS with the maximum instantaneous received power among all the open-access tiers. As a result, the serving BS and the coverage probability expression for the MIRP are
| (16) |
where refers to the tier-index and refers to the BS-index of the serving BS. Another popular connectivity model for the hetnets is the so-called maximum biased-received-power (MBRP) connectivity model that is studied in [29].
Under MBRP, the MS associates with the BS with the maximum average received-power in the hetnet with a certain biasing corresponding to each tier. Hence, the serving BS will be one of the nearest BSs from the MS corresponding to the open-access tiers. Then, the tier-index of the serving BS and the hetnet coverage probability under MBRP are determined as follows:
| (17) | |||||
| (18) |
where are the biasing factors; is the long-term averaged received power at the MS from the tier BSs, and the maximum is from the tier BS nearest to the MS; and is defined in .
We begin with characterizing the c.c.d.f. of for the MIRP case, and several related important characteristics.
IV-A SINR characterization under MIRP connectivity
The following stochastic equivalence helps simplify the SINR characterization.
Lemma 3.
The SINR at the MS under MIRP is the same as in the two-tier hetnet where the tier to which the MS has an open-access network with a BS density function with and a closed-access network with a BS density function . All the BSs in the equivalent systems have unity transmit powers, fading coefficients and path-loss exponents. The SINR is stochastically equal to
| (19) |
where indicates the equivalence in distribution; and is the ascendingly ordered distances of the BSs from the origin, obtained from a non-homogeneous 1-D Poisson point process with BS density function defined above.
Proof.
See Appendix -B. ∎
The following lemma shows interesting stochastic equivalences when .
Lemma 4.
The hetnet SINR under MIRP connectivity has the same distribution as in the following three networks. The first is a hetnet with BS densities for the open-access tiers and the closed-access tier, respectively, unity transmit powers and shadow fading factors for all tiers. The other two are two-tier networks with unity transmit powers and shadow fading factors for all their BSs. The first two-tier network has the open-access tier BS density , closed-access tier BS density and experiences the same background noise as the hetnets. The second two-tier network has a unity open-access tier BS density, closed-access tier BS density and a background noise . Equivalently,
| (20) | |||
| (21) | |||
| (22) |
where indicates equivalence in distribution. The SINR expression on the right-hand side is a function of the total number of tiers in the hetnet, BS densities of each open-access tier, BS densities of the closed-access tier, back-ground noise power, and the tier index of the serving BS, respectively.
Proof.
See Appendix -C. ∎
Lemmas 3 and 4 are generalizations of [2, Lemma 1] and [21, Lemma 1], respectively, to the case where the hetnet also contains a closed-access tier. Next, we compute the hetnet coverage probability.
Theorem 2.
The hetnet coverage probability under MIRP is
| (23) |
where .
Proof.
The proof is along the same lines as [2, Theorem 1], and is not shown here. ∎
The above expression can be greatly simplified under certain special cases, and the following results present these cases.
Corollary 3.
When , the hetnet coverage probability is
| (24) | |||
| (25) |
where , and are from Lemma 4 and is defined in Theorem 2. When or , (24) is equal to . When there is no closed-access tier , (24) is equal to the single-tier network coverage probability (see [20, Corollary 4]) and is independent of the transmission powers and fading factors of the BSs in the system.
Proof.
The result is obtained by exchanging the order of integrations in (23) and simplifying. ∎
The following theorem shows another scenario when the hetnet coverage probabilities are identical for the max-SINR and MIRP connectivity models.
Theorem 3.
When , the hetnet coverage probability is given by
| (26) |
and in the interference limited case when
| (27) |
Proof.
In the above result, (26) can be easily computed numerically and is an extension of [25, Theorem 1] to arbitrary fading and path-loss case. The study of the MIRP connectivity has given many interesting insights and simplifications for the max-SINR case.
Further, other performance metrics pertinent to hetnets such as the average fraction of load carried by each tier in the hetnet and the area-averaged rate acheived by an MS that is in coverage in a hetnet can also be derived using the results in this section. We refer the reader to [3, Theorems 2, 3 and 4] for these results.
Now, we study the MBRP connectivity in further detail, and derive interesting results and relationships with the hetnet performance under nearest-BS connectivity.
IV-B SINR characterization under MBRP connectivity
From the definition of the hetnet coverage probability under MIRP and MBRP, the stochastic ordering result can be extended beyond Proposition 1 as follows.
Proposition 2.
For the same system parameters, when or , , for the biasing factors under MBRP as , for open-access tiers. When , MBRP connectivity is same as the popular maximum averaged received power (MARP) connectivity model.
It is clear from equations (5) and (12) that it is tedious to compute the hetnet coverage probability under nearest-BS connectivity, even with numerical integration, for arbitrary fading case. With slight modifications to the approach in Theorem 1 and [14, Theorem 1], hetnet coverage probability with MBRP can also be derived. These expressions do not simplify significantly beyond that in (5) and hence is not presented here. Hence, we conduct a similar qualitative study of the hetnet performance under MBRP, as in Section IV-A.
Corollary 4.
Under MBRP connectivity, the following stochastic equivalences hold:
| (28) |
where the equivalent hetnet has BS distributions according to non-homogeneous Poisson process with density functions , , , for the open-access tiers and the closed-access tier, respectively, , transmission power of the open-access tier BSs as and unity for the closed-access tier BSs; and unity path-loss exponent for all BSs, but the fading distributions are the same as the original hetnet.
Proof.
where the serving BS’s tier-index is determined by the second event in the above expression (see (17)). Now, as in the proof of Lemma 3, using [2, Theorem 2], let us consider the set as a set of distances from the origin of tier BSs from the origin in an equivalent hetnet. Using the Marking theorem of Poisson process [30, Page 55], the equivalent hetnet is from a non-homogeneous Poisson point process with a BS density function , , as shown in Corollary 4. Further, the serving BS is the closest among all the open-access BSs of the hetnet. Finally, the tier transmit power of the equivalent system, , is obtained to ensure that the received power at the MS is stochastically equivalent to that of the original cellular system. ∎
The result is yet another application of the Marking theorem of Poisson process, and can be proved using the same techniques as developed in Lemma 3. The following result shows important characteristics of the serving BS under the MBRP case.
Lemma 5.
The probability mass function (p.m.f.) of the serving BS’s tier-index and the joint p.d.f. of the serving BS’s tier-index and distance from the MS under MBRP connectivity are
Proof.
Along the same lines as [2, Lemmas 3 and 4], the p.m.f. of the serving BS’s tier-index and the c.c.d.f. of the distance of the serving BS belonging to the open-access tier are derived below.
| (33) | |||
| (34) |
where (33) - (a) is obtained since serving BS belongs to the tier if nearest BS among all the open-access tiers in the equivalent hetnet of Corollary 4 belongs to the tier, (33) - (b) is obtained by noting that is a set of independent random variables with the p.d.f. of as , from the properties of Poisson process, and finally (34) is obtained. Using the steps in (34), (31) is derived. ∎
When , (30) and (32) reduce to [29, (3) and (4)], respectively. Deriving the coverage probability expressions for the arbitrary fading distribution case under MBRP suffers from similar analytical intractabilities as the nearest-BS case studied in Section III. Hence, we consider the special case where fading coefficients are i.i.d. unit mean exponential random variables. In [29], Jo et. al. have demonstrated that simple expressions for the hetnet coverage probability under MARP can be computed when the fading coefficients are i.i.d. exponential random variables. These results were restricted to the open-access case, and are extended for a general hetnet below.
Theorem 4.
The hetnet coverage probability under MBRP connectivity with i.i.d. exponential fading distribution at all BSs is
| (35) |
where . When and ,
| (36) |
Proof.
See Appendix -E. ∎
V Numerical Examples and Discussion
In this section, we provide some numerical examples that complement the theoretical results presented until now. We restrict ourselves to the study of a two tier hetnet consisting of the macrocell and the femtocell networks, respectively, under the max-SINR connectivity model while reminding the reader that the theory presented in this paper allows a similar analysis for arbitrary number of tiers and also carries over to the nearest-BS connectivity model. Also, please refer to Appendix -F for the algorithm to perform the Monte-Carlo simulations. For all the studies in this paper, and , where the subscripts ‘1’ and ‘2’ correspond to macrocell and femtocell networks, respectively. Further, under the closed-access BS association scheme, the MS has access to the macrocell network only.
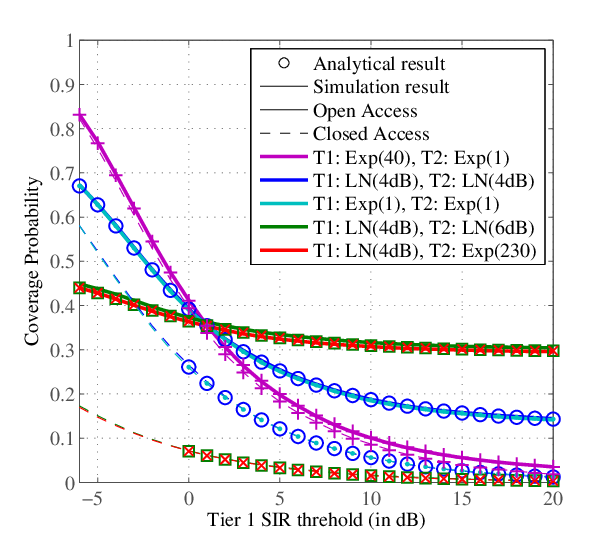


In Figures 1, 2 and 3, we study the coverage probability, coverage conditional average rate and the average fraction of users served by the macrocell network, respectively, for various configurations of shadow fading distributions at the macrocell and the femtocell BSs. Note that the expressions for the coverage conditional average rate and the average fraction of users served by the macrocell network can be found in [3, Theorems 2, 3 and 4]. In all the figures, T1 (T2) stand for tier 1, i.e. the macrocell network (tier 2, i.e. the femtocell network). Further, Exp() and LN() are abbreviations for exponential distribution with a given mean and log-normal distribution with a zero mean and standard deviation (when the random variable is expressed in dB), respectively, and they represent distribution of the shadow fading factors of the corresponding tiers.
While the expressions in Theorem 3 clearly show that a MS has a better coverage probability under open-access than closed-access, the plots in Figure 1 provides a quantitative justification for the same. The coverage probability curve corresponding to the exponential fading distribution at both the tiers 1 and 2 with means 40 and 1, respectively, also corresponds to the case where with the shadow fading factors at both the tiers being unit mean exponential distributions. The open and closed access have approximately the same coverage probabilities because the MS is almost always served by a macrocell BS, as can been seen in the corresponding curve in Figure 2. As a result, blocking access to the femtocell BSs altogether, has only a marginal influence on the coverage probability at the MS.
The two curves following the aforementioned curve in Figures 1-3 complement the fact that all the three performance metrics are identical irrespective of the distribution of the shadow fading factors, when the shadow fading factors have the same distribution across all the tiers. The last two curves in Figures 1-3 show that all the performance metrics are identical as long as the shadow fading coefficients of the corresponding tiers have the same moments. Note that is the same when has a log-normal distribution with zero mean and 6 dB standard deviation or when is an exponential random variable with mean 230.
A log-normal random variable with zero mean and a given standard deviation is a good model for shadow fading factors. Note that the femtocell network is introduced to improve the indoor performance. The shadow fading factors in the indoor environments are known to have a comparable or greater standard deviation than otherwise. Such a situation is represented by last four curves in Figures 1-3. The gap between the open and closed access coverage probability curves indicate the contribution of the femtocell network in providing coverage to the MS. It is immediately clear that the dense low-power femtocell network has a more critical role in providing coverage in realistic indoor models, when we look at the last four curves in Figures 1 and 2.
Under open-access, the coverage probability and the coverage conditional average rate (see Figures 1 and 2) for all the 5 curves mentioned above intersect when the SIR threshold for the macrocell network is equal to 1 dB. This brings us to an important point that when the SIR threshold is the same for all the tiers, these metrics become independent of the transmission power and shadow fading factors of the different tiers, and collapses to the corresponding metrics in a single-tier network with the same path-loss exponent and SIR threshold. Along the same lines, the coverage conditional average rate for a two-tier hetnet under closed-access also collapses to that of a single-tier network, and is independent of the transmission power and shadow fading factors of the different tiers.
VI Conclusions
In this paper, for the most general model of the hetnets, the downlink coverage probability and other related performance metrics such as the average downlink rate and average fraction of users served by each tier of the hetnet are characterized. Two important BS connectivity models are studied, namely, the max-SINR and the nearest-BS connectivity, respectively. Semi-analytical expressions for the hetnet coverage probability is obtained for both the cases. Further, several properties pertaining to the hetnet downlink performance are analyzed, which provide great insights about these complex networks. As an example, we identify the MIRP and MBRP connectivity models to be equivalent to the former models under certain special conditions. These models are much simpler to analyze and the results for these models expose interesting properties of the hetnet. The results in this paper greatly generalize the existing hetnet performance characterization results and are essential for better understanding of the future developments in wireless communications that are heavily based on hetnets.
-A Proof for Lemma 2
| (37) | |||
| (38) |
where is obtained by noting that is independent of the random variables and , is a direct consequence of the Campbell’s theorem [30], is a constant and , and ; is obtained since the random variables corresponding to a given tier are independent of the other tiers; is obtained by applying the Campbell’s theorem [30] to each tier of the hetnet; is obtained by changing the variable of integration from to ; is obtained by rewriting the integral in using special functions; and finally (7) is obtained by rewriting the integral in in terms of the incomplete Gamma function.
The proof for (8) follows along the same lines as above and we provide only a brief outline in (38) where the maximization in is only among the nearest BSs of the K tiers of the hetnet, is the same as in (37); is obtained by exchanging the order of expectation and product since the K tiers of the hetnet are independent of each other, and further conditioning w.r.t. the fading coefficient and the distance of the nearest BS of each tier; is obtained by applying the Campbell’s theorem to the set of tier BSs beyond , conditioned on ; is obtained by further simplifying ; and finally (8) is obtained by evaluating the expectation w.r.t. in where the p.d.f. of is , and further simplifying.
-B Proof for Lemma 3
Given a BS belonging to the open-access tier is at a distance from the origin, then, due to [2, Theorem 2], represents the distance of the BS from the origin where the BS arrangement is according to a non-homogeneous 1-D Poisson point process with BS density function , as long as , for each . Similarly, for the closed-access tier, the distance where the BS arrangement is according to a non-homogeneous 1-D Poisson point process with BS density function , as long as . This is a consequence of the Mapping theorem [30, Page 18] and the Marking Theorem [30, Page 55] of the Poisson processes. Further, since the BS arrangements in the different tiers were originally independent of each other, the set of all the BSs in the equivalent 1-D non-homogeneous Poisson process is merely the union of all By the Superposition Theorem [30, Page 16] of Poisson process, (notice that it is not conditioned on ) corresponds to the distance from origin of BS arrangement according to non-homogeneous Poisson point process with density function
In summary, we have converted the BS arrangement on a 2-D plane of hetnet to a BS arrangement of the equivalent 2-tier network along 1-D (positive x-axis), and hence, the SINR distributions of both these networks are also equivalent. Further, by our construction, the MIRP BS in the hetnet corresponds to the BS that is nearest to the origin (MS) in the equivalent 2-tier network. As a result, SINR may be written in terms of the ’s and ’s indexed in the ascending order, and we get
-C Proof for Lemma 4
The hetnet SINR under MIRP can be computed as follows. For each tier (c refers to the closed-access tier), form the set and represent as where ’s are ascendingly ordered. Now, represents the received powers of all the tier BSs in the descending order. Finally, the desired BS’s power and tier index can be easily found by identifying the maximum in the set and the SINR can be computed. Using [20, Corollary 3] which is an application of the Marking theorem [30, Page 55], it can be seen that represents the distances from origin of BSs arranged according to homogeneous Poisson point process with BS density where has the same distribution as the tier shadow fading factors. As a result, the set represents the set of received powers at the origin of the hetnet composed of open-access tiers and a closed-acess tier with BS densities , respectively, with unity transmit powers and shadow fading factors at each BS. This is equivalent to the original heterogeneous network and has the same SINR distribution, hence proving
Further, using the Superposition theorem [30, Page 16], the open-access tiers of the equivalent hetnet can be combined to form a single tier network with a BS density equal to thus proving the SINR equivalence in The distribution of SINR of this two-tier network is the same as that of an MS in another two-tier network where the open-access tier has unity BS density, the closed-access tier has a BS density , unity transmit power and shadow fading factors at all BSs and a background noise , due to [20, Lemma 3] and hence we get the relation
-D Proof for Theorem 3
From Corollary 2 and Lemma 3, we get the following stochastic equivalence:
where ’s and ’s are i.i.d. unit mean exponential random variables, , and are from non-homogeneous 1-D Poisson processes with density functions , and , respectively. The following steps derive the hetnet coverage probability and closely follows the proof techniques for [2, Theorem 4] and [25, Theorem 1]
where is the distance from the origin of an arbitrary point in the non-homogeneous Poisson process with density function , is obtained by computing the probability of w.r.t. conditioned on all the other involved random variables and noting that the two Poisson processes are independent of each other, is obtained by evaluating the inner expectations by applying Campbell’s theorem [30] (same steps as in the proof of [2, Theorem 4]) and expressing the expectation w.r.t. by the integral where is the probability that there exists a point in the interval , and finally (26) is obtained by simplifying the integral in .
-E Proof for Theorem 4
The the hetnet coverage probability is
where is from the stochastic equivalence in Corollary 4, is obtained due to the independence of each tier in the hetnet given . Now, we derive expressions for and in (b).
Finally, (35) is obtained by computing each expectation in by applying the Campbell-Mecke theorem.
-F Simulation Method
The tier of the hetnet with tiers is identified by the following set of system parameters: where the symbols have all been defined in Section II, and where is the total number of tiers. Now we illustrate the steps for simulating the hetnet in order to obtain the SINR distribution and the coverage probability assuming the MS is at the origin. The algorithm for the Monte-Carlo simulation is as follows:
1) Generate random variables according to a uniform distribution in the circular region of radius for the locations of all the tier BSs, where
3) Compute the SINR at the desired BS according to Section II-3 and record the tier index of the desired BS.
Repeat the same procedure T (typically, > 50000) times. Finally, the tail probability of SINR at is given by and the coverage probability is given by .
References
- [1] P. Madhusudhanan, J. G. Restrepo, Y. Liu, T. X. Brown, and K. Baker, “Multi-tier network performance analysis using a shotgun cellular system,” in IEEE Globecom 2011 Wireless Communications Symposium, Dec. 2011, pp. 1 –6.
- [2] P. Madhusudhanan, J. Restrepo, Y. Liu, and T. Brown, “Downlink coverage analysis in a heterogeneous cellular network,” in Global Communications Conference (GLOBECOM), 2012 IEEE, Dec 2012, pp. 4170–4175.
- [3] P. Madhusudhanan, J. G. Restrepo, Y. Liu, and T. X. Brown, “Heterogeneous cellular network performance analysis under open and closed access,” in Global Telecommunications Conference (GLOBECOM 2012), 2012 IEEE, december 2012, pp. 1 –6.
- [4] S.-P. Yeh, S. Talwar, G. Wu, N. Himayat, and K. Johnsson, “Capacity and coverage enhancement in heterogeneous networks,” Wireless Communications, IEEE, vol. 18, no. 3, pp. 32 –38, june 2011.
- [5] A. Damnjanovic, J. Montojo, Y. Wei, T. Ji, T. Luo, M. Vajapeyam, T. Yoo, O. Song, and D. Malladi, “A survey on 3GPP heterogeneous networks,” Wireless Communications, IEEE, vol. 18, no. 3, pp. 10 –21, june 2011.
- [6] A. Damnjanovic, J. Montojo, J. Cho, H. Ji, J. Yang, and P. Zong, “UE’s role in lte advanced heterogeneous networks,” Communications Magazine, IEEE, vol. 50, no. 2, pp. 164 –176, february 2012.
- [7] 4G Americas Report. (2011, February) 4G Mobile Broadband Evolution: 3GPP Release 10 and Beyond. [Online]. Available: http://www.4gamericas.org/
- [8] Qualcomm. (2010, February) LTE Advanced: Heterogeneous network. [Online]. Available: http://www.qualcomm.com/documents/files/lte-advanced-heterogeneous-networks.pdf
- [9] V. Chandrasekhar, J. Andrews, and A. Gatherer, “Femtocell Networks: A Survey,” Communications Magazine, IEEE, vol. 46, no. 9, pp. 59–67, September 2008.
- [10] X. Lagrange, “Multitier cell design,” Communications Magazine, IEEE, vol. 35, no. 8, pp. 60 –64, aug 1997.
- [11] M. Haenggi and R. K. Ganti, Interference in Large Wireless Networks. NoW Publishers Inc., 2008, vol. 3, no. 2. [Online]. Available: http://www.nd.edu/ mhaenggi/pubs/now.pdf
- [12] F. Baccelli and B. Błaszczyszyn, Stochastic Geometry and Wireless Networks, Volume I — Theory, ser. Foundations and Trends in Networking. NoW Publishers, 2009, vol. 3, No 3–4.
- [13] ——, Stochastic Geometry and Wireless Networks, Volume II — Applications, ser. Foundations and Trends in Networking. NoW Publishers, 2009, vol. 4, No 1–2.
- [14] V. M. Nguyen and F. Baccelli, “A stochastic geometry model for the best signal quality in a wireless network,” in Modeling and Optimization in Mobile, Ad Hoc and Wireless Networks (WiOpt), 2010 Proceedings of the 8th International Symposium on, 31 2010-june 4 2010, pp. 465 –471.
- [15] T. X. Brown, “Analysis and coloring of a shotgun cellular system,” Radio and Wireless Conference, 1998. RAWCON 98. 1998 IEEE, pp. 51–54, Aug 1998.
- [16] ——, “Cellular performance bounds via shotgun cellular systems,” IEEE J. Sel. Areas Commun, vol. 18, no. 11, pp. 2443–2455, Nov 2000.
- [17] J. Andrews, F. Baccelli, and R. Ganti, “A tractable approach to coverage and rate in cellular networks,” Communications, IEEE Transactions on, vol. 59, no. 11, pp. 3122 –3134, november 2011.
- [18] B. Blaszczyszyn, M. K. Karray, and H.-P. Keeler, “Using Poisson processes to model lattice cellular networks,” CoRR, 2012. [Online]. Available: http://arxiv.org/abs/1207.7208
- [19] P. Madhusudhanan, J. G. Restrepo, Y. E. Liu, and T. X. Brown, “Carrier to interference ratio analysis for the shotgun cellular system,” in IEEE Globecom 2009 Wireless Communications Symposium, Honolulu, HI, USA, November 2009.
- [20] P. Madhusudhanan, J. G. Restrepo, Y. Liu, T. X. Brown, and K. R. Baker, “Downlink performance analysis for a generalized shotgun cellular system,” CoRR, 2010. [Online]. Available: http://arxiv.org/abs/1002.3943
- [21] P. Madhusudhanan, J. G. Restrepo, Y. Liu, T. X. Brown, and K. Baker, “Stochastic ordering based carrier-to-interference ratio analysis for the shotgun cellular systems,” Wireless Communications Letters, IEEE, vol. PP, no. 99, pp. 1 –4, 2012.
- [22] S. Mukherjee, “Downlink SINR distribution in a heterogeneous cellular wireless network with biased cell association,” in IEEE ICC 2012 - 1st International Workshop on Small Cell Wireless Networks, 2012.
- [23] ——, “Distribution of downlink SINR in heterogeneous cellular networks,” IEEE Journal on Selected Areas in Communications, vol. 30, no. 3, pp. 575 –585, april 2012.
- [24] ——, “Downlink SINR distribution in a heterogeneous cellular wireless network with max-SINR connectivity,” in Communication, Control, and Computing (Allerton), 2011 49th Annual Allerton Conference on, sept. 2011, pp. 1649 –1656.
- [25] H. S. Dhillon, R. K. Ganti, F. Baccelli, and J. G. Andrews, “Modeling and analysis of K-tier downlink heterogeneous cellular networks,” IEEE Journal on Selected Areas in Communications, vol. 30, no. 3, pp. 550 –560, april 2012.
- [26] ——, “Coverage and ergodic rate in K-tier downlink heterogeneous cellular networks,” in 49th Annual Allerton Conference on Communication, Control, and Computing (Allerton), 2011, sept. 2011, pp. 1627 –1632.
- [27] H. Dhillon, R. Ganti, and J. Andrews, “A tractable framework for coverage and outage in heterogeneous cellular networks,” in Information Theory and Applications Workshop (ITA), 2011, feb. 2011, pp. 1 –6.
- [28] ——, “Load-aware modeling and analysis of heterogeneous cellular networks,” Wireless Communications, IEEE Transactions on, vol. 12, no. 4, pp. 1666–1677, April 2013.
- [29] H.-S. Jo, Y. J. Sang, P. Xia, and J. Andrews, “Heterogeneous cellular networks with flexible cell association: A comprehensive downlink sinr analysis,” Wireless Communications, IEEE Transactions on, vol. 11, no. 10, pp. 3484–3495, October 2012.
- [30] J. F. C. Kingman, Poisson Processes (Oxford Studies in Probability). Oxford University Press, USA, January 1993.