The behavior of f-levels in HCP and BCC rare-earth elements in the ground state and in XPS and BIS spectroscopy from density-functional theory.
Abstract
The electronic structures of rare-earth elements in the HCP structure, and Europium in the BCC structure, are calculated by use of density-functional theory, DFT. Simulation of X-ray photoemission spectroscopy (XPS) and bremsstrahlung isochromatic spectroscopy (BIS) are made within DFT by imposing that f-electrons are excited by a large photon energy, either by removing from the occupied states in XPS, or by adding to the unoccupied f-states in BIS. The results show sizable differences in the apparent position of the f-states compared to the f-band energy of the ground states. This result is fundamentally different from calculations assuming strong on-site correlation since all calculations are based on DFT. Spin-orbit coupling and multiplet splittings are not included. The present simulation accounts for almost half of the difference between the f-level positions in the DFT ground states and the observed f-level positions. The electronic specific heat at low is compatible with the DFT ground state, where f-electrons often reside at the Fermi level.
pacs
71.20.Eh, 71.28.+d, 79.60.-iI Introduction
Partially filled f-orbitals are predicted by the density-functional theory (DFT) for the ground state to be contained in narrow bands with a high density-of-states (DOS) at the Fermi energy . The fact that the -transition in fcc Ce can be described quite accurately by temperature dependent DFT calculations in which vibrational, electronic and magnetic free energies are taken into account [1], shows that DFT is more reliable than what can be expected for f-electron systems. However, spectroscopic signatures of f bands are often found several eV’s above or below the depending on the nature of the spectroscopy [2], and the main weight is not the Fermi energy , as DFT predicts for the ground state in most of the rare-earths. Atomic calculations with imposed occupations of the 4f-orbitals [3, 4], based on the assumption of strong electronic correlations among localized electrons, have been used for interpretation of spectroscopic data [2, 5]. Atomic levels are split and disconnected from by the on-site correlation, represented by a Hubbard parameter , but fundamental questions arise about what happens when the f-electrons form bands in metallic solids, and about the real nature of the ground state. These problems may be elucidated by a DFT approach [6], which is tailored for the precise spectroscopic probe by including relaxation energies relevant for excitations between occupied and empty bands. The calculations are in the spirit of the final state rule (FSR), which basically assumes that a system can relax around its final state configuration before the emission/absorption of a photon [7].
In the present work we apply the relaxation approach [6] to several of the 4f-electron rare-earth (RE) lanthanides in order to search for a physically acceptable description of X-ray photoemission spectroscopy (XPS) and bremsstrahlung isochromat spectroscopy (BIS). We are not seeking for an agreement with measured intensities, since inclusion of matrix elements, multiplets and spin-orbit (SO) interaction would be needed for that. But we determine the energy renormalization of the f-bands in order to see if they can lead to a better reconciliation between the DFT ground state band positions and the center of gravity of the spectroscopic f-band peaks. The goal is to apply a similar method as the method used for excitations of core electrons, where the threshold energies in X-ray absorption spectroscopy (XAS) are much improved over unrelaxed core level energies in metal silicates [8]. The excited core electron is in those XAS calculations added to the valence electrons, leaving a core hole behind. However, core electrons are localized and atomic-like methods can be applied. Here, in the present approach for XPS and BIS further considerations are needed for transitions between delocalized and hybridized valence states and the continuum at energies of the order above .
From the results of this work it is suggested that DFT is essentially correct for 4f-levels in RE elements, but that spectroscopic data have been interpreted incorrectly about the signatures of the f-band centers far from . Correlation in the ground state is not the source of seeing f-levels far form , but screening in the excitation process makes it look that way. This conclusion is corroborated by electronic specific heat calculations, which are compatible with experiments if the f-DOS is large at .
An outline of this paper is as follows. In Sec. II, we present the details of the DFT computations and total energies for ground state and excited state configurations. The results of the calculations are presented and compared with experimental results in Sec. III, together with the results of electronic specific heat calculations. The conclusions are given in Sec. IV.
II Method of calculation
Self-consistent density-functional Linear Muffin-Tin Orbital (LMTO) band calculations [9] are made for the ground state and exited states in hcp and bcc rare-earth elements using potentials based on the local spin-density approximation, LSDA [10]. The excited states involve the localized 4f states, and in order to avoid interaction between excitations on neighboring atoms we consider 16 atom supercells where only one atom is excited. The 16 atom supercells are made by doubling the ordinary hcp unit cell and the cubic bcc double cell in each direction (), respectively. The self-consistent convergence is obtained using a mesh of 30 or 35 k-points within the irreducible Brillouin zones corresponding to hcp or bcc 16-atom supercells, respectively. The c/a ratio is taken to be the same for all hcp structures, 1.59, which is a fair average for the different systems. The lattice constants for each system are close to the experimental ones given in ref. [11]. The complex structure of Sm and the fcc structure Yb are approximated by the hcp structure in these calculations. It is not expected that the excitation energies depend strongly on the c/a-ratios or the exact structures. However, as will be discussed, the excitations depend much on the f-band occupation and spin polarization. All calculations are spin-polarized. The deep 5p states are always included as band states. Together with the 4f-states they are very localized with narrow band widths. The LMTO linearization energies are chosen within the band region, i.e. with negative logarithmic derivatives. Self-consistency is more delicate than usual because of the removal/addition of electrons within the narrow bands. The remaining f-bands on the excited atom are sometimes moving in energy during the iterations, and the linearization energy is then adjusted to follow the f-band center. The method of calculation is close to what has been used earlier for the Nd-f band in electron doped Nd2CuO4 [6]. Calculations are made where a fraction () of an electron is excited in order to focus on excitations from precise peaks in the DOS. A high precision of the calculated total energies, , is needed, and the relaxation energies, , are defined per excited electron as . Non-linearities can appear if band edges interfere near for large . Because of small technical differences between the computation codes for excited and ground state configurations, it is more precise to calculate the the total energies for the ground state, , as for directly from the excited state code.
Relaxation for excitations involving localized f-electrons is expected to be more important than for excitations of itinerant electrons. The reason is the different radial shapes between f-states and itinerant states. High-energy final states are itinerant, so transitions to/from a localized f-state implies important reshaping of the charges, while this is not so for transitions to/from a state which already is delocalized. Thus, the charge is (in XPS) removed at an energy within the occupied 4f majority state on one of the atoms and is spread out uniformly over the cell to account for a final state at high energy [12]. The difference in total energy between this state and the ground state defines the relaxation energy, . Thus the final state XPS image will appear to have its f-peak shifted by an amount with respect to the Fermi level. The excitation energy according to the Koopmans approximation [13] would be the difference in ground state energy levels. For instance in XPS would be equal to , where and are the ground state band energies for the final and initial states, respectively. The latter are the calculated LMTO eigenvalues, but the energies are too large to be calculated by the LMTO code. However, the density of energy levels at such high energy is large enough so that a final state energy level can always be found, independent of k-point conservation [14]. Therefore, the Koopmans approximation would simply mean that the XPS spectrum would look like the occupied ground state DOS (all states shifted equally by ). The renormalized excitation energy is corrected by the relaxation energy, . Thus, according to the FSR there is time for the system to relax around the missing f-electron before the excited electron can enter a level at high energy. The photon energy , corrected by the relaxation energy , will be given to the electron.
In the XPS excited state simulation, the fractional electron charge is removed from the local DOS on one site . This charge defines an energy interval [] on the local DOS;
| (1) |
where is the DOS on the site of character .
This charge is distributed uniformly within the entire unit cell, of volume , in form of a charge density . The justification for this is that for a very high excitation energy as for XPS, , it is possible to ignore the crystal potential in comparison to [14], when the Schrödinger equation
| (2) |
is simplified to
| (3) |
where the free-electron solutions have a constant density.
The total charge density for the excited state is then;
| (4) |
where are the radial wave functions and . The total energy , where the Coulomb energy and exchange-correlation energy are calculated using the constrained density from eq. 4 and kinetic energy is:
The self-consistent field (SCF) iterations are repeated while keeping the [] interval at the 4f band until the total energy is converged. The energy interval [] is narrow in all rare-earth elements because of their high 4f-band DOS. The removed charge is mostly of pure f-character, because the f-DOS is much larger than other -DOS (exceptions are Yb and Lu, where 5p is in the same energy range as 4f). The SCF procedure with excitation is less stable than for ordinary ground state calculations, and it is often difficult or slow to achieve convergence.
The method for the inverse procedure, for BIS, is modified so that the fraction of an electronic charge is added within an energy interval in the empty 4f band above , and the compensating charge density is removed everywhere. No BIS calculations were made for Yb and Lu, since they have no empty f-states. All other elements have empty f-states in the minority bands for which calculations are made. For XPS only calculations for excitations from the majority spins were considered here.
III Results
III.1 Ground state
Results from the ground state calculations are summarized in Table I and Figures 1-3. Several band calculations are found in the literature for Gd [15, 16, 17, 18], where the accuracy of LSDA potentials and the sensitivity to basis functions are discussed. The present result agree well with the other calculations without SO-coupling concerning the f-band positions and the band widths. It is difficult to obtain good values for the f-band energies, and the f-levels are often treated separately from the valence electrons, as in calculations for Sr and Yb [19].
The high -values for Pr, Nd and Sm show that crosses the f-band. For Tb, Dy, Ho, Er and Tm the Fermi levels cross the minority band, as can be concluded from their high -values. The bottom of the minority band in Gd is very near , and its -value is only moderately large. The partial occupations of majority/minority bands explain the variation of spin moments among the different RE elements. The magnetic moments follow closely Hund’s first rule. For instance, all f-electrons are polarized in Eu and Gd, and . The majority and minority bands in Yb and Lu are degenerate and completely filled, with no exchange splitting and no moment.


| RE (str.) | ||||||||
|---|---|---|---|---|---|---|---|---|
| Pr (hcp) | 3.67 | 11 | 2.49 | 2.66 | -0.2 | 1.5 | 10.9 | 1.0 |
| Nd (hcp) | 3.66 | 12 | 3.64 | 4.03 | -0.3 | 2.2 | 15.4 | 0.24 |
| Sm (hcp) | 3.67 | 14 | 5.86 | 6.26 | -0.4 | 3.5 | 14.1 | 0.32 |
| Eu (bcc) | 4.58 | 15 | 6.94 | 7.23 | -0.9 | 3.8 | 0.67 | 0.45 |
| Gd (hcp) | 3.63 | 16 | 7.31 | 6.95 | -4.2 | 0.4 | 0.63 | 1.92 |
| Tb (hcp) | 3.60 | 17 | 8.45 | 5.58 | -3.8 | 0.2 | 0.55 | 6.54 |
| Dy (hcp) | 3.59 | 18 | 9.59 | 4.40 | -3.2 | 0.2 | 0.65 | 15.3 |
| Ho (hcp) | 3.58 | 19 | 10.72 | 3.19 | -2.4 | 0.1 | 0.48 | 28.0 |
| Er (hcp) | 3.56 | 20 | 11.82 | 2.04 | -1.7 | 0.1 | 0.22 | 34.2 |
| Tm (hcp) | 3.54 | 21 | 12.89 | 0.96 | -0.8 | 0.1 | 0.29 | 19.5 |
| Yb (hcp) | 3.91 | 22 | 14.00 | 0.0 | -9.3 | 0.0 | 0.53 | 0.53 |
| Lu (hcp) | 3.50 | 23 | 14.00 | 0.0 | -13.5 | 0.0 | 0.41 | 0.41 |
III.2 Energy renormalization
The results of the XPS and BIS excitation energy per electron are given in Table 2 and reproduce similar trends to those given in Ref. [6] for Nd2-xCexCuO4. The important reference for experimental comparison is the work by Lang et al [2], which provides detailed information about the measured XPS and BIS intensities in the RE-elements, as well as numbers for what they believe are due to correlation. In Fig. 4 is a summary of the combined XPS and BIS simulations with comparison to experimental values of [2].
A large part of the energy renormalization is seen directly in the kinetic term. The remaining non-excited f-electrons on the atom involved in the XPS process are typically moving closer to and thereby modifying the total energy. The energy of the excited electron will mostly be modified downwards compared to what the Koopmans result would give (see Figures 5 and 6). There is a reduction of the Coulomb and exchange-correlation energies because of the screening of the hole. From the values of it seems as if the f-electrons were more bound, being deeper in energy, compared to what would be expected from the ground state DOS and the Koopmans theorem. Exceptions to this are Eu, Yb and Lu, where the f-bands (majority or both) are filled. The minority f-band well above in Eu is empty, and cannot do screening of the induced hole in the majority band. In Yb and Lu both f-bands are filled, and screening is also limited. Hence, the f-band of the remaining electrons move more easily in energy, and in the end it seems as if the f-band move upwards in the three materials. The renormalization appears too large in Eu, or the LSDA puts its ground state f-level too high in energy. The feasibility to describe localized f-bands by LSDA have not been much tested because of the discrepancies between bands, spectroscopy and presumed correlation.
The situation in Gd might be expected to be similar, but its minority f-band is somewhat occupied, and screening is possible where a fraction of a minority f-electron replaces the hole in the majority band. The trend for Gd and the other RE elements are the same. The measured XPS intensities in Gd (and Eu) [2] are quite narrow (of the order eV) due to the absence of large multiplet/SO-splittings, and they are easier to compare with the calculations. The addition of the band energy in Table 1, -4.2 eV, and the relaxation energy eV in Table 2, puts the observed f-band at about -6 eV, which is in better agreement with the measured peak at -8 eV [2] than the ground state energy. In Eu the correction of relaxation is positive and puts the peak even above , while the only positive corrections for other elements, in Yb and Lu, makes the agreement with experiment better (bands at -9.3 and -13.5 are corrected upwards to about -7 and -10 eV, while experimentally they are found as SO-splitted peaks at -2 and -8 eV, respectively). The measured spectra for the other elements are wider. Nevertheless, there are clearly improved comparisons between the relaxed band positions and the band centers called extracted from experiments [2], for Dy through Tm (-5.3, -4.2, -4 and -5 eV, compared to -3.2, -2.4, -1.7 and -0.8 eV without relaxation correction, and -3.9, -4.9, -4.7 and -4.6 eV from experiment [2]). The corrections for the light elements (Pr, Nd, Sm) are not large, which suggests that a break in intensity should be found close to . Such breaks are seen in the the XPS intensities, even if the main multiplet peaks are found at lower energy [2].
The total energy changes in the BIS process are in general smaller than for XPS. There are upward renormalizations of the empty f-bands, which however are quite small in comparison to the energy of the f-band itself. The observed peaks near 1 and 4 eV in Sm [2], agree well with the corrected majority and minority band centers, while for Pr and Nd the energy renormalization is underestimated. Gd has the largest correction, and suggests a peak at 3 eV above (instead of about 0.5 eV for the band), compared to the BIS-observation at 4 eV [2]. The observed positions for the elements Tb through Tm, summarized by the -parameters in ref. [2], go roughly from 2.8 for Tb to 1.1 eV for Tm. The calculations show the same relative trend, but with smaller amplitude, from 1 to 0.2 eV.

Inspections of the measured XPS and BIS intensities show more or less sharp Fermi surface breaks for all elements, even if many high-intensity peaks are not close to [2]. This is a hint that some f-electrons are near , and that the experimental information is hardly contained in single -parameters. Nevertheless, Lang et al [2] listed what they call correlation energies () as being the difference between the peak positions in XPS () and BIS (). However, quite comparable -values can be seen from the uncorrelated LDA bands shown in Figs. 1-3. In fact, the peak-to-peak energies of the ground state bands correspond to the exchange splitting of the f-bands, since the energies generally come from differences between majority and minority bands. Therefore, it is not correct to assign the difference in peak positions as coming from correlation, at least not beyond what is already included in LDA. A better agreement with the observed is obtained when the XPS and BIS relaxation energies of Table 2 are added to the peak energies of the ground state calculations, see Fig 4, even though the comparison is hampered by the absence of SO and multiplet configurations.

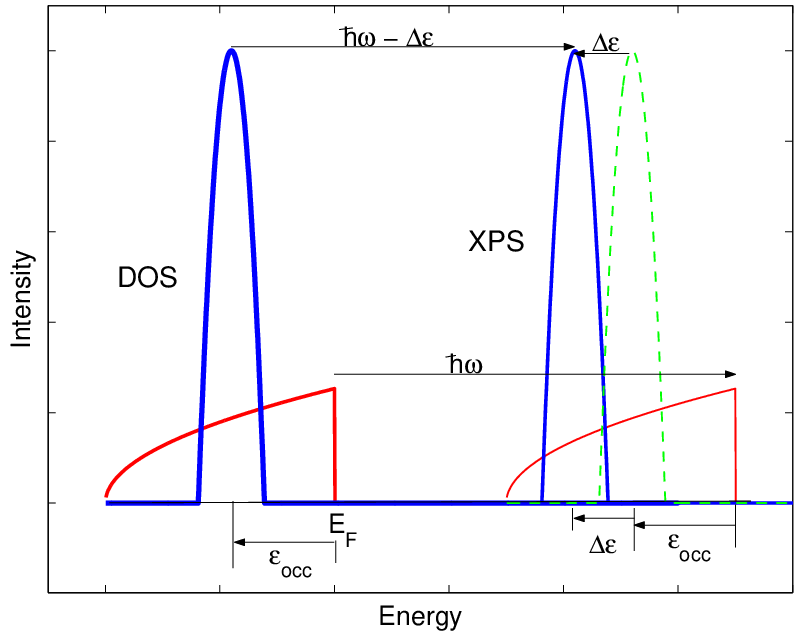
Calculations of on-site correlation have been done by forcing an additional electron to (or removed from) a f-level, in so-called constrained density-functional calculations [20, 21, 22, 23]. The total energy differ typically by 5-10 eV or even more from that of the ground state in such non-equilibrium calculations, and this energy difference is often used as an -value of correlation. It is tempting to take the peak-to-peak positions as an experimental value of , since they are of the same order as the constrained DF values. However, as was discussed above, the origin of the peak-to-peak difference has very little to do with strong on-site correlation. As indicated schematically in Fig. 6 the f-band is already below (by ) in many RE metals. Moreover, DFT includes correlation for the electron gas, where it is relatively more important at low densities. On-site correlation can also be questioned from other points of view [24]. On the other hand, the constrained DF-calculations of are technically made in a somewhat similar way as in the present work; An electron is forced to go into a non-equilibrium level, and differences in total energy are the key parameters. But, the present method is tailored to the spectroscopic method, and screening reduces the total energy differences to what is shown in Table 2 for and . As seen, the values are usually 1-2 eV and never larger than 5 eV.
| RE (str.) | |||||
|---|---|---|---|---|---|
| Pr (hcp) | -0.5 | 0.4 | 12 | 11 | 11 |
| Nd (hcp) | -0.3 | 0.3 | 16 | 13 | 24 |
| Sm (hcp) | -0.1 | 0.1 | 14 | 9.5 | 5.2 |
| Eu (bcc) | 1.4 | 0.3 | 1.2 | 1 | 5.1 |
| Gd (hcp) | -1.6 | 1.5 | 2.5 | 2.8 | 1.9 |
| Tb (hcp) | -2.9 | 0.7 | 7.1 | 12 | 4.4 |
| Dy (hcp) | -2.1 | 0.5 | 16 | 18 | 7.6 |
| Ho (hcp) | -1.8 | 0.3 | 28 | 19 | 21 |
| Er (hcp) | -2.3 | 0.2 | 34 | 18 | - |
| Tm (hcp) | -4.2 | 0.1 | 20 | 10 | 9.5 |
| Yb (hcp) | 1.7 | - | 1.1 | 1 | 1.2 |
| Lu (hcp) | 3.2 | - | 0.8 | 1 | 4.2 |
III.3 Electronic specific heat
The total free energy at elevated , , needs in principle also excited state corrections. However, the state at a moderate is very close to the true ground state at , because the excitations given by the Fermi-Dirac distribution are on a very small energy scale. The -character of levels being occupied just above is almost identical as in the levels of the removed electron just below . (This is very different from spectroscopy, where high-energy dipole transitions are made between initial and final states.) In the spirit of no excited state corrections, we will compare calculated and measured heat capacities in order to search for evidence of f-electrons at .
The electronic free energy is at low essentially a quadratic function of , and the heat capacity, varies linearly with and can be extrapolated down to to get the coefficient . The relation to the DOS is given by [11]
| (5) |
The electron-phonon coupling or other many-body interactions such as spin fluctuations, can enhance the heat capacity, although usually not drastically. The electron-phonon coupling is not calculated here. Lattice disorder, due to phonons and zero-point motion (ZPM) of the atoms in the lattice, has an effect of smearing of the DOS [25, 26, 27, 28, 29]. The cause is mainly coming from the Madelung term of the potential. This part of the potential is identical for all unit cells in a perfectly ordered lattice, but the symmetry is broken in the disordered lattice so that different sites have slightly different potential, which also vary in time. The potential is a classical quantity. Electronic states, obtained from quantum mechanics, depend on the classical potential and hence they depend on disorder [25]. This effect is often neglected although it can largely modify -dependent properties. Here, for very narrow f-states at , the result would be a smearing of fine details of already at small due to ZPM. A proper calculation of the quantitative smearing due to disorder is complicated and is out of the scope of this work. However, we will extract the electronic specific heat coefficients from the calculated variation of . These calculations are made for smaller (2 atom) cells. The results confirm that is close to a quadratic dependence of ; , where depending on the material. Deviations from the parabolic behavior are coming from the sharp variations of near , and from -variations of charges and spin.
The DOS near varies rapidly with energy when the f-bands are at the Fermi level. By using 2 mRy in the Fermi-Dirac function it is possible to simulate a DOS-smearing as for ZPM at low [30]. Thus, where the difference in total energy is calculated selfconsistently in temperature intervals up to . This procedure smears out noise in the average around , and includes contributions from possible changes in charge and spin as function of . The averages are sometimes different from the band DOS itself, (cf. Table II), because of small peaks/dips that are smeared out by disorder and imperfections in real lattices. Thus is probably more reliable than in Table II. The only cases where is better are for materials with low , because then the DOS has no peaks/dips at , and the calculation of and is less precise.
The results and comparison with experiment are shown in Table II. The calculated values are in general comparable with the observed values [31, 32, 33]. There is no general trend that the f-bands in the ground states should be far away from , since all then would be of the same order as for Eu, Yb or Lu. The calculated f-bands are mostly too narrow, since no SO or multiplet structures are taken into account. This explains why the calculated DOS and ’s are generally somewhat large in comparison with experiment. But it is interesting to note that none of the calculated values is by far too large compared to observation, which would have been the case if the band calculation incorrectly had put f-electron states at . For instance, Table II shows that without f-electrons at one expects that 1 , but when are 10-15 times larger one can assume that the f-band is at for such RE. Only Eu, Gd, Yb and Lu have both spin f-bands away from in the DFT ground states, and their measured ’s are also smallest among these RE elements. The highest ’s are measured for Nd and Ho, which also have large calculated . Eu is unique with a calculated significantly smaller than from experiment. The reason could be that SO-coupling in combination with a majority f-band rather close to brings more states to the Fermi level. In general there is a good correlation between measured ’s and calculated even though enhancing effects of are neglected. Such enhancements should improve the comparison with experiment in the RE without f-electrons at (Gd, Yb and Lu). It is not clear why large ’s seem not to be needed for the other RE metals with high DOS at . The large for most RE elements are compatible with f-electrons (without large enhancements) at the Fermi level of the ground state.
IV Conclusion
Observed energy differences in peak-to-peak positions in XPS and BIS spectra are not measuring on-site correlation , because the DFT ground state positions of the f-bands depend more on exchange splitting and conventional potential terms. A reasonable comparison can already be made between observed XPS and BIS intensities and f-band energies of the DFT ground state. For instance, the majority f-bands in Pr, Nd and Sm cross , and discontinuities are seen at in the spectra. Relaxation effects, calculated for the proper mechanisms of the spectroscopic method, will in general improve the comparison with experiment by lowering the energies of the XPS peaks and move BIS peaks to higher energy. The effect is strongest for the bands that do not cross , and improves considerably the comparison between theoretial and observed band centers, at least from what can be concluded from the band results without SO coupling and multiplets.
Further improvements of the method, like representing the high energy state by a band state instead of the completely delocalized free-electron state, would normally improve XPS results, since the total energy should be able to relax to a lower value. It has not been tested if potential corrections based on the generalized gradient approximation [34] can lead to improvements for the excited states. Ground state properties are usually improved by using GGA, as least for transition metals [35].
Electronic specific heat data compare reasonably well with the DFT results for the ground states, i.e. where large contributions come from high f-electron DOS at the Fermi level. This implies, together with the spectroscopic data, that unfilled f-electron bands cross , but that they may appear broadened and shifted away from by the experimental probe. Even if f-electrons have a large DOS at , as in DFT bands, it is not clear that they should be determining for the electric resistivity, because of their low Fermi velocity. Scattering mechanisms also make this problem complex. At this point we conclude that f-electron energies are easily renormalized in the spectroscopic process, and that standard LSDA band structures compare reasonably well with electronic specific heat data at low of RE elements. Additional strong on-site correlation energy shifts, of the order 5-10 eV, of the f-bands would destroy the agreement. Detailed comparisons between bands and spectroscopies require energy renormalizations and matrix elements in addition to SO-coupling and multiplets. Other corrections to DFT potentials are needed for an understanding of metal-insulator transitions and anti-ferromagnetism, like in the undoped cuprates [36]. Solutions to such problems are not proposed here.
I acknowledge useful discussions with B. Barbiellini.
References
- [1] T. Jarlborg, E.G. Moroni and G. Grimvall, Phys. Rev. B 55, 1288, (1997).
- [2] J.K. Lang, Y. Baer and P.A. Cox, J. Phys. F11, 121 (1981).
- [3] J.F. Herbst, R.E. Watson and J.W. Wilkins, Phys. Rev. B 17, 3089 (1978).
- [4] B. Johansson, Phys. Rev. B 20, 1315 (1979).
- [5] D. van der Marel and G.A. Sawatzky, Phys. Rev. B 37, 10674 (1988).
- [6] T. Jarlborg, B. Barbiellini, H. Lin, R.S. Markiewicz and A. Bansil, Phys. Rev. B84, 045109, (2011).
- [7] L. Hedin, J. Phys. (Paris) Colloq. 39, C4-103, (1978); U. von Barth and G. Grossmann, Solid State Commun. 32, 645, (1979).
- [8] P. Lerch, T. Jarlborg, V. Codazzi, G. Loupias and A.M. Flank, Phys. Rev. B45, 11481 (1992).
- [9] O.K. Andersen, Phys. Rev. B12, 3060 (1975); B. Barbiellini, S.B. Dugdale and T. Jarlborg, Comput. Mater. Sci. 28, 287 (2003).
- [10] W. Kohn and L.J. Sham, Phys. Rev. 140, A1133 (1965); O. Gunnarsson and B.I Lundquist, Phys. Rev. B 13, 4274 (1976).
- [11] C. Kittel, ”Introduction to Solid State Physics” 4th Ed. Wiley, New York, (1971).
- [12] The energy of the final state is not defined precisely, it just has to be high above , at .
- [13] T. Koopman, Physica 1, 104, (1933).
- [14] T. Jarlborg and P.O. Nilsson, J. Phys. C 12, 265 (1979).
- [15] J. Sticht and J. Kübler, Solid state Commun. 53, 529 (1985).
- [16] W.M. Temmerman and P.A. Sterne, J. Phys.: Cond. Matt. 2, 5529 (1990).
- [17] D.J. Singh, Phys. Rev. B44, 7451 (1991).
- [18] D.M. Bylander and L. Kleinman, Phys. Rev. B49, 1608 (1994).
- [19] Y. Kubo, J. Phys.: Metal Phys. 17, 383 (1987).
- [20] P.H. Dederichs, S. Blügel, R. Zeller and H. Akai, Phys. Rev. Lett. 53, 2512 (1982).
- [21] A.K. McMahan, R.M. Martin and S. Satpathy, Phys. Rev. B38, 6650 (1988).
- [22] M.S. Hybertsen, M. Schlüter and N.E. Christensen, Phys. Rev. B39, 9028 (1988).
- [23] I. Schnell, G. Czycholl and R. C. Albers, Phys. Rev. B65, 075103 (2002).
- [24] R. C. Albers, N. E. Christensen and A. Svane, J. Phys.: Condens. Matter 21, 343201 (2009).
- [25] T. Jarlborg, Phys. Rev. B59, 15002, (1999).
- [26] P. Pedrazzini, H. Wilhelm, D. Jaccard, T. Jarlborg, M. Schmidt, M. Hanfland, L. Akselrud, H.Q. Yuan, U. Schwarz, Yu. Grin and F. Steglich, Phys. Rev. Lett. 98, 047204, (2007).
- [27] O. Delaire, K. Marty, M.B. Stone, P.R. Kent, M.S. Lucas, D.L. Abernathy, D. Mandrus, and B.C. Sales, PNAS 108, 4725, (2011).
- [28] X. Gonze, P. Boulanger and M. Côté, Ann. Phys. 523, 168, (2011).
- [29] T. Jarlborg, P. Chudzinski and T. Giamarchi, Phys. Rev. B85, 235108, (2012).
- [30] T. Jarlborg, Phys. Rev. Lett. 77, 3693 (1996).
- [31] J.A. Morrison and D.M.T. Newsham, J. Phys. C1, 370 (1968).
- [32] R.W. Hill, S.J. Collocot, K.A. Gschneider and F.A. Schmidt, J. Phys F: Metal Phys. 17, 1868, (1987).
- [33] There is a certain spread among the observed values. Measured by Lounasmaa et al are generally considerably smaller, see references in ref. [31].
- [34] J.P. Perdew and Y. Wang, Phys. Rev. B33, 8800, (1986).
- [35] B. Barbiellini, E.G. Moroni and T. Jarlborg, J. Phys.: Condens. Matter 2, 7597 (1990).
- [36] T. Jarlborg, J. Phys.: Cond. Matter 16, L173 (2004).