What is Tumblr: A Statistical Overview and Comparison
Abstract
Tumblr, as one of the most popular microblogging platforms, has gained momentum recently. It is reported to have 166.4 millions of users and 73.4 billions of posts by January 2014. While many articles about Tumblr have been published in major press, there is not much scholar work so far. In this paper, we provide some pioneer analysis on Tumblr from a variety of aspects. We study the social network structure among Tumblr users, analyze its user generated content, and describe reblogging patterns to analyze its user behavior. We aim to provide a comprehensive statistical overview of Tumblr and compare it with other popular social services, including blogosphere, Twitter and Facebook, in answering a couple of key questions: What is Tumblr? How is Tumblr different from other social media networks? In short, we find Tumblr has more rich content than other microblogging platforms, and it contains hybrid characteristics of social networking, traditional blogosphere, and social media. This work serves as an early snapshot of Tumblr that later work can leverage.11 1 This paper will be officially published on SIGKDD Explorations 2014, please cite official version.22 2 This work is also reported by MIT Technology Review at http://www.technologyreview.com/view/525966/the-anatomy-of-a-forgotten-social-network/
Introduction
Tumblr, as one of the most prevalent microblogging sites, has become phenomenal in recent years, and it is acquired by Yahoo! in 2013. By mid-January 2014, Tumblr has 166.4 millions of users and 73.4 billions of posts33 3 http://www.tumblr.com/about. It is reported to be the most popular social site among young generation, as half of Tumblr’s visitor are under 25 years old44 4 http://www.webcitation.org/64UXrbl8H. Tumblr is ranked as the 16th most popular sites in United States, which is the 2nd most dominant blogging site, the 2nd largest microblogging service, and the 5th most prevalent social site55 5 http://www.alexa.com/topsites/countries/US. In contrast to the momentum Tumblr gained in recent press, little academic research has been conducted over this burgeoning social service. Naturally questions arise: What is Tumblr? What is the difference between Tumblr and other blogging or social media sites?
Traditional blogging sites, such as Blogspot66 6 http://blogspot.com and LivingSocial77 7 http://livesocial.com, have high quality content but little social interactions. Nardi et al. [\citeauthoryearNardi et al.2004] investigated blogging as a form of personal communication and expression, and showed that the vast majority of blog posts are written by ordinary people with a small audience. On the contrary, popular social networking sites like Facebook88 8 http://facebook.com, have richer social interactions, but lower quality content comparing with blogosphere. Since most social interactions are either unpublished or less meaningful for the majority of public audience, it is natural for Facebook users to form different communities or social circles. Microblogging services, in between of traditional blogging and online social networking services, have intermediate quality content and intermediate social interactions. Twitter99 9 http://twitter.com, which is the largest microblogging site, has the limitation of 140 characters in each post, and the Twitter following relationship is not reciprocal: a Twitter user does not need to follow back if the user is followed by another. As a result, Twitter is considered as a new social media [\citeauthoryearKwak et al.2010], and short messages can be broadcasted to a Twitter user’s followers in real time.
Tumblr is also posed as a microblogging platform. Tumblr users can follow another user without following back, which forms a non-reciprocal social network; a Tumblr post can be re-broadcasted by a user to its own followers via reblogging. But unlike Twitter, Tumblr has no length limitation for each post, and Tumblr also supports multimedia post, such as images, audios or videos. With these differences in mind, are the social network, user generated content, or user behavior on Tumblr dramatically different from other social media sites?
In this paper, we provide a statistical overview over Tumblr from assorted aspects. We study the social network structure among Tumblr users and compare its network properties with other commonly used ones. Meanwhile, we study content generated in Tumblr and examine the content generation patterns. One step further, we also analyze how a blog post is being reblogged and propagated through a network, both topologically and temporally. Our study shows that Tumblr provides hybrid microblogging services: it contains dual characteristics of both social media and traditional blogging. Meanwhile, surprising patterns surface. We describe these intriguing findings and provide insights, which hopefully can be leveraged by other researchers to understand more about this new form of social media.
Tumblr at First Sight
Tumblr is ranked the second largest microblogging service, right after Twitter, with over 166.4 million users and 73.4 billion posts by January 2014. Tumblr is easy to register, and one can sign up for Tumblr service with a valid email address within 30 seconds. Once sign in Tumblr, a user can follow other users. Different from Facebook, the connections in Tumblr do not require mutual confirmation. Hence the social network in Tumblr is unidirectional.
Both Twitter and Tumblr are considered as microblogging platforms. Comparing with Twitter, Tumblr exposes several differences:
- •
There is no length limitation for each post;
- •
Tumblr supports multimedia posts, such as images, audios and videos;
- •
Similar to hashtags in Twitter, bloggers can also tag their blog post, which is commonplace in traditional blogging. But tags in Tumblr are seperate from blog content, while in Twitter the hashtag can appear anywhere within a tweet.
- •
Tumblr recently (Jan. 2014) allowed users to mention and link to specific users inside posts. This @user mechanism needs more time to be adopted by the community;
- •
Tumblr does not differentiate verified account.

Specifically, Tumblr defines 8 types of posts: photo, text, quote, audio, video, chat, link and answer. As shown in Figure 1, one has the flexibility to start a post in any type except answer. Text, photo, audio, video and link allow one to post, share and comment any multimedia content. Quote and chat, which are not available in most other social networking platforms, let Tumblr users share quote or chat history from ichat or msn. Answer occurs only when one tries to interact with other users: when one user posts a question, in particular, writes a post with text box ending with a question mark, the user can enable the option for others to answer the question, which will be disabled automatically after 7 days. A post can also be reblogged by another user to broadcast to his own followers. The reblogged post will quote the original post by default and allow the reblogger to add additional comments.
Figure 2 demonstrates the distribution of Tumblr post types, based on 586.4 million posts we collected. As seen in the figure, even though all kinds of content are supported, photo and text dominate the distribution, accounting for more than of the posts. Therefore, we will concentrate on these two types of posts for our content analysis later.

Since Tumblr has a strong presence of photos, it is natural to compare it to other photo or image based social networks like Flickr1010 10 http://flickr.com and Pinterest1111 11 http://pinterest.com. Flickr is mainly an image hosting website, and Flicker users can add contact, comment or like others’ photos. Yet, different from Tumblr, one cannot reblog another’s photo in Flickr. Pinterest is designed for curators, allowing one to share photos or videos of her taste with the public. Pinterest links a pin to the commercial website where the product presented in the pin can be purchased, which accounts for a stronger e-commerce behavior. Therefore, the target audience of Tumblr and Pinterest are quite different: the majority of users in Tumblr are under age 25, while Pinterest is heavily used by women within age from 25 to 44 [\citeauthoryearMittal et al.2013].
We directly sample a sub-graph snapshot of social network from Tumblr on August 2013, which contains 62.8 million nodes and 3.1 billion edges. Though this graph is not yet up-to-date, we believe that many network properties should be well preserved given the scale of this graph. Meanwhile, we sample about 586.4 million of Tumblr posts from August 10 to September 6, 2013. Unfortunately, Tumblr does not require users to fill in basic profile information, such as gender or location. Therefore, it is impossible for us to conduct user profile analysis as done in other works. In order to handle such large volume of data, most statistical patterns are computed through a MapReduce cluster, with some algorithms being tricky. We will skip the involved implementation details but concentrate solely on the derived patterns.


Most statistical patterns can be presented in three different forms: probability density function (PDF), cumulative distribution function (CDF) or complementary cumulative distribution function (CCDF), describing , and respectively, where is a random variable and is certain value. Due to the space limit, it is impossible to include all of them. Hence, we decide which form(s) to include depending on presentation and comparison convenience with other relevant papers. That is, if CCDF is reported in a relevant paper, we try to also report CCDF here so that rigorous comparison is possible.
Next, we study properties of Tumblr through different lenses, in particular, as a social network, a content generation website, and an information propagation platform, respectively.
Tumblr as Social Network
We begin our analysis of Tumblr by examining its social network topology structure. Numerous social networks have been analyzed in the past, such as traditional blogosphere [\citeauthoryearShi et al.2007], Twitter [\citeauthoryearJava et al.2007, \citeauthoryearKwak et al.2010], Facebook [\citeauthoryearUgander et al.2011], and instant messenger communication network [\citeauthoryearLeskovec and Horvitz2008]. Here we run an array of standard network analysis to compare with other networks, with results summarized in Table 11212 12 Even though we wish to include results over other popular social media networks like Pinterest, Sina Weibo and Instagram, analysis over those websites not available or just small-scale case studies that are difficult to generalize to a comprehensive scale for a fair comparison. Actually in the Table, we observe quite a discrepancy between numbers reported over a small twitter data set and another comprehensive snapshot..
| Metric | Tumblr | Blogosphere | Twitter-small | Twitter-huge | MSN | |
|---|---|---|---|---|---|---|
| #nodes | 62.8M | 143,736 | 87,897 | 41.7M | 721M | 180M |
| #links | 3.1B | 707,761 | 829,467 | 1.47B | 68.7B | 1.3B |
| in-degree distr | – | – | ||||
| degree distr in r-graph | power-law | – | – | – | power-law | |
| direction | directed | directed | directed | directed | undirected | undirected |
| reciprocity | 29.03% | 3% | 58% | 22.1% | – | – |
| degree correlation | 0.106 | – | – | 0.226 | – | |
| avg distance | 4.7(m), 5(d) | 9.3(m) | – | 4.1(m), 4(d) | 4.7(m), 5(d) | 6.6(m), 6(d) |
| diameter | 5.4(e), (r) | 12(r) | 6(r) | 4.8(e), (r) | (e) | 7.8(e), (r) |
| GCC coverage | 99.61% | 75.08% | 93.03% | – | 99.91% | 99.90% |
Degree Distribution. Since Tumblr does not require mutual confirmation when one follows another user, we represent the follower-followee network in Tumblr as a directed graph: in-degree of a user represents how many followers the user has attracted, while out-degree indicates how many other users one user has been following. Our sampled sub-graph contains 62.8 million nodes and 3.1 billion edges. Within this social graph, 41.40% of nodes have 0 in-degree, and the maximum in-degree of a node is 4.06 million. By contrast, 12.74% of nodes have 0 out-degree, the maximum out-degree of a node is 155.5k. Top popular Tumblr users include equipo1313 13 http://equipo.tumblr.com, instagram1414 14 http://instagram.tumblr.com, and woodendreams1515 15 http://woodendreams.tumblr.com. This indicates the media characteristic of Tumblr: the most popular user has more than 4 million audience, while more than 40% of users are purely audience since they don’t have any followers.
Figure 3(a) demonstrates the distribution of in-degrees in the blue curve and that of out-degrees in the red curve, where y-axis refers to the cumulated density distribution function (CCDF): the probability that accounts have at least k in-degrees or out-degrees, i.e., . It is observed that Tumblr users’ in-degree follows a power-law distribution with exponent , which is quite similar from the power law exponent of Twitter at [\citeauthoryearKwak et al.2010] or that of traditional blogs at [\citeauthoryearShi et al.2007]. This also confirms with earlier empirical observation that most social network have a power-law exponent between and [\citeauthoryearClauset, Shalizi, and Newman2007].
In regard to out-degree distribution, we notice the red curve has a big drop when out-degree is around 5000, since there was a limit that ordinary Tumblr users can follow at most 5000 other users. Tumblr users’ out-degree does not follow a power-law distribution, which is similar to blogosphere of traditional blogging [\citeauthoryearShi et al.2007].
If we explore user’s in-degree and out-degree together, we could generate normalized 3-D histogram in Figure 3(b). As both in-degree and out-degree follow the heavy-tail distribution, we only zoom in those user who have less than in-degrees and out-degrees. Apparently, there is a positive correlation between in-degree and out-degree because of the dominance of diagonal bars. In aggregation, a user with low in-degree tends to have low out-degree as well, even though some nodes, especially those top popular ones, have very imbalanced in-degree and out-degree.
Reciprocity. Since Tumblr is a directed network, we would like to examine the reciprocity of the graph. We derive the backbone of the Tumblr network by keeping those reciprocal connections only, i.e., user follows and vice versa. Let r-graph denote the corresponding reciprocal graph. We found 29.03% of Tumblr user pairs have reciprocity relationship, which is higher than 22.1% of reciprocity on Twitter [\citeauthoryearKwak et al.2010] and 3% of reciprocity on Blogosphere [\citeauthoryearShi et al.2007], indicating a stronger interaction between users in the network. Figure 3(c) shows the distribution of degrees in the r-graph. There is a turning point due to the Tumblr limit of followees for ordinary users. The reciprocity relationship on Tumblr does not follow the power law distribution, since the curve mostly is convex, similar to the pattern reported over Facebook[\citeauthoryearUgander et al.2011].
Meanwhile, it has been observed that one’s degree is correlated with the degree of his friends. This is also called degree correlation or degree assortativity [\citeauthoryearNewman2002, \citeauthoryearNewman2003]. Over the derived r-graph, we obtain a correlation of between terminal nodes of reciprocate connections, reconfirming the positive degree assortativity as reported in Twitter [\citeauthoryearKwak et al.2010]. Nevertheless, compared with the strong social network Facebook, Tumblr’s degree assortativity is weaker ( vs. ).
Degree of Separation. Small world phenomenon is almost universal among social networks. With this huge Tumblr network, we are able to validate the well-known “six degrees of separation” as well. Figure 4 displays the distribution of the shortest paths in the network. To approximate the distribution, we randomly sample 60,000 nodes as seed and calculate for each node the shortest paths to other nodes. It is observed that the distribution of paths length reaches its mode with the highest probability at hops, and has a median of hops. On average, the distance between two connected nodes is . Even though the longest shortest path in the approximation has hops, of shortest paths are within hops. All these numbers are close to those reported on Facebook and Twitter, yet significantly smaller than that obtained over blogosphere and instant messenger network [\citeauthoryearLeskovec and Horvitz2008].


Component Size. The previous result shows that those users who are connected have a small average distance. It relies on the assumption that most users are connected to each other, which we shall confirm immediately. Because the Tumblr graph is directed, we compute out all weakly-connected components by ignoring the direction of edges. It turns out the giant connected component (GCC) encompasses of nodes in the graph. Over the derived r-graph, are residing in the corresponding GCC. This finding suggests the whole graph is almost just one connected component, and almost all users can reach others through just few hops.
To give a palpable understanding, we summarize commonly used network statistics in Table 1. Those numbers from other popular social networks (blogosphere, Twitter, Facebook, and MSN) are also included for comparison. From this compact view, it is obvious traditional blogs yield a significantly different network structure. Tumblr, even though originally proposed for blogging, yields a network structure that is more similar to Twitter and Facebook.
Tumblr as Blogosphere for
Content Generation
As Tumblr is initially proposed for the purpose of blogging, here we analyze its user generated contents. As described earlier, photo and text posts account for more than of total posts. Hence, we concentrate only on these two types of posts. One text post may contain URL, quote or raw message. In this study, we are mainly interested in the authentic contents generated by users. Hence, we extract raw messages as the content information of each text post, by removing quotes and URLs. Similarly, photo posts contains 3 categories of information: photo URL, quote photo caption, raw photo caption. While the photo URL might contain lots of additional meta information, it would require tremendous effort to analyze all images in Tumblr. Hence, we focus on raw photo captions as the content of each photo post. We end up with two datasets of content: one is text post, and the other is photo caption.
| Text Post | Photo Caption | |
| Dataset | Dataset | |
| # Posts | 21.5 M | 26.3 M |
| Mean Post Length | 426.7 Bytes | 64.3 Bytes |
| Median Post Length | 87 Bytes | 29 Bytes |
| Max Post Length | 446.0 K Bytes | 485.5 K Bytes |
What’s the effect of no length limit for post? Both Tumblr and Twitter are considered microblogging platforms, yet there is one key difference: Tumblr has no length limit while Twitter enforces the strict limitation of 140 bytes for each tweet. How does this key difference affect user post behavior?
It has been reported that the average length of posts on Twitter is 67.9 bytes and the median is 60 bytes1616 16 http://www.quora.com/Twitter-1/What-is-the-average-length-of-a-tweet. Corresponding statistics of Tumblr are shown in Table 2. For the text post dataset, the average length is 426.7 bytes and the median is 87 bytes, which both, as expected, are longer than that of Twitter. Keep in mind Tumblr’s numbers are obtained after removing all quotes, photos and URLs, which further discounts the discrepancy between Tumblr and Twitter. The big gap between mean and median is due to a small percentage of extremely long posts. For instance, the longest text post is 446K bytes in our sampled dataset. As for photo captions, naturally we expect it to be much shorter than text posts. The average length is around 64.3 bytes, but the median is only 29 bytes. Although photo posts are dominant in Tumblr, the number of text posts and photo captions in Table 2 are comparable, because majority of photo posts don’t contain any raw photo captions.
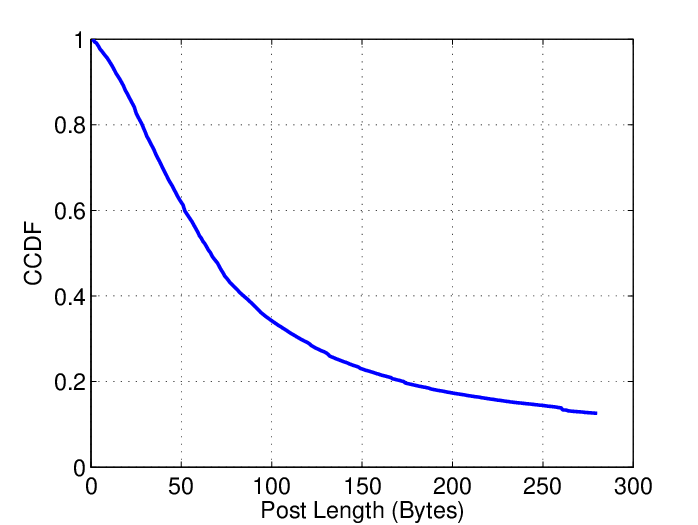
A further related question: is the 140-byte limit sensible? We plot post length distribution of the text post dataset, and zoom into less than 280 bytes in Figure 5. About of posts are beyond 140 bytes, which indicates that at least around one quarter of posts will have to be rewritten in a more compact version if the limit was enforced in Tumblr.
Blending all numbers above together, we can see at least two types of posts: one is more like posting a reference (URL or photo) with added information or short comments, the other is authentic user generated content like in traditional blogging. In other words, Tumblr is a mix of both types of posts, and its no-length-limit policy encourages its users to post longer high-quality content directly.
What are people talking about? Because there is no length limit on Tumblr, the blog post tends to be more meaningful, which allows us to run topic analysis over the two datasets to have an overview of the content. We run LDA [\citeauthoryearBlei, Ng, and Jordan:2003] with 100 topics on both datasets, and showcase several topics and their corresponding keywords on Tables 3 and 4, which also show the high quality of textual content on Tumblr clearly. Medical, Pets, Pop Music, Sports are shared interests across 2 different datasets, although representative topical keywords might be different even for the same topic. Finance, Internet only attracts enough attentions from text posts, while only significant amount of photo posts show interest to Photography, Scenery topics. We want to emphasize that most of these keywords are semantically meaningful and representative of the topics.
| Topic | Topical Keywords |
|---|---|
| Pop | music song listen iframe band album lyrics |
| Music | video guitar |
| Sports | game play team win video cookie |
| ball football top sims fun beat league | |
| Internet | internet computer laptop google search online |
| site facebook drop website app mobile iphone | |
| Pets | big dog cat animal pet animals bear tiny |
| small deal puppy | |
| Medical | anxiety pain hospital mental panic cancer |
| depression brain stress medical | |
| Finance | money pay store loan online interest buying |
| bank apply card credit |
| Topic | Topical Keywords |
|---|---|
| Pets | cat dog cute upload kitty batch puppy |
| pet animal kitten adorable | |
| Scenery | summer beach sun sky sunset sea nature |
| ocean island clouds lake pool beautiful | |
| Pop | music song rock band album listen lyrics |
| Music | punk guitar dj pop sound hip |
| Photography | photo instagram pic picture check |
| daily shoot tbt photography | |
| Sports | team world ball win football club |
| round false soccer league baseball | |
| Medical | body pain skin brain depression hospital |
| teeth drugs problems sick cancer blood |
Who are the major contributors of contents? There are two potential hypotheses. 1) One supposes those socially popular users post more. This is derived from the result that those popular users are followed by many users, therefore blogging is one way to attract more audience as followers. Meanwhile, it might be true that blogging is an incentive for celebrities to interact or reward their followers. 2) The other assumes that long-term users (in terms of registration time) post more, since they are accustomed to this service, and they are more likely to have their own focused communities or social circles. These peer interactions encourage them to generate more authentic content to share with others.


Do socially popular users or long-term users generate more contents? In order to answer this question, we choose a fixed time window of two weeks in August 2013 and examine how frequent each user blogs on Tumblr. We sort all users based on their in-degree (or duration time since registration) and then partition them into 10 equi-width bins. For each bin, we calculate the average blogging frequency. For easy comparison, we consider the maximal value of all bins as 1, and normalize the relative ratio for other bins. The results are displayed in Figure 6, where x-axis from left to right indicates increasing in-degree (or decreasing duration time). For brevity, we just show the result for text post dataset as similar patterns were observed over photo captions.
The patterns are strong in both figures. Those users who have higher in-degree tend to post more, in terms of both mean and median. One caveat is that what we observe and report here is merely correlation, and it does not derive causality. Here we draw a conservative conclusion that the social popularity is highly positively correlated with user blog frequency. A similar positive correlation is also observed in Twitter[\citeauthoryearKwak et al.2010].
In contrast, the pattern in terms of user registration time is beyond our imagination until we draw the figure. Surprisingly, those users who either register earliest or register latest tend to post less frequently. Those who are in between are inclined to post more frequently. Obviously, our initial hypothesis about the incentive for new users to blog more is invalid. There could be different explanations in hindsight. Rather than guessing the underlying explanation, we decide to leave this phenomenon as an open question to future researchers.
As for reference, we also look at average post-length of users, because it has been adopted as a simple metric to approximate quality of blog posts [\citeauthoryearAgarwal et al.2008]. The corresponding correlations are plot in Figure 7. In terms of post length, the tail users in social networks are the winner. Meanwhile, long-term or recently-joined users tend to post longer blogs. Apparently, this pattern is exactly opposite to post frequency. That is, the more frequent one blogs, the shorter the blog post is. And less frequent bloggers tend to have longer posts. That is totally valid considering each individual has limited time and resources. We even changed the post length to the maximum for each individual user rather than average, but the pattern remains still.


In summary, without the post length limitation, Tumblr users are inclined to write longer blogs, and thus leading to higher-quality user generated content, which can be leveraged for topic analysis. The social celebrities (those with large number of followers) are the main contributors of contents, which is similar to Twitter [\citeauthoryearWu et al.2011]. Surprisingly, long-term users and recently-registered users tend to blog less frequently. The post-length in general has a negative correlation with post frequency. The more frequently one posts, the shorter those posts tend to be.
Tumblr for Information Propagation
Tumblr offers one feature which is missing in traditional blog services: reblog. Once a user posts a blog, other users in Tumblr can reblog to comment or broadcast to their own followers. This enables information to be propagated through the network. In this section, we examine the reblogging patterns in Tumblr. We examine all blog posts uploaded within the first 2 weeks, and count reblog events in the subsequent 2 weeks right after the blog is posted, so that there would be no bias because of the time window selection in our blog data.


Who are reblogging? Firstly, we would like to understand which users tend to reblog more? Those people who reblog frequently serves as the information transmitter. Similar to the previous section, we examine the correlation of reblogging behavior with users’ in-degree. As shown in the Figure 8, social celebrities, who are the major source of contents, reblog a lot more compared with other users. This reblogging is propagated further through their huge number of followers. Hence, they serve as both content contributor and information transmitter. On the other hand, users who registered earlier reblog more as well. The socially popular and long-term users are the backbone of Tumblr network to make it a vibrant community for information propagation and sharing.


Reblog size distribution. Once a blog is posted, it can be reblogged by others. Those reblogs can be reblogged even further, which leads to a tree structure, which is called reblog cascade, with the first author being the root node. The reblog cascade size indicates the number of reblog actions that have been involved in the cascade. Figure 9 plots the distribution of reblog cascade sizes. Not surprisingly, it follows a power-law distribution, with majority of reblog cascade involving few reblog events. Yet, within a time window of two weeks, the maximum cascade could reach . In order to have a detailed understanding of reblog cascades, we zoom into the short head and plot the CCDF up to reblog cascade size equivalent to in Figure 9. It is observed that only about of reblog cascades have size greater than . By contrast, only of retweet cascades have size larger than [\citeauthoryearKwak et al.2010]. The reblog cascades in Tumblr tend to be larger than retweet cascades in Twitter.
Reblog depth distribution. As shown in previous sections, almost any pair of users are connected through few hops. How many hops does one blog to propagate to another user in reality? Hence, we look at the reblog cascade depth, the maximum number of nodes to pass in order to reach one leaf node from the root node in the reblog cascade structure. Note that reblog depth and size are different. A cascade of depth can involve hundreds of nodes if every other node in the cascade reblogs the same root node.
Figure 10 plots the distribution of number of hops: again, the reblog cascade depth distribution follows a power law as well according to the PDF; when zooming into the CCDF, we observe that only of reblog cascades have depth larger than . That is, majority of cascades can reach just few hops, which is consistent with the findings reported over Twitter [\citeauthoryearBakshy et al.2011]. Actually, of cascades in Tumblr have depth . Nevertheless, the maximum depth among all cascades can reach 241 based on two week data. This looks unlikely at first glimpse, considering any two users are just few hops away. Indeed, this is because users can add comment while reblogging, and thus one user is likely to involve in one reblog cascade multiple times. We notice that some Tumblr users adopt reblog as one way for conversation or chat.


Reblog Structure Distribution. Since most reblog cascades are few hops, here we show the cascade tree structure distribution up to size in Figure 11. The structures are sorted based on their coverage. Apparently, a substantial percentage of cascades () are of size , i.e., a post being reblogged merely once. Generally speaking, a reblog cascade of a flat structure tends to have a higher probability than a reblog cascade of the same size but with a deep structure. For instance, a reblog cascade of size 3 have two variants, of which the flat one covers cascade while the deep one drops to . The same patten applies to reblog cascades of size 4 and 5. In other words, it is easier to spread a message widely rather than deeply in general. This implies that it might be acceptable to consider only the cascade effect under few hops and focus those nodes with larger audience when one tries to maximize influence or information propagation.

Temporal patten of reblog. We have investigated the information propagation spatially in terms of network topology, now we study how fast for one blog to be reblogged? Figure 12 displays the distribution of time gap between a post and its first reblog. There is a strong bias toward recency. The larger the time gap since a blog is posted, the less likely it would be reblogged. of first reblog arrive within the first hour since a blog is posted, and of first reblog appears within one day. Comparatively, It has been reported that “half of retweeting occurs within an hour and under a day” [\citeauthoryearKwak et al.2010] on Twitter. In short, Tumblr reblog has a strong bias toward recency, and information propagation on Tumblr is fast.

Related Work
There are rich literatures on both existing and emerging online social network services. Statistical patterns across different types of social networks are reported, including traditional blogosphere [\citeauthoryearShi et al.2007], user-generated content platforms like Flickr, Youtube and LiveJournal [\citeauthoryearMislove et al.2007], Twitter [\citeauthoryearJava et al.2007, \citeauthoryearKwak et al.2010], instant messenger network [\citeauthoryearLeskovec and Horvitz2008], Facebook [\citeauthoryearUgander et al.2011], and Pinterest [\citeauthoryearGilbert et al.2013, \citeauthoryearOttoni et al.2013]. Majority of them observe shared patterns such as long tail distribution for user degrees (power law or power law with exponential cut-off), small ( quantile effective) diameter, positive degree association, homophily effect in terms of user profiles (age or location), but not with respect to gender. Indeed, people are more likely to talk to the opposite sex [\citeauthoryearLeskovec and Horvitz2008]. The recent study of Pinterest observed that ladies tend to be more active and engaged than men [\citeauthoryearOttoni et al.2013], and women and men have different interests [\citeauthoryearChang et al.2014]. We have compared Tumblr’s patterns with other social networks in Table 1 and observed that most of those trend hold in Tumblr except for some number difference.
Lampe et al. [\citeauthoryearLampe, Ellison, and Steinfield2007] did a set of survey studies on Facebook users, and shown that people use Facebook to maintain existing offline connections. Java et al. [\citeauthoryearJava et al.2007] presented one of the earliest research paper for Twitter, and found that users leverage Twitter to talk their daily activities and to seek or share information. In addition, Schwartz [\citeauthoryearGilbert et al.2013] is one of the early studies on Pinterest, and from a statistical point of view that female users repin more but with fewer followers than male users. While Hochman and Raz [\citeauthoryearHochman and Schwartz2012] published an early paper using Instagram data, and indicated differences in local color usage, cultural production rate, for the analysis of location-based visual information flows.
Existing studies on user influence are based on social networks or content analysis. McGlohon et al. [\citeauthoryearMcGlohon et al.2007] found topology features can help us distinguish blogs, the temporal activity of blogs is very non-uniform and bursty, but it is self-similar. Bakshy et al. [\citeauthoryearBakshy et al.2011] investigated the attributes and relative influence based on Twitter follower graph, and concluded that word-of-mouth diffusion can only be harnessed reliably by targeting large numbers of potential influencers, thereby capturing average effects. Hopcroft et al. [\citeauthoryearHopcroft, Lou, and Tang2011] studied the Twitter user influence based on two-way reciprocal relationship prediction. Weng et al. [\citeauthoryearWeng et al.2010] extended PageRank algorithm to measure the influence of Twitter users, and took both the topical similarity between users and link structure into account. Kwak et al. [\citeauthoryearKwak et al.2010] study the topological and geographical properties on the entire Twittersphere and they observe some notable properties of Twitter, such as a non-power-law follower distribution, a short effective diameter, and low reciprocity, marking a deviation from known characteristics of human social networks.
However, due to data access limitation, majority of the existing scholar papers are based on either Twitter data or traditional blogging data. This work closes the gap by providing the first overview of Tumblr so that others can leverage as a stepstone to investigate more over this evolving social service or compare with other related services.
Conclusions and Future Work
In this paper, we provide a statistical overview of Tumblr in terms of social network structure, content generation and information propagation. We show that Tumblr serves as a social network, a blogosphere and social media simultaneously. It provides high quality content with rich multimedia information, which offers unique characteristics to attract youngsters. Meanwhile, we also summarize and offer as rigorous comparison as possible with other social services based on numbers reported in other papers. Below we highlight some key findings:
- •
With multimedia support in Tumblr, photos and text account for majority of blog posts, while audios and videos are still rare.
- •
Tumblr, though initially proposed for blogging, yields a significantly different network structure from traditional blogosphere. Tumblr’s network is much denser and better connected. Close to of connections on Tumblr are reciprocate, while blogosphere has only . The average distance between two users in Tumblr is , which is roughly half of that in blogosphere. The giant connected component covers of nodes as compared to in blogosphere.
- •
Tumblr network is highly similar to Twitter and Facebook, with power-law distribution for in-degree distribution, non-power law out-degree distribution, positive degree associativity for reciprocate connections, small distance between connected nodes, and a dominant giant connected component.
- •
Without post length limitation, Tumblr users tend to post longer. Approximately 1/4 of text posts have authentic contents beyond 140 bytes, implying a substantial portion of high quality blog posts for other tasks like topic
- •
Those social celebrities tend to be more active. They post analysis and text mining. and reblog more frequently, serving as both content generators and information transmitters. Moreover, frequent bloggers like to write short, while infrequent bloggers spend more effort in writing longer posts.
- •
In terms of duration since registration, those long-term users and recently registered users post less frequently. Yet, long-term users reblog more.
- •
Majority of reblog cascades are tiny in terms of both size and depth, though extreme ones are not uncommon. It is relatively easier to propagate a message wide but shallow rather than deep, suggesting the priority for influence maximization or information propagation.
- •
Compared with Twitter, Tumblr is more vibrant and faster in terms of reblog and interactions. Tumblr reblog has a strong bias toward recency. Approximately of the first reblogs occur within the first hour and appear within one day.
This snapshot research is by no means to be complete. There are several directions to extend this work. First, some patterns described here are correlations. They do not illustrate the underlying mechanism. It is imperative to differentiate correlation and causality [\citeauthoryearAnagnostopoulos, Kumar, and Mahdian2008] so that we can better understand the user behavior. Secondly, it is observed that Tumblr is very popular among young users, as half of Tumblr’s visitor base being under 25 years old. Why is it so? We need to combine content analysis, social network analysis, together with user profiles to figure out. In addition, since more than of Tumblr posts are images, it is necessary to go beyond photo captions, and analyze image content together with other meta information.
References
- [\citeauthoryearAgarwal et al.2008] Agarwal, N.; Liu, H.; Tang, L.; and Yu, P. S. 2008. Identifying the influential bloggers in a community. In Proceedings of the 2008 International Conference on Web Search and Data Mining, WSDM ’08, 207–218. New York, NY, USA: ACM.
- [\citeauthoryearAnagnostopoulos, Kumar, and Mahdian2008] Anagnostopoulos, A.; Kumar, R.; and Mahdian, M. 2008. Influence and correlation in social networks. In Proceedings of the 14th ACM SIGKDD international conference on Knowledge Discovery and Data Mining, KDD’08.
- [\citeauthoryearBakshy et al.2011] Bakshy, E.; Hofman, J. M.; Mason, W. A.; and Watts, D. J. 2011. Everyone’s an influencer: quantifying influence on twitter. In Proceedings of International conference on Web Search and Data Mining (WSDM).
- [\citeauthoryearBlei, Ng, and Jordan:2003] Blei, D. M.; Ng, A. Y.; and Jordan:, M. I. 2003. Latent dirichlet allocation. Journal of Machine Learning Research 3:993–1022.
- [\citeauthoryearChang et al.2014] Chang, S.; Kumar, V.; Gilbert, E.; and Terveen, L. 2014. Specialization, homophily, and gender in a social curation site: Findings from pinterest. In Proceedings of The 17th ACM Conference on Computer Supported Cooperative Work and Social Computing, CSCW’14.
- [\citeauthoryearClauset, Shalizi, and Newman2007] Clauset, A.; Shalizi, C. R.; and Newman, M. E. J. 2007. Power-law distributions in empirical data. arXiv 706.
- [\citeauthoryearGilbert et al.2013] Gilbert, E.; Bakhshi, S.; Chang, S.; and Terveen, L. 2013. ’i need to try this!’: A statistical overview of pinterest. In Proceedings of the SIGCHI Conference on Human Factors in Computing Systems (CHI).
- [\citeauthoryearHochman and Schwartz2012] Hochman, N., and Schwartz, R. 2012. Visualizing instagram: Tracing cultural visual rhythms. In Proceedings of the Workshop on Social Media Visualization (SocMedVis) in conjunction with The Sixth International AAAI Conference on Weblogs and Social Media (ICWSM-12).
- [\citeauthoryearHopcroft, Lou, and Tang2011] Hopcroft, J. E.; Lou, T.; and Tang, J. 2011. Who will follow you back?: reciprocal relationship prediction. In Proceedings of ACM International Conference on Information and Knowledge Management (CIKM), 1137–1146.
- [\citeauthoryearJava et al.2007] Java, A.; Song, X.; Finin, T.; and Tseng, B. 2007. Why we twitter: understanding microblogging usage and communities. In WebKDD/SNA-KDD ’07, 56–65. New York, NY, USA: ACM.
- [\citeauthoryearKwak et al.2010] Kwak, H.; Lee, C.; Park, H.; and Moon, S. B. 2010. What is twitter, a social network or a news media. In Proceedings of 19th International World Wide Web Conference (WWW).
- [\citeauthoryearLampe, Ellison, and Steinfield2007] Lampe, C.; Ellison, N.; and Steinfield, C. 2007. A familiar face(book): Profile elements as signals in an online social network. In Proceedings of the SIGCHI Conference on Human Factors in Computing Systems (CHI).
- [\citeauthoryearLeskovec and Horvitz2008] Leskovec, J., and Horvitz, E. 2008. Planetary-scale views on a large instant-messaging network. In WWW ’08: Proceeding of the 17th international conference on World Wide Web, 915–924. New York, NY, USA: ACM.
- [\citeauthoryearMcGlohon et al.2007] McGlohon, M.; Leskovec, J.; Faloutsos, C.; Hurst, M.; and Glance, N. S. 2007. Finding patterns in blog shapes and blog evolution. In Proceedings of the 1st International AAAI Conference on Weblogs and Social Media (ICWSM).
- [\citeauthoryearMislove et al.2007] Mislove, A.; Marcon, M.; Gummadi, K. P.; Druschel, P.; and Bhattacharjee, B. 2007. Measurement and analysis of online social networks. In IMC ’07: Proceedings of the 7th ACM SIGCOMM conference on Internet measurement, 29–42. New York, NY, USA: ACM.
- [\citeauthoryearMittal et al.2013] Mittal, S.; Gupta, N.; Dewan, P.; and Kumaraguru, P. 2013. The pin-bang theory: Discovering the pinterest world. arXiv preprint arXiv:1307.4952.
- [\citeauthoryearNardi et al.2004] Nardi, B.; Schiano, D. J.; Gumbrecht, S.; and Swartz, L. 2004. Why we blog. Commun. ACM 47(12):41–46.
- [\citeauthoryearNewman2002] Newman, M. E. J. 2002. Assortative mixing in networks. Physical review letters, 89(20): 208701.
- [\citeauthoryearNewman2003] Newman, M. E. J. 2003. Mixing patterns in networks. Physical Review E, 67(2): 026126.
- [\citeauthoryearOttoni et al.2013] Ottoni, R.; Pesce, J. P.; Las Casas, D.; Franciscani, G.; Kumaruguru, P.; and Almeida, V. 2013. Ladies first: Analyzing gender roles and behaviors in pinterest. Proceedings of ICWSM.
- [\citeauthoryearShi et al.2007] Shi, X.; Tseng, B.; ; and Adamic, L. A. 2007. Looking at the blogosphere topology through different lenses. In Proceedings of the 1st International AAAI Conference on Weblogs and Social Media (ICWSM).
- [\citeauthoryearUgander et al.2011] Ugander, J.; Karrer, B.; Backstrom, L.; and Marlow, C. 2011. The anatomy of the facebook social graph. arXiv preprint arXiv:1111.4503.
- [\citeauthoryearWeng et al.2010] Weng, J.; Lim, E.-P.; Jiang, J.; and He, Q. 2010. Twitterrank: finding topic-sensitive influential twitterers. In Proceedings of International conference on Web Search and Data Mining (WSDM), 1137–1146.
- [\citeauthoryearWu et al.2011] Wu, S.; Hofman, J. M.; Mason, W. A.; and Watts, D. J. 2011. Who says what to whom on twitter. In Proceedings of the 20th International World Wide Web Conference, WWW’11.