The clustering of galaxies in the SDSS-III Baryon Oscillation Spectroscopic Survey: Signs of neutrino mass in current cosmological datasets
Abstract
We investigate the cosmological implications of the latest growth of structure measurement from the Baryon Oscillation Spectroscopic Survey (BOSS) CMASS Data Release 11 with particular focus on the sum of the neutrino masses, . We examine the robustness of the cosmological constraints from the Baryon Acoustic Oscillation (BAO) scale, the Alcock-Paczynski effect and redshift-space distortions (, , ) of Beutler et al. (2013), when introducing a neutrino mass in the power spectrum template. We then discuss how the neutrino mass relaxes discrepancies between the Cosmic Microwave Background (CMB) and other low-redshift measurements within CDM. Combining our cosmological constraints with WMAP9 yields eV ( c.l.), which represents a preference for non-zero neutrino mass. The significance can be increased to when including weak lensing results and other BAO constraints, yielding eV ( c.l.). However, combining CMASS with Planck data reduces the preference for neutrino mass to . When removing the CMB lensing effect in the Planck temperature power spectrum (by marginalising over ), we see shifts of in and , which have a significant effect on the neutrino mass constraints. In case of CMASS plus Planck without the -lensing signal, we find a preference for a neutrino mass of eV ( c.l.), in excellent agreement with the WMAP9+CMASS value. The constraint can be tightened to yielding eV ( c.l.) when weak lensing data and other BAO constraints are included.
Keywords:
surveys, cosmology: observations, cosmological parameters, large scale structure of Universe1 introduction
The measurement of neutrino oscillations in neutrino detection experiments using solar, atmospheric and reactor neutrinos has now convincingly shown that neutrinos cannot be massless. Neutrino oscillation experiments are sensitive to the mass differences between the neutrino eigenstates, and the current data imply eV2 and eV2 (Beringer et al., 2012). These measurements provide a lower limit for the sum of the neutrino masses of eV. Using the mass difference constraints above and knowing that , one can construct two mass hierarchies for neutrinos. The so-called “normal” hierarchy suggests , where we have one heavy neutrino and two lighter ones, while the so-called “inverted” hierarchy suggests , where we have one light neutrino and two heavy ones.
Because of the extremely low cross-section of neutrinos it is difficult for laboratory experiments to measure the neutrino mass directly. The current best upper bounds on the neutrino mass from particle physics experiments are from Troitsk (Lobashev et al., 1999) and Mainz (Weinheimer et al., 1999) tritium beta-decay experiments that found eV ( confidence level), where is the mass to which beta-decay experiments are sensitive (see section 6.2 and eq. 21). The KArlsruhe TRItium Neutrino experiment (KATRIN) aims to measure with a sensitivity of eV (Wolf, 2008), which would constrain eV. Also, neutrino-less double beta decay () experiments such as KamLAND-Zen will assess the effective mass of Majorana neutrinos at the level of ()eV (Gando et al., 2013) depending on the nuclear matrix element.
With the advent of precision cosmology, it was realised that the neutrino mass has an effect on the matter distribution in the Universe and that this could be used to indirectly measure the sum of the neutrino masses, . The neutrino mass introduces a scale-dependent suppression of the clustering amplitude with the scale-dependency set by . The suppression of clustering is caused by the large thermal velocity of neutrinos which leads to a large free-streaming scale. Many recent publications have attempted to constrain , but most were only able to set upper limits (Seljak, Slosar & McDonald, 2006; Hinshaw et al., 2009; Dunkley et al., 2009; Reid et al., 2010; Komatsu et al., 2011; Saito, Takada & Taruya, 2011; Thomas, Abdalla & Lahav, 2010; Tereno et al., 2009; Gong et al., 2009; Ichiki, Takada & Takahashi, 2009; Li et al., 2009; Zhao et al., 2013; Hinshaw et al., 2013; de Putter et al., 2012; Xia et al., 2012; Sanchez et al., 2012; Riemer-Sorensen, Parkinson & Davis, 2013; Giusarma et al., 2013) with some exceptions based on cluster abundance results, e.g., Hou et al. (2012); Ade et al. (2013b); Battye & Moss (2013); Wyman et al. (2013); Burenin (2013); Rozo et al. (2013).
Introducing a neutrino mass suppresses clustering power between the epoch of decoupling and today below the free streaming scale, as massive neutrinos affect the cosmological expansion rate, but free-stream out of matter perturbations. The clustering amplitude is often parameterised by the r.m.s. mass fluctuations in spheres of Mpc at the present epoch and denoted . Given the clustering amplitude at decoupling measured by the CMB, we can predict the value of , within a certain cosmological model. However, this prediction depends on the initial assumption of the neutrino mass, introducing a degeneracy between and . In fact, if there were no other effect of the neutrino mass on the CMB, the neutrino mass parameter would be completely degenerate with . Luckily there are several other effects of the neutrino mass on the CMB, which can be used to break this degeneracy. If neutrinos would exceed the limit eV, they would trigger more direct effects in the CMB (Dodelson, Gates & Stebbins, 1996; Ichikawa, Fukugita & Kawasaki, 2005), which are not observed. This represents probably the most robust limit on the neutrino mass from cosmology. Apart from this there are other, more subtle effects on the CMB anisotropies. Changing the neutrino mass and keeping the redshift of matter-radiation equality fixed will change the low-redshift value of . This will change the angular diameter distance to the last scattering surface, . Since such changes can be absorbed by changes in the Hubble parameter there is a (geometric) degeneracy between and in the CMB. Beside the angular diameter distance the neutrino mass also impacts the slope of the CMB power spectrum at low multipoles due to the Integrated Sachs-Wolfe (ISW) effect (Lesgourgues & Pastor, 2006; Ade et al., 2013e). The ISW effect describes the energy change of CMB photons caused by the decay of the gravitational potentials during radiation domination (early ISW effect) or domination (late ISW effect). If instead is kept fixed when varying the neutrino mass, the redshift of matter-radiation equality will change, which affects the position and amplitude of the acoustic peaks in the CMB power spectrum (for more details see e.g. Lesgourgues & Pastor 2012). Weak gravitational lensing of the CMB photons encodes information about the late-time Universe with the Planck kernel peaking at around (Ade et al., 2013c). The lensing deflections are caused by an integrated measure of the matter distribution along the line of sight. Using these additional signals, the CMB data are able to break the - degeneracy to some extent. The remaining degeneracy can be broken by including low-redshift measurements from other datasets.
Low-redshift measurements of the clustering amplitude () are notoriously difficult, and to some extent require priors from the CMB. Most low-redshift probes which are sensitive to require the understanding of non-linear effects and usually carry large systematic uncertainties. In this paper we demonstrate that recent constraints on the growth rate , the Baryon Acoustic Oscillation (BAO) scale and the Alcock-Paczynski effect from the Baryon Oscillation Spectroscopic Survey (BOSS) are robust against variations of in the theoretical template. We also show that the constraint on (, ) from the shear correlation function of the weak lensing signal of CFHTLenS is robust against variations of . We therefore claim that combining CMB datasets with these low-redshift growth of structure measurements provides a reliable approach to break the - degeneracy in the CMB.
This paper is organised as follows. In section 2 we give a brief summary of the effect of neutrinos on the matter perturbations. In section 3 we introduce constraints on from different datasets. In section 4 we investigate the robustness of different low redshift constraints, with particular focus on the BOSS growth of structure constraint. In section 5 we investigate the parameter as one approach to relieve the tension between these different datasets. In section 6 we discuss the cosmological implications of our results, and we conclude in section 7.
2 Background
Here we give a brief overview of the effect of massive neutrinos on the matter perturbations in the Universe. More details can be found in most standard text books (see also Lesgourgues & Pastor 2006; Lesgourgues & Pastor 2012; Lesgourgues et al. 2013).
In the absence of massive neutrinos, density perturbations of cold dark matter and baryons grow as
| (1) |
where is the scale factor and is the growth function. The large thermal velocity of neutrinos leads to a free streaming scale, below which they do not contribute to the matter perturbation growth. During matter or domination the free streaming scale can be approximated by
| (2) |
where is the mass of the individual neutrino eigenstates. The matter growth is an interplay between the dilution of matter caused by the expansion of the universe and the growth of perturbations through gravitational collapse. Since neutrinos contribute to the homogeneous expansion through the Friedmann equation but do not contribute to the growth of matter perturbations below the free streaming scale, the overall growth of cold dark matter and baryon perturbations on small scales is suppressed and behaves approximately as
| (3) |
with (Bond, Efstathiou & Silk, 1980). The total matter perturbations are then given by . The suppression of matter perturbations on small scales leads to a suppression of the power spectrum, . In the linear regime this suppression can be approximated by (Hu, Eisenstein & Tegmark, 1998)
| (4) |
while on scales larger than the free streaming scale, neutrino perturbations behave like cold dark matter (see also Brandbyge et al. 2008; Viel, Haehnelt & Springel 2010).
The overall normalisation of the power spectrum is usually parameterised by with . The CMB measures the scalar amplitude , which must be extrapolated from the redshift of decoupling to redshift zero to obtain . The relation between and is given by
| (5) |
where Mpc, is the scalar spectral index and is the Fourier transform of the top-hat window function. The growth factor , the primordial power spectrum and the transfer function define the power spectrum up to a normalisation factor, . Comparing low redshift measurements with the extrapolation of from the CMB allows us to measure the damping effect of neutrinos (Takada, Komatsu & Futamase, 2004). In this paper we are going to use constraints from galaxy redshift surveys as well as weak lensing. While galaxy surveys measure the galaxy power spectrum, which can be related to the matter power spectrum by the galaxy bias, weak lensing surveys are sensitive to a line-of-sight integral over the matter power spectrum weighted by a lensing kernel.
3 Cosmological datasets included in this analysis
Here we introduce the different datasets used in our analysis. We start with the Baryon Oscillation Spectroscopic Survey (BOSS) CMASS sample. BOSS, as part of SDSS-III (Eisenstein et al., 2011; Dawson et al., 2013) is measuring spectroscopic redshifts of million galaxies (and quasars) using the SDSS multi-fibre spectrographs (Bolton et al., 2012; Smee et al., 2013). The galaxies are selected from multi-colour SDSS imaging (Fukugita et al., 1996; Gunn et al., 1998; Smith et al., 2002; Gunn et al., 2006; Doi et al., 2010) and cover a redshift range of - , where the survey is split into two samples called LOWZ ( - ) and CMASS ( - ). The CMASS-DR11 sample covers in the North Galactic Cap and in the South Galactic Cap; the total area of represents a significant increase from CMASS-DR9 (Ahn et al., 2012; Anderson et al., 2013a), which covered in total. In this analysis we use the CMASS-DR11 results of Beutler et al. (2013), which includes the measurement of the BAO scale, the Alcock-Paczynski effect and the signal of redshift-space distortions (RSD). Note that we do not include other RSD measurements (e.g. Hawkins et al. 2003; Blake et al. 2011; Beutler et al. 2012; Oka et al. 2013), since the measurement methodology and nonlinear modelling are different from the one in Beutler et al. (2013).
We also use results from SDSS-II (DR7) (Abazajian et al., 2009) reported in Mandelbaum et al. (2013), where galaxy-galaxy weak lensing together with galaxy clustering has been used to constrain the dark matter clustering.
Our second lensing dataset is the Canada-France-Hawaii Lensing Survey (Heymans et al., 2012), hereafter referred to as CFHTLenS. The CFHTLenS survey analysis combined weak lensing data processing with theli (Erben et al., 2013), shear measurement with lensfit (Miller et al., 2013), and photometric redshift measurement with PSF-matched photometry (Hildebrandt et al., 2012). A full systematic error analysis of the shear measurements in combination with the photometric redshifts is presented in Heymans et al. (2012), with additional error analyses of the photometric redshift measurements presented in Benjamin et al. (2013).
The current most powerful cosmological datasets are measurements of the Cosmic Microwave Background (CMB). We include the -year results from the Wilkinson Microwave Anisotropy Probe (WMAP) (Hinshaw et al., 2013) and the first data release of Planck (Ade et al., 2013a) interchangeably. Both datasets have full-sky, multi-frequency coverage and the Planck beams are small enough to probe gravitational lensing deflections which was not possible in WMAP. We will also compare the original results of Planck with the re-analysis by Spergel, Flauger & Hlozek (2013).

In Figure 1 we present two-dimensional likelihood distributions of and from the datasets discussed above. Within a flat CDM cosmological model the CMB provides by far the best constraints in this parameter space (brown contours). We show the Planck+WP result, which includes the polarisation analysis from WMAP. The Planck prediction of and relies strongly on the assumption of CDM, since both parameters, and , are extrapolated from information at high redshift. We compare the Planck prediction with the lensing result from the CFHTLenS (Kilbinger et al., 2013) (grey contours), the galaxy-galaxy lensing result of Mandelbaum et al. (2013) (green contours) and the result using clusters detected through the Sunyaev-Zel’dovich (SZ) effect in Planck (Ade et al., 2013b) (magenta contours). The orange contours show the CMASS-DR11 results of Beutler et al. (2013) in the form of (see also Samushia et al. 2013; Sanchez et al. 2013; Chuang et al. 2013, which gave very similar results). The largest disagreement with the Planck prediction comes from the SZ cluster result and has been discussed in Ade et al. (2013b) (see also Benson et al. 2013 for similar results from SPT).
4 The reliability of low redshift growth of structure constraints
We now investigate the reliability of different low redshift growth of structure measurements with respect to variations of in the data modelling process. Low redshift growth of structure measurements usually report some combined constraint on and and assume a certain value for the neutrino mass when deriving this constraint. To be able to use such a measurement to set limits on the value of the neutrino mass one needs to be sure that the initial assumption about the neutrino mass in the modelling step does not influence the result.
The tightest current constraint comes from SZ clusters detected by Planck (Ade et al., 2013b) in the form:
| (6) |
We include this result as the magenta contours in Figure 1. The tension between this measurement and the Planck temperature power spectrum has been discussed in Ade et al. (2013b) (see also Hamann & Hasenkamp 2013; Battye & Moss 2013); and including a large value for the sum of the neutrino masses is mentioned as one possibility to relieve this tension. However, Costanzi et al. (2013) showed that in the case of eV there is up to uncertainty on the predicted cluster count depending on whether the r.m.s. of the mass perturbations, , required to predict the halo mass function, is calculated from the cold dark matter power spectrum or the matter power spectrum. In case of the Planck SZ cluster analysis the systematic uncertainty on from these effects is twice as large as the statistical error reported by the Planck collaboration. Cluster counts also carry an uncertainty from the unknown bias in the mass-observable relations (Rozo et al., 2013; von der Linden et al., 2014). Because of these uncertainties we will not include the SZ cluster results in the parameter constraints in this paper.
4.1 Reliability of the CMASS constraints

| Beutler et al. 2013 | Template with eV | |||
| parameter | best fit | mean | best fit | mean |
| Mpc | Mpc | Mpc | Mpc | |

In Beutler et al. (2013) we analysed the CMASS power spectrum multipoles and constrained the distance ratio , where is the sound horizon at the drag epoch, and
| (7) |
as well as the Alcock-Paczynski parameter and the growth of structure . Our technique made use of a power spectrum template, based on the current Planck cosmological parameters including several non-linear effects which are parameterised by four nuisance parameters. We scaled this template with two scaling parameters, and , along with the redshift-space distortion parameter . We performed several systematics tests, which demonstrated that the power spectrum can be used up to Mpc, where our constraints are still dominated by the statistical error. To some extent our technique must be understood as a consistency check within the Planck cosmological parameters, since we rely on the Planck power spectrum template. However, as shown in Beutler et al. (2013), the parameter constraints do not rely heavily on the template itself. For example, we can replace the Planck template with a WMAP9 template and not bias our parameter constraints (see Beutler et al. 2013 section for details). Another systematics check has been performed in Ross et al. (2013), where we showed that the BAO and redshift-space distortion constraints are independent of different colour cuts within the CMASS dataset.

The question we want to address here is, what happens when we introduce a neutrino mass in the power spectrum template? The power spectrum template in Beutler et al. (2013) assumes eV. The neutrino mass introduces a scale-dependent damping in the power spectrum. Since our analysis includes four nuisance parameters to capture scale-dependencies, we can expect that some of the changes in the power spectrum template will be absorbed by these nuisance parameters.
To explicitly test the effect of the neutrino mass we produce a linear power spectrum using camb (Lewis & Bridle, 2002) setting the neutrino mass parameter to eV with three massive neutrinos with degenerate masses. We keep fixed when including the neutrino mass, so that the total physical matter density increases as . The physical neutrino density is given by
| (8) |
We use the linear matter power spectrum as input for the non-linear power spectrum produced via RegPT (Taruya et al., 2012) as well as the correction terms summarised in section of Beutler et al. (2013). Strictly speaking, RegPT is not designed to include the non-linear clustering contribution of neutrinos. By using the linear matter power spectrum as an input to RegPT we assume that non-linear corrections for the matter power spectrum are identical for neutrinos, cold dark matter and baryons. This assumption is incorrect, since neutrino perturbations tend to stay in the linear regime even where non-linear corrections to the matter power spectrum are not negligible (Saito, Takada & Taruya, 2013; Wong, 2008; Saito, Takada & Taruya, 2013). However, these effects are small on the scales we are interested in and should not influence the outcome of this test. The difference between the linear matter power spectrum multipoles with a neutrino mass parameter of eV and zero neutrino mass is shown in Figure 2.
Also notice that a non-zero neutrino mass introduces a scale-dependence in the growth rate as shown in Figure 3. To compare with the CMB prediction of the growth rate we desire to know the value instead of some effective growth rate. In case of eV the suppression is at Mpc. We include this effect in our parameter fit, by using as a free parameter instead of , where
| (9) |
Using the new power spectrum template we repeat the parameter fit of Beutler et al. (2013) with the fitting range - Mpc. Table 1 and Figure 4 (left) summarise the results. The new template is a slightly worse fit to the dataset compared to the template with eV used in Beutler et al. (2013), since the increases by to d.o.f. . This degradation is also reflected in the increased errorbars for some parameters. However, this result cannot be interpreted as preference for zero neutrino mass, since all other cosmological parameters in the power spectrum template were fixed. The best fitting values show shifts for the three cosmological parameters. As expected, the BAO scale is very robust against changes in the template, while we see larger shifts in and (see the Figure 4, left). Since and are correlated the significance of this shift is lower when accounting for the correlation. We calculate the quantity
| (10) |
where is the data vector of , and , derived in this paper and stands for the equivalent results of Beutler et al. (2013). We use the covariance matrix, , reported in eq. of Beutler et al. (2013). For the values in Table 1 we find with three degrees of freedom. While the shifts reported in Table 1 do not seem significant, they lead to smaller which would increase the preference for a neutrino mass, as discussed in the next section. These possible systematics are of the same order as the modelling systematics discussed in Beutler et al. (2013), which when treated as independent error contributions increase the total error budged by . We conclude that our cosmological parameter constraints are robust against changes in the power spectrum template related to the neutrino mass.
4.2 Reliability of the CFHTLenS constraint
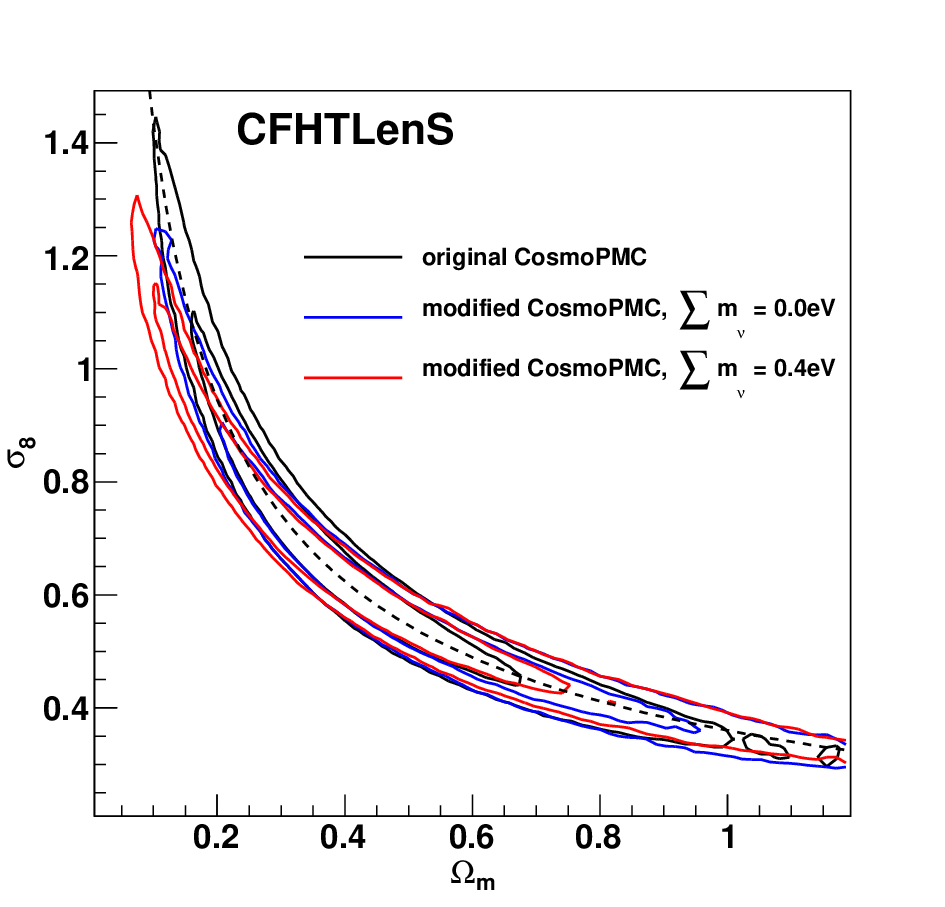
Now we test the reliability of the CFHTLenS results when changing the neutrino mass parameter in the shear-shear correlation function model. We use the Population Monte Carlo code CosmoPMC (Kilbinger et al., 2011), which was also used for the CFHTLenS analysis in Kilbinger et al. (2013). CosmoPMC uses the linear matter power spectrum fitting formula of Eisenstein & Hu (1998) when modelling the shear-shear correlation function as well as the halofit mapping of Smith et al. (2003), neither of which includes the effect of massive neutrinos. We therefore modify the code by including the linear power spectrum fitting formula of Eisenstein & Hu (1997) and the halofit mapping suggested in Bird, Viel & Haehnelt (2012). The halofit implementation of Bird, Viel & Haehnelt (2012) also includes a correction to the power spectrum amplitude on small scales, which Smith et al. (2003) over-predicts. The effect of this correction to the CFHTLenS constraints is shown in Figure 4 (right), where the black contours use the halofit mapping of Smith et al. (2003), while the blue contours use the halofit mapping of Bird, Viel & Haehnelt (2012). If we also include a neutrino mass of eV we obtain the red contours. At the difference between black and the blue contours is for . When introducing a neutrino mass (red contours) there is another shift of . We therefore conclude that while the CFHTLenS constraint shows some sensitivity to the exact treatment of non-linear clustering, it does not seem to be very sensitive to the effect of the neutrino mass. Note that all shifts shown in Figure 4 (right) lead to a smaller clustering amplitude (at fixed ) and therefore would increase the preference for neutrino mass (see next section).
Here we are not explicitly testing the reliability of the galaxy-galaxy lensing result of Mandelbaum et al. (2013) which we are also going to use later in this analysis, but refer the reader to section 2.3.2 in Mandelbaum et al. (2013).
5 Constraining the mass of neutrinos
| dataset(s) | [eV] | |||
| c.l. | c.l. | |||
| WMAP9 | ||||
| WMAP9+CFHTLenS | ||||
| WMAP9+Beutler2013 | ||||
| WMAP9+Beutler2013+CFHTLenS | ||||
| WMAP9+Beutler2013+GGlensing | ||||
| WMAP9+Beutler2013+CFHTLenS+GGlensing+BAO | ||||
| WMAP9+Samushia2013 | ||||
| WMAP9+Samushia2013+CFHTLenS+GGlensing+BAO | ||||
| WMAP9+Chuang2013 | ||||
| WMAP9+Chuang2013+CFHTLenS+GGlensing+BAO | ||||
| WMAP9+Anderson2013 | ||||
| WMAP9+Anderson2013+BAO | ||||
| WMAP9+Anderson2013+CFHTLenS+GGlensing+BAO | ||||
| Planck | ||||
| Planck+CFHTLenS | ||||
| Planck+Beutler2013 | ||||
| Planck+Beutler2013+CFHTLenS | ||||
| Planck+Beutler2013+GGlensing | ||||
| Planck+Beutler2013+CFHTLenS+GGlensing+BAO | ||||
| Planck+CMBlensing+Beutler2013+CFHTLenS+GGlensing+BAO | ||||
| Planck+Samushia2013 | ||||
| Planck+Samushia2013+CFHTLenS+GGlensing+BAO | ||||
| Planck+Chuang2013 | ||||
| Planck+Chuang2013+CFHTLenS+GGlensing+BAO | ||||
| Planck+Anderson2013 | ||||
| Planck+Anderson2013+BAO | ||||
| Planck+Anderson2013+CFHTLenS+GGlensing+BAO | ||||
| Planck+CMBlensing+Anderson2013+CFHTLenS+GGlensing+BAO | ||||
| Planck+CMBlensing | ||||
| Planck | ||||
| Planck+CFHTLenS | ||||
| Planck+Beutler2013 | ||||
| Planck+Beutler2013+CFHTLenS | ||||
| Planck+Beutler2013+GGlensing | ||||
| Planck+Beutler2013+CFHTLenS+GGlensing+BAO | ||||
| Planck+CMBlensing+Beutler2013+CFHTLenS+GGlensing+BAO | ||||
| Planck+Samushia2013 | ||||
| Planck+Samushia2013+CFHTLenS+GGlensing+BAO | ||||
| Planck+Chuang2013 | ||||
| Planck+Chuang2013+CFHTLenS+GGlensing+BAO | ||||
| Planck+Anderson2013 | ||||
| Planck+Anderson2013+BAO | ||||
| Planck+Anderson2013+CFHTLenS+GGlensing+BAO | ||||
| Planck+CMBlensing+Anderson2013+CFHTLenS+GGlensing+BAO | ||||
| Planck+CMBlensing | ||||
| Spergel2013 | ||||
| Spergel2013+CFHTLenS | ||||
| Spergel2013+Beutler2013 | ||||
| Spergel2013+Beutler2013+CFHTLenS | ||||
| Spergel2013+Beutler2013+GGlensing | ||||
| Spergel2013+Beutler2013+CFHTLenS+GGlensing+BAO | ||||
| Spergel2013+Samushia2013 | ||||
| Spergel2013+Samushia2013+CFHTLenS+GGlensing+BAO | ||||
| Spergel2013+Chuang2013 | ||||
| Spergel2013+Chuang2013+CFHTLenS+GGlensing+BAO | ||||
| Spergel2013+Anderson2013 | ||||
| Spergel2013+Anderson2013+BAO | ||||
| Spergel2013+Anderson2013+CFHTLenS+GGlensing+BAO | ||||
Knowing that our CMASS measurements and the weak lensing constraints are quite insensitive to the fiducial neutrino mass we now combine these constraints with CMB data from WMAP911 1 http://lambda.gsfc.nasa.gov/product/map/current/ and Planck22 2 http://irsa.ipac.caltech.edu/data/Planck/release_1/ancillary-data/. We importance sample the CMB MCMC chains, where is varied freely. Importance sampling means that we adjust the weight of each chain element in the original CMB chain by the likelihood, , of some external dataset, according to
| (11) |
The distribution of these new weights reflects the combined likelihood.
To provide constraints on some combination of and we adopted the CMASS measurement of Beutler et al. (2013), the CFHTLenS constraint reported in Kilbinger et al. (2013),
| (12) |
and the galaxy-galaxy lensing result reported in Mandelbaum et al. (2013),
| (13) |
We prefer to use the full degeneracy lines (eq. 12 and 13) from these lensing results instead of the actual likelihoods. This approach is more conservative and does not affect our final results given the power of the BAO scale to break the degeneracy between and . We occasionally also include the BAO constraint of 6dFGS (Beutler et al., 2011) and LOWZ (Anderson et al., 2013b; Tojeiro et al., 2014). In section 6 we will discuss the significance with which these datasets prefer CDM over CDM.


5.1 Combining with WMAP9
We start with importance sampling the WMAP9 chains33 3 htp://lambda.gsfc.nasa.gov/product/map/current/. To illustrate the constraining power of the different datasets we use them one by one, before combining them. These results are summarised in Table 2 and shown in Figure 5 and Figure 6. Using WMAP9 alone already allows a constraint on of eV with confidence level. If we add BAO constraints, where we use the isotropic CMASS constraint after density field reconstruction from Anderson et al. (2013b) (Anderson2013b), we obtain an upper limit of eV with confidence level. Therefore adding current BAO information already improves the constraint by more than a factor of two. The CMB combined with BAO constrain the neutrino mass purely from its effect on the geometry of the Universe, with the BAO particularly helping to break the degeneracy between and (see e.g. Hou et al. 2012).
Next we use the lensing results from CFHTLenS (Kilbinger et al., 2013) and galaxy-galaxy lensing (Mandelbaum et al., 2013) (GGlensing). The degeneracy lines in these lensing results are similar to the degeneracy in the CMB and therefore combining WMAP9 with only weak lensing measurements does not improve the neutrino mass constraint significantly (see Table 2 for details). The true power of the lensing datasets arises with the addition of the BAO information. The BAO constraints basically fix , which, combined with weak lensing allows tight constraints on . These constraints are almost a factor of two better than CMB+BAO and improve the neutrino mass constraint significantly. The same arguments hold for the constraint from galaxy surveys. Since one can obtain both, the BAO scale measurement and the growth of structure measurement from galaxy surveys, we can combine just two datasets, WMAP9 and CMASS, to obtain tight constraints on the neutrino mass. Combining the CMASS-DR11 results for , and reported in eq. 68 and 70 of Beutler et al. (2013) with WMAP9 produces eV, which represents a preference for neutrino mass. Adding CFHTLenS further improves this constraint to eV, which represents a detection. Replacing CFHTLenS with galaxy-galaxy lensing from Mandelbaum et al. (2013) (GGlensing) leads to basically the same result. Combining all datasets, including further BAO constraints from 6dFGS and LOWZ, yields eV (). The final result does not change significantly if we use the constraints of Samushia et al. (2013) (Samushia2013b), Chuang et al. (2013) (Chuang2013) or the BAO-only constraints of Anderson et al. (2013b) (Anderson2013b) instead of Beutler et al. (2013).

5.2 Combining with Planck
We now replace the WMAP9 dataset with Planck44 4 http://irsa.ipac.caltech.edu/data/Planck/release_1/ancillary-data/ and repeat the exercise of the last section. The results are summarised in Table 2 and shown in Figure 7 (upper two plots) and Figure 8 (top). Combining Planck with the results of Beutler et al. (2013) yields a mild preference for neutrino mass of eV ( c.l.) or an upper limit of eV with confidence level. Including CFHTLenS produces eV. Adding galaxy-galaxy lensing or further BAO measurements results in a preference of neutrino mass yielding eV. When replacing the result of Beutler et al. (2013) with Samushia et al. (2013), Chuang et al. (2013) or Anderson et al. (2013b) we find consistent results. Note that since Planck is in tension with some of the other datasets, importance sampling does rely on fairly low density regions in the Planck chains. We conclude that these results cannot be used to claim a significant detection of the neutrino mass.


5.3 Combining with Planck marginalised over
Table 2 also includes results using Planck MCMC chains where the lensing contribution to the temperature power spectrum has been marginalised out. We denote this chain Planck since is the parameter used to mimic the lensing effect on the CMB temperature power spectrum (smoothing of the higher order peaks). One must keep in mind, however, that is not a physical parameter, but only a way to remove the lensing effect from the CMB power spectrum data. To avoid confusion, from now on we will designate the lensing contribution to the temperature power spectrum as -lensing and the lensing signal in the 4-point function as CMB lensing (or CMBlensing in Table 2). The WMAP dataset is not sensitive to gravitational lensing, because this effect is only significant at large multipoles.
The Planck collaboration reports some anomalies with respect to the -lensing contribution. When including the parameter in the fit, Planck reports (Planck+WP) (Ade et al., 2013a), which is from the expected value of , while the lensing effect in the 4-point function produces (Ade et al., 2013c). Thus the -lensing contribution is in (small) tension with the overall Planck results and with the -point function lensing of Planck. The CMB lensing of Planck favours larger neutrino masses compared to the rest of Planck, which therefore leads to a weakening of the neutrino mass constraints when CMB lensing is included (see Ade et al. 2013a section 6.3.1). We show these results in Table 2, where Planck+WP gives eV, while Planck+WP+CMBlensing yields eV. While the neutrino mass constraints improve if ACT (Das et al., 2013) and SPT (Keisler et al., 2011) data (highL) are included, it does not relieve the tensions with -lensing. Because of the points mention above it is interesting to investigate what happens with the Planck data when the -lensing signal is excluded.
Excluding the -lensing contribution significantly degrades the constraints on the neutrino mass from Planck alone, since these constraints are dominated by the -lensing effect. This, however, has little effect on our analysis, since we can break the - degeneracy more efficiently with the low-redshift datasets. Another effect of marginalising over is much more significant. Marginalising over leads to shifts in and . Within CDM including the default value of eV, the Planck team found for :
| (14) | ||||
| (15) |
and for :
| (16) | ||||
| (17) |
These shifts bring Planck in much better agreement with WMAP9. Since we still have a high value of compared to the growth of structure measurements, we still have a preference for a neutrino mass, similar to the results in WMAP9.
Combining Planck with the results of Beutler et al. (2013) produces eV, in excellent agreement with the result obtained when combining with WMAP9. Including CFHTLenS yields eV, and adding galaxy-galaxy lensing and further BAO constraints improves this detection to eV (). This detection is robust against various dataset variations as shown in Table 2. The results are also presented in Figure 7 (lower two plots) and Figure 8 (middle).
5.4 Combining with the Planck re-analysis of Spergel, Flauger & Hlozek (2013)
Spergel, Flauger & Hlozek (2013) re-analysed the Planck data with a different treatment for foreground cleaning, which has a notable effect on the GHz spectra. From now on we will call this analysis Spergel2013. Their result shows shifts in and towards smaller values. Similar shifts caused by different foreground removal techniques have been reported by the Planck collaboration (Ade et al., 2013d). These changes in and are smaller, but similar to the shifts we found by excluding the -lensing contribution. We saw that such shifts can significantly alter the constraints on .
We now use the MCMC chains of Spergel, Flauger & Hlozek (2013), where the neutrino mass is varied freely and importance sample these chains. The chains we use include the AL-lensing signal, meaning they do not marginalise over . The CMB lensing signal from the -point function is not included. The result is shown in Figure 8 (bottom), Figure 9 and Table 2. Combining Spergel2013 with the results of Beutler et al. (2013) yields eV. Including CFHTLenS, GGlensing and further BAO constraints gives eV (). These results are within with the results we obtained when importance sampling the Planck and the Planck- chains. Overall we see small (below ) shifts towards WMAP.


6 Discussion
We can summarise the results of the last section as follows:
- 1.
We have a significant () detection of the neutrino mass when combining WMAP9 and Planck with low redshift growth of structure constraints. Planck represents the Planck dataset without the lensing contribution to the temperature power spectrum.
- 2.
The -lensing contribution leads to shifts in and , which have a non-negligible impact on the neutrino mass constraints.
- 3.
When using Planck including the lensing contribution to the temperature power spectrum the significance of the detection of the neutrino mass is reduced to .
- 4.
The Planck re-analysis by Spergel, Flauger & Hlozek (2013) shows results very similar to Planck with a slightly increased significance for the neutrino mass.
It might not be too surprising that excluding the -lensing result brings Planck closer to WMAP9, since the -lensing contribution is unique to Planck and removing it increases the fraction of information common to the two datasets. Nevertheless, since there is a tension between the -lensing and the CMB lensing in the -point function, it is interesting to examine the Planck data excluding the -lensing signal, especially given the shifts in and , which significantly alter the constraints on .
The left panel in Figure 5, Figure 7 and Figure 9 show how the two dimensional constraints on and migrate when different datasets are included. The external datasets pull the combined constraint out of the confidence region of Planck (top panel of Figure 7), indicating that increasing does not resolve the tension between Planck and low redshift growth of structure constraints. WMAP9 and Planck present a different situation. Here the final constraints using all datasets lie within the confidence region of the CMB datasets.
Figure 6 and Figure 8 display the one-dimensional likelihood of when combining low redshift growth of structure datasets with WMAP9, Planck, Planck and Spergel2013. While there is a prominent detection in the case of WMAP9 and Planck, the detection in Planck is of low significance. The Planck re-analysis of Spergel, Flauger & Hlozek (2013) shows a likelihood distribution very similar to the one obtained with the main Planck analysis.
We also note that there is tension between different components of the Planck dataset. While the amplitude of the -lensing in the -point function prefers a small neutrino mass, the shape of the CMB lensing in the -point function prefers a large neutrino mass. In Table 2 we can see that after marginalising over the Planck dataset combined with CMB lensing prefers a neutrino mass of eV with more than .
To quantify the differences between the Planck and Planck chains used in this analysis we can look at for the best fitting cosmological parameters when combining the CMB datasets with Beutler et al. (2013), CFHTLenS, galaxy-galaxy lensing and the BAO constraints of 6dFGS and LOWZ. Within CDM we find , while for CDM we have . In both cases the is reduced when excluding the -lensing contribution. We can also quantify which datasets drive the preference for neutrino mass. Considering the following dataset combinations (Planck, Planck+BAO, CFHTLenS+GGlensing, Beutler2013, Beutler2013BAOonly), where BAO stands for the BAO constraints of 6dFGS and LOWZ, Beutler2013 stands for the three CMASS constraints (, , ) of Beutler et al. (2013) and Beutler2013BAOonly represents only the BAO constraint (). Note that and of Beutler et al. (2013) are correlated and we can not easily explore the effect of just one of these constraints. We find the following values for the best fitting cosmology, when comparing CDM and CDM: (, , , , ). The preference for neutrino mass in the case of Planck is driven by the CMASS and lensing constraints. If we instead use the best fitting cosmological parameters in case of Planck and again consider the dataset combinations (Planck, Planck+BAO, CFHTLenS+GGlensing, Beutler2013, Beutler2013BAOonly) we find (, , , , ). Again the preference for neutrino mass is driven by the CMASS and lensing constraints. Comparing Beutler2013 and Beutler2013BAOonly we see that it is mainly the RSD (and AP) constraints which drive the preference for neutrino mass within CMASS.
While in this paper we focus on the neutrino mass as a possible extension to CDM, it is interesting to ask whether other parameters would also be able to alleviate the tension between the different datasets discussed in this paper. Comparing the best fitting of a universe with curvature as a free parameter (oCDM) to the best fitting when varying the neutrino mass we find , meaning that the neutrino mass is preferred as an extension to CDM. Including instead a dark energy equation of state parameter (wCDM) we find , showing only mild preference for the neutrino mass parameter. If we include the neutrino mass as well as the number of relativistic species, , as free parameters we find . While the is reduced, the reduction of is not sufficient to justify the new parameter. We also note that the new parameter does not remove the preference for a non-zero neutrino mass, with the best fitting values being and .
Combining CMB datasets with external information on the Hubble parameter allows one to break the geometric degeneracy between and the neutrino mass parameter (Komatsu et al., 2009) similar to the BAO constraints. A large neutrino mass leads to a smaller Hubble Constant and vice versa. Since the low redshift constraints using the distance ladder technique seem to find large values of (Riess et al., 2011; Freedman et al., 2012; Efstathiou, 2013) compared to CMB or BAO measurements, including the low redshift constraints usually does not lead to a detection of the neutrino mass (see e.g. Hou et al. 2012; Verde, Protopapas & Jimenez 2013; Riemer-Sorensen, Parkinson & Davis 2013; de Putter et al. 2014; Zheng et al. 2014).
Sanchez et al. (2013) reported an upper limit on the neutrino mass of eV ( c.l.) using data from Planck, ACT and SPT, combined with CMASS-DR11. Their use of the CMASS-DR11 dataset is different to our analysis, since they make use of the shape of the correlation function wedges. Nevertheless, their result is consistent with our c.l. upper limit in Planck. When using WMAP9 instead of Planck, Sanchez et al. (2013) find eV, which again is in agreement with our result.
A tight constraint on the neutrino mass of eV ( c.l.) has been reported in Seljak, Slosar & McDonald (2006) by combining Ly- forest power spectrum information with WMAP3 as well as supernovae and galaxy clustering constraints. One reason they achieved such a tight constraint was that their Ly- forest measurement was in tension with WMAP3. Since this Ly- forest measurement is now in good agreement with Planck, their upper limit would weaken.
In addition to these non-detections, there are many studies which report a detection of the neutrino mass (see e.g., Hou et al. 2012; Ade et al. 2013b; Wyman et al. 2013; Rozo et al. 2013). Battye & Moss (2013) showed that the Planck+CFHTLenS constraints are compatible with the constraints obtained when combining Planck with the SZ-cluster results also reported by the Planck team. They then performed an analysis combining Planck with BAO, CFHTLenS and SZ-clusters finding eV, which is in good agreement with our results. This constraint is however dominated by the SZ-cluster constraint which suffers from various systematic errors (Costanzi et al., 2013; Rozo et al., 2012; Rozo et al., 2013; von der Linden et al., 2014; Paranjape, 2014).
6.1 Implications for General Relativity
| dataset(s) | [eV] | ||
|---|---|---|---|
| c.l. | c.l. | ||
| WMAP9+Beutler2013 | |||
| Planck+Beutler2013 | |||
| WMAP9+Beutler2013 (CDM) | — | — | |
| Planck+Beutler2013 (CDM) | — | — | |


Beutler et al. (2013) combined CMASS-DR11 results with Planck and WMAP9 to test General Relativity (GR) using the simple -parameterisation, where the growth rate is given by (Linder, 2005). Beutler et al. (2013) found when combining with Planck and when combining with WMAP9. These results are in tension with the GR prediction of . The question is now, what are the implications of a neutrino mass for these results?
As discussed in Beutler et al. (2013), the tension with GR is mainly caused by the large in the CMB datasets. Since introducing a neutrino mass reduces the CMB prediction of , we can expect that a non-zero neutrino mass will also decrease the tension with GR. The reason to combine the clustering result of CMASS with a CMB dataset is the need to add information on to be able to test gravity through the growth rate . Since the uncertainty in significantly increases when the neutrino mass is varied freely, we expect that the error on will increase as well.
Here we use the two CMB chains with the strongest signs of a neutrino mass, which are WMAP9 and Planck. We use the chains which have the sum of the neutrino masses as a free parameter. We importance sample these chains and include as an additional free parameter following the procedure of section 9.1 in Beutler et al. (2013). Marginalising over all other parameters we find for WMAP9 and for Planck. Both results are in agreement with the GR prediction. The result for the Planck chain is shown in Figure 10 and Figure 11. Even though the constraints on the sum of the neutrino masses for this test are significantly degraded, because of the degeneracy with , we include them in Table 3. Figure 11 compares the result of this analysis (red datapoint) with the result in Beutler et al. (2013) (blue datapoint). It might not be surprising that the tension with GR in Beutler et al. (2013) can be reduced by introducing a new parameter, especially if this parameter is degenerate with .
6.2 Implications for particle physics
Although our evidence of the neutrino mass has to be taken with care given the significance of the detection (- ) and the tension with the -lensing contribution to the Planck measurement, it is still interesting to investigate the implications of such a result.
What are the implications for the masses of the neutrino eigenstates? We use the mass difference eV2 (Beringer et al., 2012) and our measurement eV, which was obtained by combining Planck with Beutler et al. (2013), CFHTLenS, galaxy-galaxy lensing and BAO constraints from 6dFGS and LOWZ. If we further assume three neutrinos arranged by the normal hierarchy with the two light neutrinos () having the same mass, we find eV and eV. For the inverted hierarchy we get instead eV and eV.
Given a certain hierarchy we can calculate the flavour eigenstates using the mixing matrix (Pontecorvo-Maki-Nakagawa-Sakata matrix)
| (18) |
where we assume any possible complex phase to be zero and use the mixing angles from Beringer et al. (2012) and An et al. (2013). The flavour eigenstates are then given as super-position of the mass eigenstates
| (19) |
Because of neutrino mixing, the observable of different direct neutrino mass experiments is different to the flavour states. Neutrino-less double beta decay () experiments are sensitive to the mass
| (20) |
while beta-decay experiments are sensitive to
| (21) |
Taking the constraints on the mass eigenstates above together with the mixing matrix we find eV for the normal hierarchy and eV for the inverted hierarchy55 5 The errors on the mixing angles are not propagated, since the error budget is dominated by the uncertainty in the sum of the neutrino masses.. Since the masses are close to degenerate and because is small compared to and , the values of are basically identical to . The value of in both hierarchies is below the predicted sensitivity range of the KATRIN experiment.
7 Conclusion
This paper presents an investigation of the cosmological implications of the CMASS-DR11 anisotropic analysis including the growth of structure measurement, with particular focus on the sum of the neutrino masses .
First we examine the robustness of the CMASS constraints of Beutler et al. (2013) when changing the power spectrum template including eV. Our main cosmological parameters change by and therefore are robust against variations in the neutrino mass. We perform similar tests for the weak lensing results from CFHTLenS, finding that these results show only weak dependence on the initial assumption of the neutrino mass parameter.
We use the WMAP9 and Planck MCMC chains where the sum of the neutrino masses is varied as a free parameter and importance sample these chains. When combining WMAP9 with the three constraints of Beutler et al. (2013) we obtain eV, which represents a preference for the neutrino mass. If we also include CFHTLenS, galaxy-galaxy lensing and the BAO constraints from 6dFGS and LOWZ, we find eV ().
Using the Planck dataset the preference for a neutrino mass is reduced to . However, marginalising over the -lensing contribution to the temperature power spectrum of Planck leads to shifts in and , which bring Planck into much better agreement with WMAP9. Combining Planck without the -lensing contribution with CMASS yields similar results to WMAP9. We find eV () when combining with Beutler et al. (2013), CFHTLenS, galaxy-galaxy lensing and further BAO constraints. This constraint is robust against various permutations of datasets (see Table 2 for details). We also investigated the Planck re-analysis of Spergel, Flauger & Hlozek (2013), finding that it yields results very similar to Planck with a slightly increased significance for a neutrino mass. While the preference for neutrino mass is driven mainly by the low redshift growth of structure constraints it is reassuring that the three growth of structure datasets included in this analysis (CMASS-RSD, CFHTLenS and galaxy-galaxy lensing) yield consistent results. Our constraints could be significantly improved by including cluster counts detected through the Sunyaev-Zeldovich effect. We chose, however, to not include these datasets, because of the significant systematic uncertainty of these measurements with respect to the treatment of the neutrino mass.
In this paper we present many combinations of datasets and a natural question is, which of these presents the main result of this paper. When discussing the implications of our results in section 6.2, we selected the constraint eV, obtained with the Planck chain. However, we cannot conclusively put this forward as the fiducial result of our analysis, without having an explanation for the tension with the -lensing amplitude. The origin of the tension between the different components in the Planck dataset remains an open question, which we will hopefully learn more about with the next data release of Planck.
A neutrino mass at this level would relieve the tension of current datasets with the clustering prediction of GR reported in Beutler et al. (2013). If we remove the -lensing contribution to Planck and combine with the constraints of Beutler et al. (2013) by varying the neutrino mass and the growth index as free parameters, where , we find . This result is in agreement with the GR prediction of . Similar results are obtained for WMAP9.
If our result is confirmed by future, more precise cosmological measurements, it will have significant implications for particle physics and cosmology. The constraint eV can be expressed as
| (22) | ||||
| (23) |
The large value of found in our analysis would be too large to allow for cosmological probes to distinguish between the inverted and the normal mass hierarchies just by the measurement of the sum of the masses. However, within the normal hierarchy we can predict eV, while for the inverted hierarchy we find eV. These masses are below the predicted detection limits of the KATRIN experiment (assuming a sensitivity of eV Wolf 2008).
The constraints presented in this paper will be further improved in the near future. Within the CMASS dataset the weakest point of the constraint is certainly the large uncertainty on , which, however, is predicted to improve significantly with future datasets like the Dark Energy Spectroscopic Instrument (DESI) (Font-Ribera et al., 2013; Abazajian et al., 2013). Even the BOSS dataset could provide additional constraints on the neutrino mass using the characteristic scale-dependent damping of the power spectrum (see Zhao et al. 2013 for such an attempt) which, however, requires refined simulations including massive neutrinos (Villaescusa-Navarro et al., 2013).
Acknowledgments
We would like to thank Renee Hlozek for providing the MCMC chains for the Planck re-analysis. FB would like to thank Martin Kilbinger and Catherine Heymans for help with the CFHTLenS dataset and CosmoPMC. FB would also like to thank Martin White, Uros Seljak, Eric Linder, Daniel Dwyer, Morag Scrimgeour, Michael Mortonson, Marcel Schmittful and Blake Sherwin for helpful discussion. SS would like to thank Kiyotomo Ichiki and Masahiro Takada for providing their MCMC code for weak lensing analysis and for useful discussions. SS is supported by a Grant-in-Aid for Young Scientists (Start-up) from the Japan Society for the Promotion of Science (JSPS) (No. 25887012).
Funding for SDSS-III has been provided by the Alfred P. Sloan Foundation, the Participating Institutions, the National Science Foundation, and the U.S. Department of Energy Office of Science. The SDSS-III web site is http://www.sdss3.org/.
SDSS-III is managed by the Astrophysical Research Consortium for the Participating Institutions of the SDSS-III Collaboration including the University of Arizona, the Brazilian Participation Group, Brookhaven National Laboratory, Carnegie Mellon University, University of Florida, the French Participation Group, the German Participation Group, Harvard University, the Instituto de Astrofisica de Canarias, the Michigan State/Notre Dame/JINA Participation Group, Johns Hopkins University, Lawrence Berkeley National Laboratory, Max Planck Institute for Astrophysics, Max Planck Institute for Extraterrestrial Physics, New Mexico State University, New York University, Ohio State University, Pennsylvania State University, University of Portsmouth, Princeton University, the Spanish Participation Group, University of Tokyo, University of Utah, Vanderbilt University, University of Virginia, University of Washington, and Yale University.
This research used resources of the National Energy Research Scientific Computing Center, which is supported by the Office of Science of the U.S. Department of Energy under Contract No. DE-AC02-05CH11231.
References
- Abazajian et al. (2009) Abazajian K. N. et al. [SDSS Collaboration], Astrophys. J. Suppl. 182, 543 (2009) [arXiv:0812.0649 [astro-ph]].
- Abazajian et al. (2013) Abazajian K. N. et al., arXiv:1309.5383 [astro-ph.CO].
- Ade et al. (2013a) Ade P. A. R. et al. [Planck Collaboration], arXiv:1303.5076 [astro-ph.CO].
- Ade et al. (2013b) Ade P. A. R. et al. [Planck Collaboration], arXiv:1303.5080 [astro-ph.CO].
- Ade et al. (2013c) Ade P. A. R. et al. [Planck Collaboration], arXiv:1303.5078 [astro-ph.CO].
- Ade et al. (2013d) Ade P. A. R. et al. [ Planck Collaboration], arXiv:1303.5072 [astro-ph.CO].
- Ade et al. (2013e) Ade P. A. R. et al. [Planck Collaboration], arXiv:1303.5079 [astro-ph.CO].
- Ahn et al. (2012) Ahn C. P. et al. [SDSS Collaboration], Astrophys. J. Suppl. 203, 21 (2012) [arXiv:1207.7137 [astro-ph.IM]].
- An et al. (2013) An F. P. et al. [Daya Bay Collaboration], arXiv:1310.6732 [hep-ex].
- Anderson et al. (2013a) Anderson L. et al., arXiv:1303.4666 [astro-ph.CO].
- Anderson et al. (2013b) Anderson L., et al., arXiv:1312.4877 [astro-ph.CO].
- Battye & Moss (2013) Battye R. A. and Moss A., arXiv:1308.5870v2 [astro-ph.CO].
- Benjamin et al. (2013) Benjamin J. et al., arXiv:1212.3327 [astro-ph.CO].
- Benson et al. (2013) Benson B. A. et al., Astrophys. J. 763, 147 (2013) [arXiv:1112.5435 [astro-ph.CO]].
- Beringer et al. (2012) Beringer J. et al. [Particle Data Group Collaboration], Phys. Rev. D 86, 010001 (2012).
- Beutler et al. (2011) Beutler F. et al., Mon. Not. Roy. Astron. Soc. 416, 3017 (2011) [arXiv:1106.3366 [astro-ph.CO]].
- Beutler et al. (2012) Beutler F. et al., Mon. Not. Roy. Astron. Soc. 423, 3430 (2012) [arXiv:1204.4725 [astro-ph.CO]].
- Beutler et al. (2013) Beutler F. et al., arXiv:1312.4611 [astro-ph.CO].
- Bird, Viel & Haehnelt (2012) Bird S., Viel M. and Haehnelt M. G., Mon. Not. Roy. Astron. Soc. 420, 2551 (2012) [arXiv:1109.4416 [astro-ph.CO]].
- Blake et al. (2011) Blake C. et al., Mon. Not. Roy. Astron. Soc. 415, 2876 (2011) [arXiv:1104.2948 [astro-ph.CO]].
- Bolton et al. (2012) Bolton A. S. et al. [Cutler Group, LP Collaboration], 2012 144, 144 [arXiv:1207.7326 [astro-ph.CO]].
- Bond, Efstathiou & Silk (1980) Bond J. R., Efstathiou G. and Silk J., Phys. Rev. Lett. 45, 1980 (1980).
- Brandbyge et al. (2008) Brandbyge J., Hannestad S., Haugbolle T. and Thomsen B., JCAP 0808, 020 (2008) [arXiv:0802.3700 [astro-ph]].
- Burenin (2013) Burenin R. A., Astron. Lett. 39, 357 (2013) [arXiv:1301.4791 [astro-ph.CO]].
- Chuang et al. (2013) Chuang C. -H., et al., arXiv:1312.4889 [astro-ph.CO].
- Costanzi et al. (2013) Costanzi M., Villaescusa-Navarro F., Viel M., Xia J. -Q., Borgani S., Castorina E. and Sefusatti E., arXiv:1311.1514 [astro-ph.CO].
- Das et al. (2013) Das S. et al., arXiv:1301.1037 [astro-ph.CO].
- Dawson et al. (2013) Dawson K. S. et al. [BOSS Collaboration], arXiv:1208.0022 [astro-ph.CO].
- de Putter et al. (2012) de Putter R. et al., Astrophys. J. 761, 12 (2012) [arXiv:1201.1909 [astro-ph.CO]].
- de Putter et al. (2014) de Putter R., Linder E. V. and Mishra A., arXiv:1401.7022 [astro-ph.CO].
- Dodelson, Gates & Stebbins (1996) Dodelson D., Gates E. and Stebbins A., Astrophys. J. 467, 10 (1996) [astro-ph/9509147].
- Doi et al. (2010) Doi M. et al., Astron. J. 139 (2010) 1628 [arXiv:1002.3701 [astro-ph.IM]].
- Dunkley et al. (2009) Dunkley J. et al. [WMAP Collaboration], Astrophys. J. Suppl. 180, 306 (2009) [arXiv:0803.0586 [astro-ph]].
- Efstathiou (2013) Efstathiou G., arXiv:1311.3461 [astro-ph.CO].
- Eisenstein & Hu (1997) Eisenstein D. J. and Hu W., Astrophys. J. 511, 5 (1997) [astro-ph/9710252].
- Eisenstein & Hu (1998) Eisenstein D. J. and Hu W., Astrophys. J. 496, 605 (1998) [astro-ph/9709112].
- Eisenstein et al. (2011) Eisenstein D. J. et al. [SDSS Collaboration], Astron. J. 142, 72 (2011) [arXiv:1101.1529 [astro-ph.IM]].
- Erben et al. (2013) Erben T. et al., arXiv:1210.8156 [astro-ph.CO].
- Font-Ribera et al. (2013) Font-Ribera A., McDonald P., Mostek N., Reid B. A., Seo H. -J. and Slosar A., arXiv:1308.4164 [astro-ph.CO].
- Freedman et al. (2012) Freedman W. L., Madore B. F., Scowcroft V., Burns C., Monson A., Persson S. E., Seibert M. and Rigby J., Astrophys. J. 758, 24 (2012) [arXiv:1208.3281 [astro-ph.CO]].
- Fukugita et al. (1996) Fukugita M., Ichikawa T., Gunn J. E., Doi M., Shimasaku K. and Schneider D. P., Astron. J. 111, 1748 (1996).
- Gando et al. (2013) Gando A. et al. [KamLAND-Zen Collaboration], Phys. Rev. Lett. 110, no. 6, 062502 (2013) [arXiv:1211.3863 [hep-ex]].
- Giusarma et al. (2013) Giusarma E., de Putter R., Ho S. and Mena O., Phys. Rev. D 88, 063515 (2013) [arXiv:1306.5544 [astro-ph.CO]].
- Gong et al. (2009) Gong Y., Zhang T. -J., Lan T. and Chen X. -L., arXiv:0810.3572 [astro-ph].
- Gunn et al. (1998) Gunn J. E. et al. [SDSS Collaboration], Astron. J. 116, 3040 (1998) [astro-ph/9809085].
- Gunn et al. (2006) Gunn J. E. et al. [SDSS Collaboration], Astron. J. 131, 2332 (2006) [astro-ph/0602326].
- Hamann & Hasenkamp (2013) Hamann J. and Hasenkamp J., JCAP 1310, 044 (2013) [arXiv:1308.3255 [astro-ph.CO]].
- Hawkins et al. (2003) Hawkins E. et al., Mon. Not. Roy. Astron. Soc. 346, 78 (2003) [astro-ph/0212375].
- Heymans et al. (2012) Heymans C. et al., arXiv:1210.0032 [astro-ph.CO].
- Hildebrandt et al. (2012) Hildebrandt H. et al., arXiv:1111.4434 [astro-ph.CO].
- Hinshaw et al. (2009) Hinshaw G. et al. [WMAP Collaboration], Astrophys. J. Suppl. 180, 225 (2009) [arXiv:0803.0732 [astro-ph]].
- Hinshaw et al. (2013) Hinshaw G. et al. [WMAP Collaboration], Astrophys. J. Suppl. 208, 19 (2013) [arXiv:1212.5226 [astro-ph.CO]].
- Hou et al. (2012) Hou Z. et al., arXiv:1212.6267 [astro-ph.CO].
- Hu, Eisenstein & Tegmark (1998) Hu W., Eisenstein D. J. and Tegmark M., Phys. Rev. Lett. 80, 5255 (1998) [astro-ph/9712057].
- Hulse & Taylor (1975) Hulse R. A. and Taylor J. H., Astrophys. J. 195, L51 (1975).
- Ichikawa, Fukugita & Kawasaki (2005) Ichikawa K., Fukugita M. and Kawasaki M., Phys. Rev. D 71, 043001 (2005) [astro-ph/0409768].
- Ichiki, Takada & Takahashi (2009) Ichiki K., Takada M. and Takahashi T., Phys. Rev. D 79, 023520 (2009) [arXiv:0810.4921 [astro-ph]].
- Keisler et al. (2011) Keisler R. et al., Astrophys. J. 743, 28 (2011) [arXiv:1105.3182 [astro-ph.CO]].
- Kilbinger et al. (2011) Kilbinger M., Benabed K., Cappe O., Cardoso J. -F., Fort G., Prunet S., Robert C. P. and Wraith D., arXiv:1101.0950 [astro-ph.CO].
- Kilbinger et al. (2013) Kilbinger M. et al., Monthly Notices of the Royal Astronomical Society 430, no. 3, 2200 (2013) [arXiv:1212.3338 [astro-ph.CO]].
- Komatsu et al. (2009) Komatsu E. et al. [WMAP Collaboration], Astrophys. J. Suppl. 180, 330 (2009) [arXiv:0803.0547 [astro-ph]].
- Komatsu et al. (2011) Komatsu E. et al. [WMAP Collaboration], Astrophys. J. Suppl. 192, 18 (2011) [arXiv:1001.4538 [astro-ph.CO]].
- Lesgourgues & Pastor (2006) Lesgourgues J. and Pastor S., Phys. Rept. 429, 307 (2006) [astro-ph/0603494].
- Lesgourgues & Pastor (2012) Lesgourgues J. and Pastor S., Adv. High Energy Phys. 2012, 608515 (2012) [arXiv:1212.6154 [hep-ph]].
- Lesgourgues et al. (2013) Lesgourgues J, Mangano G., Miele G. & Dr Sergio Pastor S. Neutrino Cosmology, ISBN 978-1107013957
- Lewis & Bridle (2002) Lewis A. and Bridle S., Phys. Rev. D 66, 103511 (2002) [astro-ph/0205436].
- Li et al. (2009) Li H., Liu J., Xia J. -Q., Sun L., Fan Z. -H., Tao C., Tilquin A. and Zhang X., Phys. Lett. B 675, 164 (2009) [arXiv:0812.1672 [astro-ph]].
- Linder (2005) Linder E. V., Phys. Rev. D 72, 043529 (2005) [astro-ph/0507263].
- Lobashev et al. (1999) Lobashev V. M. et al., Phys. Lett. B 460, 227 (1999).
- Mandelbaum et al. (2013) Mandelbaum R., Slosar A., Baldauf T., Seljak U., Hirata C. M., Nakajima R., Reyes R. and Smith R. E., arXiv:1207.1120 [astro-ph.CO].
- Miller et al. (2013) Miller L. et al., arXiv:1210.8201 [astro-ph.CO].
- Oka et al. (2013) Oka A. et al. arXiv:1310.2820 [astro-ph.CO].
- Paranjape (2014) Paranjape A., arXiv:1403.3402 [astro-ph.CO].
- Pound & Rebka (1960) Pound R. V. and Rebka, Jr. G. A., Phys. Rev. Lett. 4, 337 (1960).
- Reid et al. (2010) Reid B. A., Verde L., Jimenez R. and Mena O., JCAP 1001, 003 (2010) [arXiv:0910.0008 [astro-ph.CO]].
- Riemer-Sorensen, Parkinson & Davis (2013) Riemer-S¿rensen S., Parkinson D. and Davis T. M., arXiv:1306.4153 [astro-ph.CO].
- Riess et al. (2011) Riess A. G. et al., Astrophys. J. 730, 119 (2011) [Erratum-ibid. 732, 129 (2011)] [arXiv:1103.2976 [astro-ph.CO]].
- Ross et al. (2013) Ross A. J. et al., arXiv:1310.1106 [astro-ph.CO].
- Rozo et al. (2012) Rozo E., Rykoff E. S., Bartlett J. G. and Evrard A. E., arXiv:1204.6301 [astro-ph.CO].
- Rozo et al. (2013) Rozo E., Rykoff E. S., Bartlett J. G. and Evrard A. E., arXiv:1302.5086 [astro-ph.CO].
- Saito, Takada & Taruya (2013) Saito S., Takada M. and Taruya A., Phys. Rev. Lett. 100, 191301 (2008) [arXiv:0801.0607 [astro-ph]].
- Saito, Takada & Taruya (2013) Saito S., Takada M. and Taruya A., Phys. Rev. D 80 (2009) 083528 [arXiv:0907.2922 [astro-ph.CO]].
- Saito, Takada & Taruya (2011) Saito S., Takada M. and Taruya A., Phys. Rev. D 83, 043529 (2011) [arXiv:1006.4845 [astro-ph.CO]].
- Samushia et al. (2013) Samushia L., et al., arXiv:1312.4899 [astro-ph.CO].
- Sanchez et al. (2012) Sanchez A. G. et al., Monthly Notices of the Royal Astronomical Society 425, 415 (2012) arXiv:1203.6616 [astro-ph.CO].
- Sanchez et al. (2013) Sanchez A. G., et al., arXiv:1312.4854 [astro-ph.CO].
- Seljak, Slosar & McDonald (2006) Seljak U., Slosar A. and McDonald P., JCAP 0610, 014 (2006) [astro-ph/0604335].
- Smee et al. (2013) Smee S. et al., Astron. J. 126, 32 (2013) arXiv:1208.2233 [astro-ph.IM].
- Smith et al. (2002) Smith J. A. et al. [SDSS Collaboration], Astron. J. 123, 2121 (2002) [astro-ph/0201143].
- Smith et al. (2003) Smith R. E. et al. [Virgo Consortium Collaboration], Mon. Not. Roy. Astron. Soc. 341, 1311 (2003) [astro-ph/0207664].
- Spergel, Flauger & Hlozek (2013) Spergel D., Flauger R. and Hlozek R., arXiv:1312.3313 [astro-ph.CO].
- Takada, Komatsu & Futamase (2004) Takada M., Komatsu E. and Futamase T., Phys. Rev. D 73 (2006) 083520 [arXiv:astro-ph/0512374].
- Taruya et al. (2012) Taruya A., Bernardeau F., Nishimichi T. and Codis S., Phys. Rev. D 86, 103528 (2012) [arXiv:1208.1191 [astro-ph.CO]].
- Tereno et al. (2009) Tereno I., Schimd C., Uzan J. -P., Kilbinger M., Vincent F. H. and Fu L., Astron. Astrophys. 500, 657 (2009) [arXiv:0810.0555 [astro-ph]].
- Thomas, Abdalla & Lahav (2010) Thomas S. A., Abdalla F. B. and Lahav O., Phys. Rev. Lett. 105, 031301 (2010) [arXiv:0911.5291 [astro-ph.CO]].
- Tojeiro et al. (2014) Tojeiro R. et al., arXiv:1401.1768 [astro-ph.CO].
- Verde, Protopapas & Jimenez (2013) Verde L., Protopapas P. and Jimenez R., Phys. Dark Univ. 2, 166 (2013) [arXiv:1306.6766 [astro-ph.CO]].
- Vessot et al. (1980) Vessot R. F. C. et al., Phys. Rev. Lett. 45, 2081 (1980).
- Viel, Haehnelt & Springel (2010) Viel M., Haehnelt M. G. and Springel V., JCAP 1006, 015 (2010) [arXiv:1003.2422 [astro-ph.CO]].
- Villaescusa-Navarro et al. (2013) Villaescusa-Navarro F. et al., arXiv:1311.0866 [astro-ph.CO].
- von der Linden et al. (2014) von der Linden A. et al., arXiv:1402.2670 [astro-ph.CO].
- Weinheimer et al. (1999) Weinheimer C., Degen B., Bleile A., Bonn J., Bornschein L., Kazachenko O., Kovalik A. and Otten E. W., Phys. Lett. B 460, 219 (1999).
- Wolf (2008) Wolf J. [KATRIN Collaboration], Nucl. Instrum. Meth. A 623, 442 (2010) [arXiv:0810.3281 [physics.ins-det]].
- Wong (2008) Wong Y. Y. Y., JCAP 0810, 035 (2008) [arXiv:0809.0693 [astro-ph]].
- Wyman et al. (2013) Wyman M., Rudd D. H., Vanderveld R. A. and Hu W., arXiv:1307.7715 [astro-ph.CO].
- Xia et al. (2012) Xia J. -Q. et al., JCAP 1206, 010 (2012) [arXiv:1203.5105 [astro-ph.CO]].
- Zhao et al. (2013) Zhao G. -B. et al., arXiv:1211.3741 [astro-ph.CO].
- Zheng et al. (2014) Zheng W., Li H., Xia J. -Q., Wan Y. -P., Li S. -Y. and Li M., arXiv:1403.2571 [astro-ph.CO].