Piezoelectric-based apparatus for strain tuning
Abstract
We report the design and construction of piezoelectric-based apparatus for applying continuously tuneable compressive and tensile strains to test samples. It can be used across a wide temperature range, including cryogenic temperatures. The achievable strain is large, so far up to 0.23% at cryogenic temperatures. The apparatus is compact and compatible with a wide variety of experimental probes. In addition, we present a method for mounting high-aspect-ratio samples in order to achieve high strain homogeneity. The final version of this article has open access and is available at: Review of Scientific Instruments vol. 85 article 065003.
Introduction
Response to uniaxial pressure can be a powerful probe of the electronic properties of materials. Uniaxial pressure directly drives anisotropic changes in the nearest-neighbor overlap integrals between atomic sites, and so will typically drive much larger changes to the electronic structure of materials than equal hydrostatic pressure. Furthermore, uniaxial pressure is directional, allowing the responses to different lattice distortions to be compared.
Uniaxial pressure is a well-established technique. To cite just a few results: The superconducting transition temperature of near-optimally-doped YBa2Cu3O7-δ increases if the orthorhombicity of the lattice is artificially reduced by uniaxial pressure. [1] of La1.64Eu0.2Sr0.16CuO4 nearly doubles with modest pressure along a crystal direction, but is less sensitive to pressures. [2] The iron pnictide superconductors Ba(Fe,Co)2As2 and BaFe2(As,P)2 are extraordinarily sensitive to , but not , pressures. [3]
The most common way to apply adjustable pressure to test samples is to clamp the sample between two anvils. Other methods have also been developed. Adjustable strains have been applied using bending devices, [4, 5] in which bending the substrate changes the sample strain. Another method is direct attachment of samples to piezoelectric stacks. [6]
In this article we report the design and construction of a piezoelectric-based strain apparatus in which the sample is separated from the piezoelectric stacks. The use of piezoelectric stacks gives rapid, precise, in situ tunability. The stacks can be made much longer than the sample, so that far larger strains can be achieved on the sample than on the stacks. Finally, the stacks are arranged in a way that cancels their thermal contraction, so that the sample can be both tensioned and compressed over a wide temperature range, including cryogenic temperatures.
Along with precise tunability, high strain homogeneity within the sample was also an important goal of the present development effort. Strain inhomogeneity has been among the most significant technical difficulties in uniaxial pressure experiments. Transitions observed under uniaxial pressure have generally broadened, sometimes severely, as the pressure was increased, an indication of increasing strain inhomogeneity. [7, 8, 9, 2] To obtain better strain homogeneity, and also to allow samples to be tensioned, we discuss the use of epoxy to mount samples with high length-to-width aspect ratios. We find that high uniaxial pressures, at least 0.4 GPa, can be transmitted through the epoxy.
In the appendices we discuss in some detail elastic deformation of the mounting epoxy, with the aim of providing a practical guide.
We believe that response to lattice strain is an under-utilised technique. The apparatus and mounting methods we have developed are compact and reliable, and will allow new experiments across a wide range of materials.
Current methods
We start with a brief discussion of stress and strain. To apply controlled uniaxial stresses to a sample, one usually compresses a spring, or pressurizes a gas resevoir, which pushes on an anvil that compresses the sample. In both cases, if the apparatus spring constant is much lower than that of the sample, the controlled parameter is stress. Conversely, if the apparatus spring constant is much higher than that of the sample, the controlled parameter is strain: the apparatus applies a displacement to the sample, and the sample deforms in response to this displacement, ideally independently of its own Young’s modulus.
In the linear regime, where stress and strain are linked by a proportionality constant, the distinction between controlled-stress and controlled-strain apparatus may seem semantic. But there are practical consequences, the most important of which may be in thermal contraction: in well-designed controlled-stress apparatus, the spring takes up differential thermal contractions, keeping the force on the sample essentially constant, but in controlled-strain apparatus one must carefully consider the effects of differential thermal contraction. Also, if the sample undergoes a structural transition between the mounting and measurement temperatures, the results from controlled-stress and controlled-strain apparatus will be qualitatively different.
In a controlled-stress apparatus with anvils to compress the sample, if the sample and anvil faces are in direct contact then both must be polished flat. In typical uniaxial pressure measurements, the sample strain is 0.1%, corresponding to 1 m of compression over a 1-mm-long sample. Achieving high strain homogeneity would then require the sample and anvil faces to be smooth, flat, and parallel on a scale well below this 1 m. However scientific samples are frequently small, of irregular shape and have non-ideal mechanical properties for fine polishing; the difficulty in obtaining narrow transitions under uniaxial pressure suggests that adequate sample polishing is not a trivial task. And even if the sample and anvil faces match perfectly, frictional locking can introduce strain inhomogeneity: the end faces of the sample are locked to the anvils, while the center attempts to expand following its own Poisson’s ratio. [10]
Strain homogeneity can be improved by using samples with higher aspect ratios (length over width): the effects of irregularities (that do not generate bending moments) at the sample-anvil interface decay towards the sample center, and the sample’s Poisson’s ratio dominates its transverse strain. In Ref. 11, an aspect ratio of 2:1 — high for uniaxial pressure experiments on correlated-electron materials — was used to improve the strain homogeneity. Also, gold and cadmium films were inserted at the sample-anvil interface, to reduce frictional locking and smooth out defects.
In most uniaxial pressure apparatus the pressure is set at room temperature, by turning a bolt. In situ adjustability has been achieved in low-temperature apparatus by using helium-filled bellows to apply the force. [1, 12, 9]
Direct attachment of samples to piezoelectric stacks offers in situ adjustability, in a much simpler and more compact apparatus. This technique was introduced in Ref. 6 for strain tuning of semiconductors, and extended to correlated electron materials in Ref. 13. However there are two significant limitations of the sample-on-stack technique: limited range, and large differential thermal contraction. In our apparatus we used lead zirconium titanate (PZT) stacks, [14] the most common composition, and the catalog indicates that at room temperature, within the manufacturer’s recommended voltage limits of and V, the total range of strain on the stacks is 0.15%. This is small: when we tested our apparatus with a sample of Sr2RuO4, we found that the samples snapped under 0.25% tension, and could withstand at least the same amount of compression, meaning that the sample itself permitted a strain range of at least 0.5%. Microscopic VO2 rods have been found to withstand up to 2.5% strain, [4] and, for an extreme case, it is calculated that defect-free silicon nitride could withstand tensile strains of up to 25%. [15]
Furthermore, the response of the piezoelectric stacks falls as the temperature is reduced. At 1 K, we found the response per volt of our stacks (measured using a strain gauge) to be that at room temperature. [16, 17] This reduced response can be partially offset by the larger voltages that can be applied at cryogenic temperatures: a 0.04% strain range (-0.02% to +0.02%) was obtained with voltages between and V (on a different piezoelectric stack model from the same manufacturer), [6] while we achieved a 0.05% range over to V. This is still at least an order of magnitude less than the strain range that typical samples can withstand.
Large differential thermal contraction is a challenge because PZT lengthens along its poling direction as it is cooled, by 0.1% between room temperature and 4 K. [18, 19, 20] Very few materials contract by less than 0.1% over this range; 0.2–0.3% is more typical. Therefore (and in the absence of any plastic deformation of the mounting epoxy [21]) differential thermal contraction will strain typical samples by an amount well beyond the range of the stacks, making it impossible to tune the strain through zero. Overall, the sample-on-stack technique is best suited for measuring the linear response to small strain perturbations, [22] in circumstances where a significant nonlinear contribution is not expected.
The uniaxial strain apparatus
A schematic overview of our apparatus is shown in Fig. 1. The sample is firmly affixed with epoxy across a gap between two plates, one movable and the other fixed. The position of the movable plate is actuated by three piezoelectric stacks, which are joined by a bridge. A positive voltage applied to the central stack extends the stack and compresses the sample, while a positive voltage on the outer two stacks pushes the bridge outwards and tensions the sample. All the stacks have equal lengths, so in principle their thermal expansion does not strain the sample.

Because the stacks are much longer than the sample, large sample strains are achievable. The sample strain is , where is the length of the stacks, is the strained length of the sample, and and are the strains on the outer and central stacks. (The “strained length” of the sample is the length over which strain is applied: as will be described, the sample is mounted with epoxy in a way that strain is not applied to the end portions of the sample.) In our first apparatus, was 4 mm, and typically around 1 mm; we achieved sample strains below 4 K of up to 0.23%. [23]
Our terminology requires some discussion. The apparatus is accurately described as a uniaxial strain apparatus, but the applied strain is not strictly uniaxial, and the control over strain is not perfectly rigid. The sample will have nonzero Poisson’s ratios, so strain applied along its length will induce strains along its width and thickness. However the stress within the sample is strictly uniaxial, and the apparatus offers independent control of the strain along only a single axis, so its description as uniaxial is appropriate. The control over the strain is not perfectly rigid because, although the apparatus itself is several times stiffer than typical samples, [24] the epoxy used to mount the sample deforms, taking up some of the applied displacement. For the samples this apparatus was designed to accept, high-Young’s-modulus crystals with cross-sectional areas 0.01 mm2, the epoxy spring constant remains higher than the sample spring constant (as detailed in the appendices), but not so high that epoxy deformation can be ignored in determining the sample strain. The description of this as a controlled-strain apparatus is appropriate because samples could in principle be mounted more rigidly, and it is important to retain a clear distinction with controlled-stress apparatus, in which there must be a well-defined spring of some form with a low spring constant.
Fig. 2 shows the complete apparatus; we now describe some of the details.
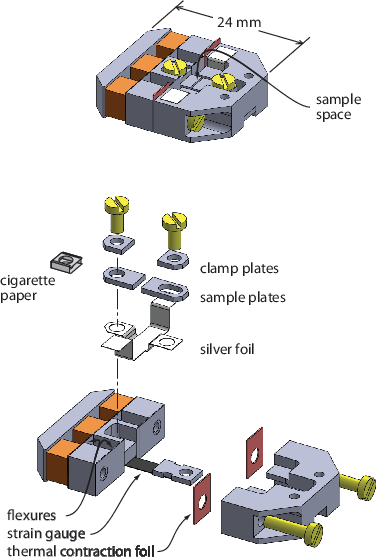
The flexures present a low spring constant for longitudinal motion, and a much higher spring constant for twisting or transverse motions. They are intended to protect the stacks from inadvertent transverse forces, for example during the sample mounting process, and to reduce unwanted bending from loads not centered on the stacks.
Our first device was constructed out of titanium, chosen because its thermal contraction is similar to the transverse thermal contraction of the stacks. [18, 19] This thermal contraction is lower than most materials, however, so differential thermal contraction would place most samples under tension. Copper foils (the “thermal contraction foils” in the figure) were incorporated to increase the device’s thermal contraction. The screws holding the apparatus together are brass, which contracts more than titanium, and so secure the apparatus more tightly as it cools.
A strain gauge [16] was incorporated to measure the displacement applied to the sample, from which the sample strain could be calculated. The piezoelectric stacks in our first apparatus are hysteretic, particularly at large voltages, so a position sensor is necessary. The gauge is mounted across a 6-mm-wide gap beneath the sample; the samples are far too small for a gauge to be affixed directly to them. To stiffen the gauge and reduce deformation during handling, it was first epoxied to a piece of cigarette paper. The gauge and cigarette paper combination was then mounted under tension, so that it would remain flat even if the sample was strongly compressed.
The strain gauge was not a perfect sensor in that its resistance had a small temperature dependence (over our initial measurement range of 0.5–3 K), and shifted slightly but noticably between cool-downs. However these effects could be treated during data analysis, and the gauge provided a non-hysteretic measure of the sample strain within each cool-down.
The silver foil is intended to reduce the thermal time constant between the sample and a temperature sensor mounted on a free tab of the foil. Cigarette paper can be used to electrically isolate one or both of the sample plates, if desired.

The stacks can be operated together to achieve smooth strain ramps. For example, to sweep the strain from strong compression to strong tension, the voltages on the (compression, tension) stacks might be ramped from (300, 0) to (150, 150) to (0, 300) V, thus avoiding discontinuity in operation across zero strain.
The size limit of samples that this apparatus can accept is currently unclear. Force applied to the sample places at least one of the stacks under tension, but piezoelectric stacks are sintered powders, not meant to withstand high tensile stress. In our first experiment, the applied force never exceeded 5 N. The stacks can likely withstand considerably larger tensile forces than that.
In Fig. 3, we show data collected with this apparatus: the superconducting transition temperature against strain (applied along a crystal direction) for two single crystals of the unconventional superconductor Sr2RuO4. The sample cross-sections were 11030 and 17060 m. The Young’s modulus of Sr2RuO4 is 182 GPa, [25] so at the highest strains the stress in the sample was about 0.4 GPa. of Sr2RuO4 increases strongly both when it is tensioned and compressed. The data in the figure illustrate the capabilities of the apparatus: the rapid and precise tunability allowed a high density of data points, and the curves are smooth. The scientific results of this experiment are discussed in Ref. 23.
Sample mounting
The apparatus was designed to accept, initially, samples with cross sections of 20050 m. The samples needed to be epoxied into place, both so that they could be tensioned, and to reliably transmit the micron-scale displacements generated by the piezoelectric stacks. But mounting with epoxy gives other advantages. One is that the epoxy conforms to the sample, so precision polishing of the sample faces is not necessary. The samples do need to be cut to have an approximately constant cross-section, but the demands on precision here are not severe. Another advantage is that the sample ends cannot pivot, which allows higher length-to-width aspect ratios before the sample buckles under compression. Finally, if the epoxy has relatively low elastic moduli, it forms a deformable interface layer that reduces stress concentration in the sample, reducing the risk of sample fracture.
We used Stycast® 2850FT. Early samples were mounted as shown in Fig. 4(a), with droplets of epoxy securing the ends, and no further construction. While simple, the disadvantage of this method is its asymmetry: the sample is secured more firmly through its lower than its upper surface. A calculation presented in Appendix A shows that it is the leading 0.1 mm of the epoxy, shaded red in panel (e) of the figure, that transfers most of the applied force between the sample plate and sample. Due to the asymmetry, when the sample is strained it also bends, downward when tensioned and upward when compressed. The bending introduces a strain gradient in the sample, which, as shown in Fig. 8, in Appendix B, can be substantial.

Later samples were therefore mounted as shown in Fig. 4(b): with a rigid cap foil over the sample, so that the sample is secured through both its lower and upper surfaces. In Fig. 3, sample #1 was mounted in this way, and sample #2 as in panel (a). The superconducting transition of sample #2 broadened considerably more under strain than that of sample #1, indicating greater strain inhomogeneity.
As noted in the introduction, the epoxy mounts were sufficient to transmit sample pressures of at least 0.4 GPa. We also tested the epoxy at room temperature, by tensioning samples mounted as in panel (a) until fracture. We tested two samples with Epotek® H20E epoxy and one with Stycast 2850FT. The samples were 70–120 m wide and 30–100 m thick. In all three cases, the samples snapped at tensions of 0.25%. Fracture occured towards the middle of the sample: it was the sample, not the epoxy, that failed. For larger samples with a lower surface-area-to-volume ratio, the stress in the epoxy will be higher and eventually the strength of the epoxy will become the limiting factor, but it is clear that there is a practical range of parameters where high sample pressures can be achieved.
We worked with samples with length-to-width aspect ratios between 3.5 and 7. ( here and in the appendices refers to the exposed length of the sample, ignoring the end portions that are embedded in epoxy.) In retrospect, seven was more than necessary. As discussed in Appendix B, if the epoxy has low elastic moduli and the epoxy layers are sufficiently thick (at least the sample thickness), the strain within most of the exposed portion of the sample is highly homogeneous, with significant inhomogeneity (apart from any bending-induced gradients) only very near to the sample mounts (Appendix B, Table I).
There are also advantages in working with samples that are thin plates, with ( the sample thickness) significantly greater than one. (For Sr2RuO4, a layered compound, this was a natural geometry.) The surface-area-to-volume ratio is increased, reducing stress within the epoxy, and bending-induced strain variation is reduced. If both and are significantly greater than one, however, can become quite large; the highest in our Sr2RuO4 experiment was 25. The Euler formula for the buckling load on a thin beam with both ends unable to pivot is
where is the Young’s modulus and is the area moment of inertia. [26] for a thin rectangular plate is , and the longitudinal strain is . Substituting, the critical aspect ratio , above which the plate buckles, is
For %, the sample is expected to buckle for .
Conclusion
We have presented a design for compact, piezoelectric-based apparatus that can apply large strains to test samples, even at cryogenic temperatures. The apparatus can apply both compressive and tensile strains, a useful technological advance. We have also discussed and analysed a method for obtaining high strain homogeneity within the sample, whether using this or another distortion apparatus.
We anticipate that apparatus and methods similar to those presented here will be widely applicable. Strain-tuning is conceptually a very simple technique, and we believe that much can be learned across many systems from basic measurements such as resistivity and magnetic susceptibility as a function of strain. This apparatus also leaves the upper surface of the sample exposed, allowing access for spectroscopic and scattering probes. In summary, we hope that the methods that we have presented will make strain-tuning a more practical, widespread and precise technique.
Acknowledgements.
The authors thank Jan Bruin, Ian Fisher, Andrew Huxley and Edward Yelland for valuable discussions. They thank the UK Engineering and Physical Sciences Research Council and the Max Planck Society for financial support.References
- [1] U. Welp, M. Grimsditch, S. Fleshler, W. Nessler, J. Downey and G.W. Crabtree, Phys. Rev. Lett. 69, 2130 (1992).
- [2] N. Takeshita, T. Sasagawa, T. Sugioka, Y. Tokura and H. Takagi, J. Phys. Soc. Japan 73, 1123 (2004).
- [3] H.-H. Kuo, J.G. Analytis, J.-H. Chu, R.M. Fernandes, J. Schmalian and I.R. Fisher, Phys. Rev. B 86, 134507 (2012).
- [4] J. Cao, E. Ertekin, V. Srinivasan, W. Fan, S. Huang, H. Zheng, J.W.L. Yim, D.R. Khanal, D.F. Ogletree, J.C. Grossman, and J. Wu, Nature Nanotechnology 4, 732 (2009).
- [5] J.H. Park, J.M. Coy, T.S. Kasirga, C.-M. Huang, Z.-Y. Fei, S. Hunter, and D.H. Cobden, Nature 500, 431 (2013).
- [6] M. Shayegan, K. Karrai, Y. P. Shkolnikov, K. Vakili, E. P. De Poortere and S. Manus, Appl. Phys. Lett. 83, 5235 (2003).
- [7] M.S. Torikachvili, S.L. Bud’ko, N. Ni, P.C. Canfield and S.T. Hannahs, Phys. Rev. B 80, 014521 (2009).
- [8] S.D. Johnson, R.J. Zieve and J.C. Cooley, Phys. Rev. B 83, 144510 (2011).
- [9] O.M. Dix, A.G. Swartz, R.J. Zieve, J. Cooley, T. R. Sayles and M. B. Maple, Phys. Rev. Lett. 102, 197001 (2009).
- [10] X.X. Wei and K.T. Chau, Int. J. Solids and Struct. 46, 1953 (2009).
- [11] F. Bourdarot, N. Martin, S. Raymond, L.-P. Regnault, D. Aoki, V. Taufour and J. Flouquet, Phys. Rev. B 84, 184430 (2011).
- [12] C. Pfleiderer, E. Bedin and B. Salce, Rev. Sci. Instrum. 68, 3120 (1997).
- [13] J.-H. Chu, H.-H. Kuo, J.G. Analytis and I.R. Fisher, Science 337, 710 (2012).
- [14] Pch 150//2, Piezomechanik GmbH.
- [15] S. Ogata, N. Hirosaki, C. Kocer and H. Kitagawa, Phys. Rev. B 64, 172102 (2001).
- [16] Vishay Micro-Measurements EK-06-250PD-10C/DP. We took the gauge constant, the rate of change of gauge resistance against variation in the gauge’s length, to be temperature-independent. Vishay Micro-Measurements Tech Note TN-504-1 (“Strain gauge thermal output and gauge factor variation with temperature”) indicates that the gauge constant for the Karma Alloy used in our gauges increases, with a linear temperature dependence, by 1.0% from 24∘C to -73∘C. Extrapolating to 0 K, the gauge constant would be 3% larger than at room temperature.
- [17] The response rates of the stacks were determined below 80 (200) V at room temperature (4 K), where the response was nearly linear with applied voltage.
- [18] A.M. Simpson, and W. Wolfs, Rev. Sci. Inst. 58, 2193 (1987).
- [19] Physik Instrumente GmbH, “Piezo Material Data.”
- [20] The Physik Instrument piezo materials datasheet indicates a coefficient of thermal expansion for various PZT formulations of to /K, along the poling direction. The thermal contraction of most materials is much diminished below 77 K, so multiplying this coefficient by a 200 K temperature range yields an expansion of 0.08 to 0.12% from room to cryogenic temperatures.
- [21] Both Refs. 6 and 13 report that much less strain is transmitted from the stack to the sample at higher temperatures, 300 K for the former and above 100 K for the latter, than at low temperatures, suggesting significant plastic deformation of the epoxy at higher temperatures. This may hinder measurements at higher temperatures, but could have the benefit of relieving thermal strains.
- [22] H.-H. Kuo, M.C. Shapiro, S.C. Riggs and I.R. Fisher, Phys. Rev. B 88, 085113 (2013).
- [23] C.W. Hicks, D.O. Brodsky, E.A. Yelland, A.S. Gibbs, J.A.N. Bruin, K. Nishimura, S. Yonezawa, Y. Maeno and A.P. Mackenzie, Science 344, 283 (2014).
- [24] With a Young’s modulus of 200 GPa, the spring constant for straining the sample lengthwise will be N/m, taking mm2 and mm. The least stiff part of the apparatus is the bridge, which can be viewed approximately as two S-bending cantilevers 6 mm wide, 2.5 mm thick and 9 mm long, yielding a spring constant of N/m.
- [25] J.P. Paglione, C. Lupien, W.A. MacFarlane, J.M. Perz, L. Taillefer, Z.Q. Mao and Y. Maeno, Phys. Rev. B 65 220506 (2002).
- [26] M. Euler, Memoires de l’academie des sciences de Berlin 13, 252 (1759).
- [27] The Young’s modulus for loads along is . It applies if the sample is free to expand and contract, following the Poisson’s ratios, along and . If the sample is a thin plate it can probably contract along , but not along . In this case, the elastic constant should be used instead of . For realistic materials, this is not very different from .
- [28] C.E. Ojeda, E.J. Oakes, J.R. Hill, D. Aldi and G.A. Forsberg, “Temperature effects on adhesive bond strengths and modulus for commonly used spacecraft structural adhesives,” Jet Propulsion Laboratory (Pasadena, CA, U.S.A.) technical report.
- [29] T. Hashimoto and A. Ikushima, Rev. Sci. Inst. 51, 378 (1980).
- [30] Emerson and Cumings Stycast® 2850FT data sheet.
Appendix A Analytic analysis of the sample mounts.
In Appendix A, we estimate analytically the load transfer length , the length over which the applied force is transferred between the sample plates and sample. The displacement applied by the piezoelectric stacks, and measured by the strain gauge, will be distributed over a length , so knowledge of is needed to estimate the sample strain. We also discuss the stress within the epoxy. The parameters for our model are illustrated in Fig. 5. We make the following simplifications: (1) The sample width is sufficiently larger than its thickness that bonding on the sides of the sample is not important. (2) The sample plate and cap foil are perfectly rigid. (3) Shears within the sample are neglected: the strain within the sample, , is constant in both and . These latter two assumptions amount to supposing that the epoxy has much lower elastic constants than the sample, sample plate, and cap foil.

Within this model, the force within the sample at position is , where is the Young’s modulus of the sample. [27] varies with following:
where is the shear stress across the interface between the sample and epoxy, the shear elastic constant of the epoxy, the epoxy thickness, and the displacement of the sample at position from its unloaded position. =1 if the sample is bonded on its lower side only, and 2 if on both the top and bottom. and are related by , so a differential equation for can be readily obtained and solved. Its solution is decaying exponentially over a length scale
The elastic properties of Stycast 2850FT appear not to have been measured precisely at cryogenic temperatures. In a technical study for spacecraft applications, its Young’s modulus was found to increase gradually as the temperature was reduced, but appeared to level off below 160 K. [28] At 150 K, it was determined to be GPa when Catalyst 24LV was used, and 16 GPa when Catalyst 9 was used. (We used Catalyst 23 LV.) The Young’s modulus of Stycast 1266, an unfilled version of 2850FT, has been measured at 197 K, 77 K, and a few temperatures between 77 and 2.2 K; [29] it was found to be 4.5 GPa for temperatures 77 K and below. If of Stycast 2850FT behaves similarly, it may rise slightly from its 150 K value as the temperature is reduced further, before leveling off.
The shear modulus of an isotropic material is , where is Poisson’s ratio. We take GPa and , yielding GPa for the Stycast.
Sr2RuO4 is a relatively stiff material, with GPa. [25] Taking typical values m, m and yields m: it is the leading 0.1 mm of epoxy that transfers the applied displacement to the sample.
The shear strain within the epoxy, , will be maximal at the edge of the sample plate, , where it is:
| (1) |
where is the sample strain beyond the end of the epoxy. For the above parameters, comes to 1.3% for %.
The data sheet for Stycast 2850FT indicates a tensile strength of 50 MPa (at room temperature). [30] With %, the shear stress in our sample mounts, using the above parameters, is MPa at . We may therefore have been close to the yield strength of the epoxy. The measurements on Stycast 1266 however indicate a fracture strain of 4% at low temperatures, [29] and if Stycast 2850FT performs similarly then our mounts had a comfortable margin of safety. Our measurements showed almost no hysteresis against strain, and no abrupt changes in behavior at high strains, indicating that the epoxy did not fracture or de-bond.
If failure of the epoxy becomes a significant limitation in future measurements, Eq. A1 indicates the steps to
take: The sample should be bonded from both sides (so that ). The sample should be made thin, and the
epoxy layer somewhat thick. The shear stress at the interface is , so a
good choice of epoxy appears to be one with low elastic constants, high bonding strength and high yield
strain.
Appendix B Finite-element analysis
Here we present the results of finite element simulation of a few representative cases. We discuss the load transfer length , strain homogeneity and sample bending.
We study four models for the sample mounts, illustrated in Fig. 6. They are: (1) “Rigid:” the sample is secured perfectly rigidly on its top and bottom surfaces. (2) “Symmetric epoxy:” the sample is bonded on both its top and bottom faces through thin layers of low-elastic-modulus epoxy to perfectly rigid surfaces (the sample plate and cap foil). (3) “Asymmetric epoxy:” only the lower surface is bonded, again with relatively soft epoxy. (4) “Symmetric thick epoxy:” same as #2, but with thicker epoxy layers. Models #2 and 3 are close to our actual conditions, in which the samples were 50 m thick, and the epoxy 10–20 m thick. Models #1 and 4 are included for comparison.

There are a few parameters to specify. For the sake of generality, we take both the epoxy and sample to be isotropic, with a Poisson’s ratio of 0.3. Young’s modulus for the epoxy is set to that of the sample. The thickness of the epoxy layers is set to for the thin layers and for the thick layers. is set to , and to .
The calculations were done using a rectilinear mesh, with 15 or 16 elements spanning each of the sample thickness, sample width and epoxy thickness. The portions of the sample embedded in the epoxy were in all cases made much longer than the load transfer length . Differential thermal contractions are neglected.

Fig. 7 shows some results for the strain . In all cases, the movable sample plate was moved inward by 0.1% of , but because , the actual sample strain in the gap is somewhat less than 0.1%. In panel (c), we report for each calculation, determined such that to achieve an applied strain in the gap, the movable sample plate should be moved a distance .
depends on parameters such as the epoxy thickness that, in practice, can be difficult to control accurately, particularly for small samples. One disadvantage in mounting samples with low-elastic-modulus epoxy is that greater absolute uncertainty in means greater uncertainty in the sample strain. However, the results also show that stress concentration within the sample is reduced.
We next discuss strain homogeneity. Provided the sample does not bend (that is, the mounts are symmetric), strain inhomogeneity will decay exponentially towards the sample center; measurements should be configured to be sensitive mainly to the sample center. A guide on how much of the ends of the sample (in addition to the portions embedded in the epoxy) to exclude is given in Table I. The criterion is that at some location in the sample cross-section, the strain differs from at the sample centre (at ) by more than a given percentage. For example, using mount model #2, to obtain less than 5% strain inhomogeneity over the entire measured region only the outermost portions of length need to be excluded from measurement. In other words, by using suitable sample mounts high strain homogeneity can be obtained within almost the entire exposed portion of the sample.
| % inhomogeneity | Mount model #1 | #2 | #4 |
|---|---|---|---|
| 5% | |||
| 1% |
If the sample does bend, a strain gradient is introduced into the sample. Let be the difference between the strains at the upper and lower surfaces of the sample, and be the average strain through the thickness of the crystal. Ideally the ratio should be as small as possible. But it may also be desirable to bond the sample only by its lower surface, for unfettered access to its upper surface, and even if symmetric sample mounts are constructed imperfection in assembly will lead to residual asymmetry. So it is useful to know how large might be. In Fig. 8, we show calculations of against sample thickness for samples bonded from below only. Unsurprisingly, is larger for thicker samples. However the magnitude is noteworthy: , for example, is a large aspect ratio not far below the buckling limit, but could still be up to 10%. Although slightly more difficult to implement, symmetric mounting as illustrated in panel (d) of Fig. 4 offers a clear advantage.
