On the evolution and utility of annual citation indices
Abstract
We study the statistics of citations made to the top ranked indexed journals for Science and Social Science databases in the Journal Citation Reports using different measures. Total annual citation and impact factor, as well as a third measure called the annual citation rate are used to make the detailed analysis. We observe that the distribution of the annual citation rate has an universal feature - it shows a maximum at the rate scaled by half the average, irrespective of how the journals are ranked, and even across Science and Social Science journals, and fits well to log-Gumbel distribution. Correlations between different quantities are studied and a comparative analysis of the three measures is presented. The newly introduced annual citation rate factor helps in understanding the effect of scaling the number of citation by the total number of publications. The effect of the impact factor on authors contributing to the journals as well as on editorial policies is also discussed.
I Introduction
The popularity of an academic journal may be related to its readership, while the quality is usually evaluated by several factors related to the citations it receives. Among them, the total citations in a year, the impact factor [1, 2], the eigenfactors [3] are popular measures. The impact factor (IF) [1, 2] of an academic journal is a measure which reflects the average number of citations to recent articles published in the same journal. It is frequently used as a proxy for the relative importance of a journal within its field, with journals with higher IFs deemed to be more important compared to those with lower ones. The eigenfactor measure in addition takes into account the quality of the journals in which the citing articles appear, arguing that a journal is considered to be more influential if it is cited often by other influential journals. It was shown [4] however that the eigenfactor measurement is more or less correlated with the annual citation measure.
There have been plenty of empirical studies on citation data [5], specifically on citation distributions [6, 7, 8, 9] of articles, probability of citation as a function of time [10, 11, 12, 13], citations of individuals authors [14] and their dynamics [15]. It has been recently shown that the -index [16] is weakly correlated with number of publications of a scientist, but is strongly correlated with the number of citations that one has received, suggesting that the number of citations can be effectively used as a proxy of the -index [17].
Apart from studying the properties/statistics of the standard measures of annual citation and impact factor, we also introduce and analyse a new measure called the citation rate. Even when one considers a truncated dataset (as is the case here) this measure exhibits more characteristic features compared to the other two with respect to certain properties. The motivation for the present work is to study mainly the statistical properties of annual citation, its rate and impact factors – several distributions and correlations are investigated for all these quantities.
II Quantities of interest
Impact factors are calculated yearly for journals that are indexed in the Journal Citation Reports [18]. The precise definition of IF is the following: if papers published in a journal in years and are cited times by indexed journals in the year , and be the number of citable articles published in those years, then the impact factor in year is given by
| (1) |
One can also measure , the number of annual citations (AC) to a journal in a given year. This is given by
| (2) |
where is the citations received in the year by the th paper published in the year .
We introduce another measure, , the annual citation rate (CR) at a particular year that is defined as the number of citations received in a year (annual citations) divided by the number of articles published in the same year. Formally,
| (3) |
This quantity is local in the sense it is for the same year, and can also be interpreted as non-local as well, because the citations are received for all articles published in the journal in time history (for ).
III Data
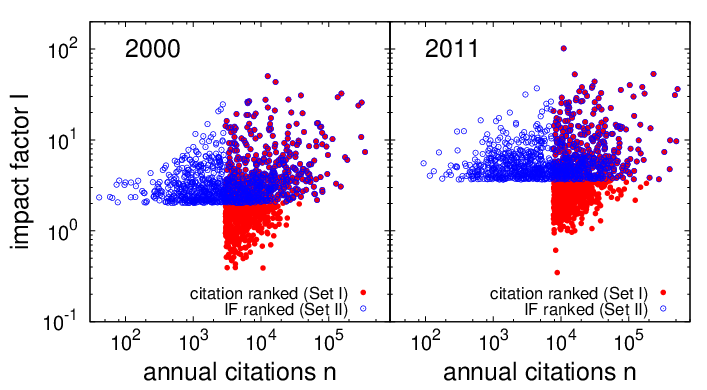
We collected data for the top journals, ranked according to (i) the number of citations received by the journal in a year (Set I) and (ii) IF in that year (Set II), for each of several years for the Science (SCI) and Social Science (SOCSCI) databases indexed in the Journal Citation Reports (JCR) [18]. We analyzed years () of data for the Science and years () of data for the Social Science journals. All these data sets contained at least the information about the following quantities: (i) the number of citations received by the journal in a year, (ii) IF , (iii) the number of articles published in the journal in the same year and a few other quantities. Fig. 1 shows the journals with their citations and impact factors, for the two datasets, ordered in different manner.
IV Results
IV.1 Rank plots


To begin with, we looked at the ranked plot for both Set I and II. Fig. 2 shows the values of (i) AC and (ii) IF against their rank, ranked according to the values of the same quantities. On the whole, a journal at a rank is observed to increase its AC and IF over years. However, intense competition among top ranked journals is apparent from the occasional crossing of the curves for different years for the highest ranks (). For ranks , the behavior is rather regular, in the sense that these curves never or rarely cross. Extensive studies on the historical behavior of the IF ranked distribution [19, 20] have established this behavior. These historical studies concentrate on the behavior of the low ranked (large ) journals and the precise nature of the distribution function. However, we will concentrate on a limited sample of the top ranked () journals in Set I and II. To check if the overall functional form of the distribution remains invariant with time, we rescaled the quantities by their averages, and the curves appear to collapse into some universal function irrespective of the year. It may be noted that for small ranks, the citation is almost independent of rank implying a cluster of journals with comparable citations that occupy the top positions (Fig. 2A, B). Hence the curves are fitted for by and we find that . Similarly, for the IF, the scaled data is seen to fit to the same form with an exponent (Fig. 2C, D). These exponents are called the Zipf exponents as they are obtained from the rank plots. For SOCSCI, we find that approximate power law fits are possible for the rank plots, the Zipf exponents being and (Fig. 2F, H).
IV.2 Correlation
The linear correlation coefficient is a measure of the strength of linear relation between two quantitative variables, say and . We use to represent the sample correlation coefficient:
| (4) |
Where is the number of individuals in the sample. We analyzed the data using and instead of and to include the general case of having power-law dependence on .


Overlap and rank correlation of the sets:
We try to quantify how close the two data sets Set I and Set II are. It is intuitively obvious that highly cited journals have higher IF and there should be a reasonable overlap. Fig. 1, which shows the AC vs IF ‘phase space’ - how Set I (ranked according to ) and Set II (ranked according to ) sample different sets of a huge database - shows also the overlap of the two sets. It is interesting to find out how the ranks according to AC and IF are correlated. To calculate the correlation between AC and IF ranks of a journal, we plot the ranks of the common journals for two different years in Fig. 3. It is apparent that the ranks are quite uncorrelated (supported by low values). Both the overlap and rank correlation studies show that studying both Sets I and II are important, as, first of all there are a lot of journals occurring only in one set, and secondly, even when they occur in both sets, their positions (i.e. ranks) in the two datasets are quite different.
Dynamic rank correlations:
Next we identify the journals and look at the scatter plots of AC (and IF) ranks in two consecutive years to find out dynamic correlations, if any. We obtain the list of journals which occur in Set I of both the years for the AC ranks and in Set II for IF ranks. The number of such journals is larger when one considers AC ranks indicating that the position within the first 1000 journals is more stable when AC is considered. This is not surprising as citation data involves citation to all previously published papers while IF is concerned with only recent papers. As an example, if one considers the years 2005 and 2006, the number of common journals which occur in Set I is while for Set II it is . There is clear indication that for AC, the rank correlations are much stronger (Fig. 4(A)) compared to IF rank correlations (Fig. 4(B)). Linear regression gives the values of correlation coefficients expectedly higher in case of citations.
Dynamic correlation of actual values:
Correlation coefficients for the actual values of IF and AC of the journals common in the sets for two different years were also calculated and they show identical trends. In fact the correlation coefficients are very close when calculated in terms of actual values (Fig. 4(C) and (D)) and ranks. This indicates that small changes in the values will induce small changes in ranks. The regression analysis for all possible pairs of years was done and discussed later in this paper.
Correlation between different measures:
The annual citation rate (CR) has been plotted against both AC and IF ranks using the data in Set I and Set II. It is interesting to note that citation rates are less sensitive to citation ranks compared to IF ranks, for which it shows a sharper decreasing trend (Fig. 5). We have plotted data from different years to distinguish fluctuations across years from trends across sets.


Correlation of values of with and are shown in Fig. 6, The correlations can be calculated from both set I and set II. The plot of with and made using the data in set I and set II respectively are shown in Fig. 6(A) and (B). A lower cutoff exists in these plots (as also for the data shown in Fig. 5) and therefore one should not calculate the correlation coefficients for these data. Correlations coefficients can be calculated when one plots against taken from set II or against taken from set I (Fig. 6(C) and (D)). Both plots clearly show that CR and AC are much less correlated as was indicated from the rank plot (Fig. 5) and the values of the correlation coefficients obtained from the ‘indirect’ plots confirm this.
That AC and CR do not show considerable correlation indicates that the fluctuations in the number of publications in different journal is considerable. IF and are both scaled by the number of publications and therefore they show more correlation.
IV.3 Distribution of annual citations, IF and annual citation rate: nature of their tails
First we investigate the nature of the tail of the distribution of annual citations (Fig. 7(A)) and impact factors (Fig. 7(C)) from Set I and II. The citation and impact distributions do not represent the entire dataset as only the highest ranked journals are considered. Therefore only the tail of the distribution can be obtained here. The distribution of annual citations and impact factors showed monotonic decays, the tail of which can be fitted to power law forms. There is a lower cutoff in the annual citation and impact factor and no local peak is expected. The plots showed excellent scaling collapse over years when in general for any probability distribution , is plotted against . For annual citations, the distribution at lower values hint towards a lognormal but we concentrate on the behavior of the ‘tail’ of the distribution, which is a power law [21]. The power law exponents (also called the Pareto exponents) and are and respectively. The Zipf exponent obtained from a rank plot is related to the Pareto exponent obtained from the probability distribution by [22]. Using the values of reported in IV.1, the values of are and respectively for AC and IF, which compare quite well to the values obtained directly from the plots of the distributions (Fig. 7). The same is true for the SOCSCI data (expected Pareto exponents are and from the Zipf plots while best fit values are and ), where, however, it is apparent that there may be some corrections to power law scaling.


The probability distributions of the newly proposed quantity, the annual citation rate (Fig 8A-D) computed from Set I and Set II share similar characteristics, although they differ by the absolute values of their fluctuations. Distributions of annual citation rates are non-monotonic, compared to and , they have a peak but eventually decay at large (approximately as ). The distribution is also consistently narrow with respect to that of and . The curves for successive years also showed excellent scaling collapse, when scaled with the averages. The non-monotonic behavior for both sets is characterized by a prominent peak at . The appearance of a most probable value indicates that most of the journals are likely have a similar value of annual citation rate which is approximately half the sum of the annual citation rates of all journals. The corresponding plots for SOCSCI are shown in Fig 8E-F, and these sets are consistent with the above behavior.


The tail of the distribution seems to fit to a power law, but in order to account for the maximum part of the data, including the non-monotonicity and the peak, we proposed a fitting using a log-Gumbel function. We performed the Kolmogorov-Smirnov test to evaluate the quality of the fit: we have sorted the data points into increasing order for the year 2000. We compare the empirical pattern and theoretical estimated value. The largest error is for sample size (SET I). For level of significance , the critical value of daviation is for this sample size. The largest error is for sample size (SET II) and the critical value is . For the SOCSCI set: The largest error is for sample size (Set I). For level of significance , the critical value of deviation is for this sample size. The largest error is for sample size (Set II) and For level of significance the critical value is . Since our estimated daviation is less than the critical value, we use the log-Gumbel distribution for fittings.
We had seen earlier that CR is much less correlated with the AC compared to the IF, but as far as distributions are concerned, one does not notice this difference except perhaps in minute details.
V Summary and discussions
We studied various static and dynamic properties related to citations of journals, in science (SCI) and social science (SOCSCI) databases. The datasets that have been used were constructed on the basis of ranking according to annual citation and impact factor, but we find that a third measure, introduced as the annual citation rate (CR) gives interesting insights into the data. For example, Set I and II provide only the data for the high ranked journals so that it is possible to study only the tail of the distribution of the quantity according to which the corresponding set is ranked. However, for the CR, one can obtain a distribution which also shows the existence of a peak independent of the set used. Additionally, we find an universal property with respect to the position of the peak. A few important observations made in the present work are summarized below:
- 1.
Scaling the number of citations (either to recent papers or all papers published in a journal) by the total number of (annual) publications is crucial as the properties depend on this scaling. This is indicated by the difference in the behavior of annual citations (AC), impact factors (IF) and the citations rate (CR) – the CR values show considerably larger correlations with the IF ranks and values.
- 2.
Distribution of AC and IF show general behavior similar to each other – the highest values of both can be fitted to power law forms (Pareto) (Fig. 7) with exponents fairly consistent with those obtained from the rank (Zipf) (Fig. 2) plots for the Science journals. For Social Science journals, this is also fairly consistent.
- 3.
The probability distribution of the annual citation rate CR has an universal feature – it shows a maximum at half of the average rate, irrespective of how the journals are ranked. This feature is completely unique from annual citations or impact factors whose probability distributions decay monotonically. This holds true for both Science and Social Science journals (Fig. 8). Distributions of both sets can be fitted to log-Gumbel distribution forms.
A relevant question is whether authors should choose higher IF journals for submission. This choice definitely depends on many factors, the content and impact of the problem and the results reported in the paper being the most important ones. Usually researchers have some idea which are the journals where the acceptance probability is higher for a particular paper. So a set of a few suitable journals are considered for submission. For jobs or promotion of researchers, evaluation might be made on the basis of the number of citations to their papers ( index is a popular measure) and/or by the journal IF where their papers have been published. The second measure is actually quite useless as only current IFs are quoted while their papers might have been published more than two years before. In fact, in more recent times, the policy is not to consider the IF for jobs or promotion.
IF is, however, definitely important from the journal’s viewpoint for advertising/commercial purpose and journals do need to develop policies to improve it. Authors still prefer journals with larger IF when submitting papers (irrespective of job or other prospects) among the suitable journals merely because a comparative measure is available although such a measure might be misleading as already emphasised. A higher IF provides a psychological edge and the tendency to submit manuscripts to a suitable journal with higher IF is like a preferential attachment. However, this does not necessarily lead to a rich get richer effect for the journal. This is because if a submitted paper is accepted, it does not guarantee that it will lead to a larger IF in the coming two years. Rather, if it fails to get cited within the next two years (there is a finite possibility of this, in fact many papers do not get cited at all within a finite time [10, 11]), the IF is bound to suffer. Hence a strategy to increase IF may be to reduce the number of accepted papers and already such efforts have been noted in the data. We found that the average IF as a function of number of articles published in different journals shows a weak decreasing trend (for large number of articles) in 2012 as compared to 2000 to support this idea, however, the data contains large fluctuation and it is better not to make any definitive statement based on this data. Another method to generate larger IF is to increase readership by advertising in many forms. A larger readership ensures greater exposure of papers and probability of citations; the reverse is also true to some extent.
References
- [1] E. Garfield. Science citation index: A new dimension in indexing. Science, 144(3619):649–654, 1964.
- [2] E. Garfield. Citation indexes for science. a new dimension in documentation through association of ideas. Int. J. Epidemiology, 35(5):1123–1127, 2006.
- [3] C. T. Bergstrom, J. D. West, and M. A. Wiseman. The eigenfactor™ metrics. J. Neuroscience, 28(45):11433–11434, 2008.
- [4] A. Fersht. The most influential journals: Impact factor and eigenfactor. Proc. Nat. Acad. Sci., 106(17):6883–6884, 2009.
- [5] P. Sen and B. K. Chakrabarti. Sociophysics: An Introduction. Oxford University Press, Oxford, 2013.
- [6] W. Shockley. On the statistics of individual variations of productivity in research laboratories. Proc. IRE, 45:279–290, 1957.
- [7] J. Laherrere and D. Sornette. Stretched exponential distributions in nature and economy:“fat tails” with characteristic scales. Eur. Phys. J. B, 2(4):525–539, 1998.
- [8] S. Redner. How popular is your paper? an empirical study of the citation distribution. Eur. Phys. J. B, 4(2):131–134, 1998.
- [9] F. Radicchi, S. Fortunato, and C. Castellano. Universality of citation distributions: Toward an objective measure of scientific impact. Proc. Nat. Acad. Sci., 105(45):17268–17272, 2008.
- [10] R. Rousseau. Double exponential models for first-citation processes. Scientometrics, 30(1):213–227, 1994.
- [11] L. Egghe. A heuristic study of the first-citation distribution. Scientometrics, 48(3):345–359, 2000.
- [12] Q. L. Burrell. Stochastic modelling of the first-citation distribution. Scientometrics, 52(1):3–12, 2001.
- [13] Q. L. Burrell. The nth-citation distribution and obsolescence. Scientometrics, 53(3):309–323, 2002.
- [14] A. M. Petersen, H. E. Stanley, and S. Succi. Statistical regularities in the rank-citation profile of scientists. Sci. Rep., 1:181, 2011.
- [15] Y.-H. Eom and S. Fortunato. Characterizing and modeling citation dynamics. PloS one, 6(9):e24926, 2011.
- [16] J. E. Hirsch. An index to quantify an individual’s scientific research output. Proc. Natl. Acad. Sci., 102(46):16569–16572, 2005.
- [17] F. Radicchi and C. Castellano. Analysis of bibliometric indicators for individual scholars in a large data set. Scientometrics, 97(3):627–637, 2013.
- [18] Thompson reuters, journal citation reports. http://admin-apps.webofknowledge.com/JCR/JCR?RQ=HOME, retreived March, 2013.
- [19] I-I. Popescu. On a zipf’s law extension to impact factors. Glottometrics, 6:83–93, 2003.
- [20] R. Mansilla, E. Köppen, G. Cocho, and P. Miramontes. On the behavior of journal impact factor rank-order distribution. J. Informetrics, 1(2):155–160, 2007.
- [21] M. Golosovsky and S. Solomon. Runaway events dominate the heavy tail of citation distributions. Eur. Phys. J. Sp. Topics, 205(1):303–311, 2012.
- [22] A. Clauset, C. R. Shalizi, and M. E. J. Newman. Power-law distributions in empirical data. SIAM review, 51(4):661–703, 2009.