The helium abundance in the metal-poor globular clusters M30 and NGC6397
Abstract
We present the helium abundance of the two metal-poor clusters M30 and NGC6397. Helium estimates have been obtained by using the high-resolution spectrograph FLAMES at the ESO Very Large Telescope and by measuring the He I line at 4471 in 24 and 35 horizontal branch stars in M30 and NGC6397, respectively. This sample represents the largest dataset of He abundances collected so far in metal-poor clusters. The He mass fraction turns out to be Y=0.2520.003 (=0.021) for M30 and Y=0.2410.004 (=0.023) NGC6397. These values are fully compatible with the cosmological abundance, thus suggesting that the horizontal branch stars are not strongly enriched in He. The small spread of the Y distributions are compatible with those expected from the observed main sequence splitting. Finally, we find an hint of a weak anticorrelation between Y and [O/Fe] in NGC6397 in agreement with the prediction that O-poor stars are formed by (He-enriched) gas polluted by the products of hot proton-capture reactions.
Keywords:
stars: abundances — techniques: spectroscopic — globular clusters: individual (M30, NGC6397)I Introduction
Helium is the most abundant among the few chemical elements (3He, 4He, D, 6Li, 7Li, 9Be, 10B and 11B) synthesized directly in the primordial furnax of the Big Bang. The most recent determination of the primordial He mass fraction provides an initial value = 0.2540.003 [37].
The study of the He content of stars in globular clusters (GCs) is still a challenging task but it is crucial for a number of aspects of the stellar astrophysics. First of all, the He content in Galactic GC stars is thought to be a good tracer of the primordial He abundance because these are among the first generations of stars formed in the Universe and the mixing episodes occurring during their evolution only marginally affect their surface He abundance [68]. Moreover, the He content is usually invoked as one of the possible second parameter [29, 21, 15, 51, together with age, CNO/Fe ratio, stellar density; see e.g.], to explain the observed distribution of stars along the horizontal branch (HB), being the overall metallicity the first parameter. Finally, observational evidence reveal the presence of multiple stellar generations in GCs, formed in short timescales (100 Myr) after the initial star-formation burst, from a pristine gas polluted by the products of hot proton-capture processes [see e.g. 30, and references therein]. Thus, these new stars are expected to be characterized by (mild or extreme) He enhancement with respect to the first ones, together with enhancement of Na and Al, and depletion of O and Mg.
Despite such an importance, however, the intrinsic difficulties in the derivation of He abundances in low-mass stars have prevented a detailed and systematic investigation of He in GCs. Only few photospheric He transitions are available in the blue-optical spectral range (5900 ) and they are visible only at high effective temperatures (). Therefore, He lines in GC stars can be detected only among the HB stars hotter than 9000 K (the precise boundary also depends on the available signal-to-noise ratio of the spectra, SNR).
Instead, the measure of the He abundance in FGK-type stars is limited only to the use of the chromospheric line at 10830 , while no photospheric He line is available in these stars. Unfortunately, this transition is extremely weak and very high SNR and spectral resolution are required for a proper measurement. Moreover, the precise He abundance heavily depends on the modeling of the chromosphere. However, this line can provide differential measures of the He abundance, as performed by Pasquini et al. [57] in two giants in NGC2808, Dupree et al. [22] in 12 giant in Omega Centauri and Dupree & Avrett [23] in two giants in Omega Centauri. Pasquini et al. [57] point out a Y difference of at least 0.17 between the two stars. A similar difference has been suggested by Dupree & Avrett [23] for giants in Omega Centauri.
A further complication in the measurement of the He abundance in HB stars is provided by diffusion processes, like radiative levitation and gravitational settling, occurring in the radiative atmospheres of HB stars hotter than 11000-12000 K, corresponding to the so-called Grundahl Jump [34]. These phenomena lead to a substantial modification of the surface chemical composition, and in particular to a decrease of the He abundance [3, see Fig. 22 in] and an enhancement of the iron-peak element abundances. As a consequence, only HB stars in the narrow range between 9000 and 11000 K can be used as reliable diagnostics of the He content of the parent cluster.
At present, determinations of the He mass fraction (Y) in GC HB stars not affected by diffusion processes have been obtained only for some metal-intermediate ([Fe/H]–1.5/–1.1) GCs: NGC6752 [70, Y= 0.240.01, 4 stars], M4 [71, Y= 0.290.01, 6 stars], NGC1851 [31, Y= 0.290.05, 20 stars], M5 [32, Y= 0.220.03, 17 stars], NGC2808 [47, Y= 0.340.01, 17 stars] and M22 [33, Y= 0.340.01, 29 stars]. All these analyses are based on the photospheric He I line at 5875 .
Some evidence suggest that the variation of He in GC stars is linked to different chemical compositions. The differential analysis performed by Pasquini et al. [57] on two giants in NGC2808 with different Na content highlights that the Na-rich star is also He enriched at odds with the Na-poor one. Villanova et al. [70] and Villanova et al. [71] derived He, Na and O abundances for HB stars in NGC6752 and M4, respectively, finding that the stars along the reddest part of the HB of NGC6752 have a standard He content, as well as Na and O abundances compatible with the first generation, while the stars in the bluest part of the HB of M4 are slightly He-enhanced (by 0.05), with Na and O abundance ratios compatible with the second stellar generation. In a similar way, Marino et al. [47] found a clear evidence of He enhancement (by 0.09) among the bluest HB stars in NGC2808, that are also all Na-rich.
Further spectroscopic evidence (not including the measure of He abundances) strengthen the connection between the HB morphology and the chemical composition, pointing out that the bluest portion of the HB (before the onset of the radiative levitation) is populated mainly by second generation stars, while the reddest part of the sequence is dominated by first generation stars [45, like in M4,] or by a mixture of first and second generation stars [47, like in NGC2808,].
In this paper we present the first determination of the He abundance in HB stars of the metal-poor GCs M30 and NGC6397 ([Fe/H]= –2.280.01 and [Fe/H]= –2.120.01, Lovisi et al. [41] and Lovisi et al. [42], respectively).
II Observations
In this work we analyzed a set of high-resolution spectra acquired with the multi-object spectrograph FLAMES in the MEDUSA/GIRAFFE mode at the Very Large Telescope of the European Southern Observatory . The spectra are part of a dataset secured within a project aimed at studying the general properties of blue straggler stars [24, 25, 27, 41, 42]. The employed GIRAFFE grating is HR5A (4340-4587 , with a spectral resolution of 18000), suitable to sample the He I line at 4471.5 . Spectra have been reduced with the standard ESO FLAMES pipeline. Six exposures of 45 min each have been secured in each cluster. The SNR per pixel of the spectra around the He line ranges from 60 up to 130 for M30, and from 75 up to 220 for NGC6397. Radial velocity, atmospheric parameters and projected rotational velocity (sini) of each target have been derived and discussed in Lovisi et al. [41], Lovisi et al. [42] and we refer the reader to those papers for a detailed description. Excluding stars with too noisy spectra and/or too low temperatures (for which the He I line is not detectable), we are finally able to measure the He I line in 24 stars of M30 and in 35 of NGC6397. Fig. 1 shows the position of the targets in the color-magnitude diagrams of the two clusters (large circles) . Table 1 lists their coordinates and atmospheric parameters.


III Chemical analysis
Stellar atmospheric parameters have been derived by Lovisi et al. [41] and Lovisi et al. [42] from the photometry. We recall the main information about the atmospheric parameters determination. and logg have been derived by projecting the position of each star in the (V, V-I) plane on the best-fit theoretical Zero-Age Horizontal Branch (ZAHB) model. For NGC6397 the used ZAHB model is from the BaSTI dataset [59], while for M30 the ZAHB model is from the Pisa Evolutionary Library dataset [6]. For the latter, the choice of a different database of theoretical models is done for consistency with the analysis by Ferraro et al. [25]. However, we checked the consistency between the two sets of models: ZAHB models of the two databases chosen with the same metallicity well overlap each other both in the observative and theoretical plane. The adoption of a dataset instead of another one leads to negligible changes in the atmospheric parameters, typically smaller than 30-40 K and 0.05 in and logg, respectively (note that Marino et al. [47] found a good agreement by using BasTI and PGPUC [69] ZAHB models). The used ZAHB models are shown in Fig. 1.
The He abundance has been obtained for each target by fitting the observed He I line at 4471.5 with a grid of synthetic spectra, calculated with the appropriate atmospheric parameters and varying only the He abundance. The use of spectral synthesis (instead of the simple measure of the line equivalent width) is mandatory in the analysis of this line, to properly account for its relevant Stark broadening and to include the forbidden component at 4470 [49, see e.g. ]. Fig. 2 shows the spectral region around the He line for one of the hottest and one of the coldest target stars in both clusters, with overplotted three synthetic spectra computed with the best-fit Y abundance and Y=0.1.

Synthetic spectra have been computed with the code SYNTHE [66] adopting the line list provided by F. Castelli in her website. They have been convolved with a Gaussian profile in order to properly reproduce the spectral resolution of the HR5 grating and with a rotational profile in order to include the projected rotational velocities derived by Lovisi et al. [41], Lovisi et al. [42].
In order to properly take into account the contribution of the H and He abundances to the opacity, we calculated all the model atmospheres with the last version of the code ATLAS1211 1 http://wwwuser.oat.ts.astro.it/castelli/sources/atlas12.html [11]. At variance with the widely used ATLAS9 code (that adopts pre-tabulated opacities calculated for specific chemical mixtures, in particular with standard He mass fraction Y= 0.245), ATLAS12 employs the opacity sampling method [58] and allows one to calculate model atmospheres with arbitrary chemical composition. All the model atmospheres have been computed under the assumption of Local Thermodynamical Equilibrium (LTE) and one-dimensional, plane-parallel geometry. We checked the impact of the use of ATLAS9 and ATLAS12 models on the derived He abundance. For Y around the standard value (Y0.25) the two models provide the same result, while for He-enhanced stars (at least up to Y0.3), the adoption of ATLAS9 models under-estimates Y of about 0.02. On the other hand, for stars with surface He mass fraction of 0.10, analysis based on the standard ATLAS9 models overestimate Y by 0.05.
Despite the analyzed He transition can suffer for departures from LTE conditions (relevant for B-type stars), this effect is negligible considering the atmospheric parameters and the metallicities of our targets (P. Bonifacio, private communication).
The total uncertainty for each star is derived by adding in quadrature the uncertainty in the fitting procedure and that arising from the adopted parameters. The uncertainty in the fitting procedure has been estimated by using MonteCarlo simulations. For observed spectra, the uncertainty associated to a -minimization cannot be estimated by using the theorems, that assume that all the pixels are not correlated each other [13, 5, see e.g. the discussions in]. In fact, in observed spectra the adjacent pixels cannot be considered as independent each other because of the re-binning procedure during the wavelength calibration. For each star, we computed a set of 1000 synthetic spectra, calculated with the appropriate atmospheric parameters, rotational velocities and the best-fit He abundance. Each MonteCarlo spectrum has been obtained by rebinning the best-fit synthetic spectrum to the same pixel-size of the GIRAFFE spectra (0.05 /pixel) and then by injecting Poissonian noise, in order to reproduce the SNR of each star around the He line. Thus, this set of synthetic spectra is equivalent to the real one but with the He abundances known a priori. This method allows to take into account simultaneously the main sources of uncertainty in the line fitting, namely the finite size of the pixels, the SNR and the continuum estimate. The same analysis performed for the observed spectra has been done for the synthetic ones and the dispersion of the derived Y abundance distribution has been assumed as 1 uncertainty in the fitting procedure. These uncertainties depend on the injected SNR, but also on the line strength (thus the temperature and the He abundance) and the rotational velocity. Typical errors in He mass fraction range from 0.01 up 0.05.
Because we are interested in possible star-to-star variations of the He content, we estimated the internal uncertainties due to the atmospheric parameters. The total error obtained by adding in quadrature the uncertainties due to the individual atmospheric parameters is an upper limit of the internal error, because it does not take into account the covariance terms occurring among the parameters. In order to take into account the effect of the projection process on the derived and log g, we adopt the following procedure: we re-projected each target on the best-fit ZAHB by including its photometric uncertainty, re-determining simultaneously and log g, in order to include the correlation between the two parameters. With this method we derive variations in between 70 and 150 K, with corresponding variations in gravity of the order of 0.02. These relatively small uncertainties in and log g are essentially due to the high internal accuracy of the adopted photometric catalogs, with typical photometric uncertainties of (V-I)0.01-0.02 mag, obtained by the average of several independent measures [25, see e.g.]. Note also that these uncertainties do not represent the total error budget in the adopted parameters, but only the internal star-to-star uncertainty related to the adopted procedure in the parameter derivation.
Only to provide the general variation of Y due to this procedure, an uncertainty of 100 K in (coupled with the corresponding variation in gravity of 0.02) provides a variation in Y of 0.01 for the hottest stars (11000 K) and of 0.02 for the coldest targets (9000 K), whereas the impact of microturbulent velocity is totally negligible. The error in sini (typically 2-3 km/s) provides a contribution at a level of less than 0.005.
Note that the 4471 He line used in this work is slightly less sensitive to the adopted atmospheric parameters with respect to the line at 5875 , adopted in the other papers where the He abundance in GC stars is derived.
Finally, systematic effects can be due to the choice of the ZAHB model. As extensively discussed by Marino et al. [47], a possible source of systematic errors is the He abundance of the used ZAHB. The He abundance of our targets is not known a priori, thus we derived the atmospheric parameters adopting ZAHB models computed with standard Y. The adoption of a Y-enhanced ZAHB leads to a decrease of gravity by 0.1-0.15, with a negligible impact on the temperature. Note that a systematic decrease of 0.1 in log g (keeping fixed) implies an increase of the derived Y smaller than 0.02/0.03. As discussed in Section IV, the adoption of the standard He content for the used ZAHB models is reasonable in light of the derived He content of our targets, thus we do not need to re-derive the atmospheric parameters by using ZAHB models computed with higher Y. A similar effect is obtained if we consider that the stars leaving the ZAHB locus will be more luminous and with a lower gravity (but basically the same temperature) with respect to the ZAHB position.
IV The He content of M30 and NGC6397
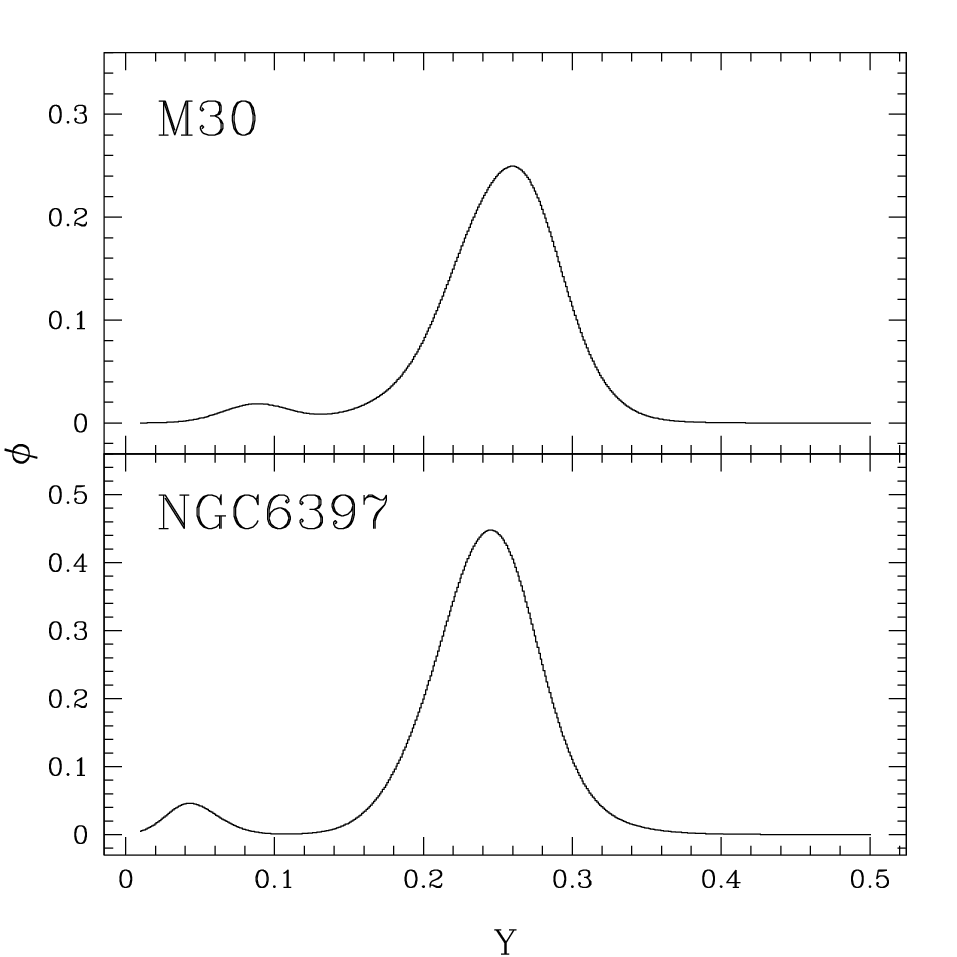
Table 1 lists the derived He mass fraction of the targets and their total uncertainty. Fig. 3 shows the behavior of Y as a function of the temperature for the stars of M30 (upper panel) and NGC6397 (lower panel), while Fig. 4 shows the Y distributions in the two samples of stars represented as generalized histograms [38, a representation that removes the effect due to the choice of the starting point and of the bin size, and takes into account the individual uncertainty of each star; see]. In both GCs, all the stars have Y around 0.24-0.25, with the exception of one star in M30 and two stars in NGC6397, that show very low (Y0.1) He abundance. The three stars with low He content also show iron abundances higher than that of the parent cluster [41, 42]. This behavior is commonly observed in HB stars hotter than the Grundahl Jump [1, 2, 35, 31] and it is predicted by theoretical models [48, 63] as an effect of radiative levitation (responsible for the metal enhancement) and gravitational settling (responsible for the He depletion). We note that some stars with similar to those of the He-poor stars, but with normal Y, are detected. This difference can be due to the fact that we observe the region close to the Grundahl Jump and not all the stars have still undergone the diffusion processes. Interestingly enough, one star in NGC2808 with a temperature higher than that of the Grundahl Jump does not show any evidence of He depletion [47].
Excluding the three Fe-rich and He-poor stars, we find average He mass fractions of Y=0.2520.005 (=0.021) for M30 and Y=0.2410.004 (=0.023) for NGC6397. It is worth to notice that these are not only the first determinations of Y for M30 and NGC6397, but they are also the first ones for GCs with [Fe/H]–2.0 dex 22 2 Behr et al. [2] and Behr [3] identified one HB star in M92 and one HB star in M15 (both [Fe/H]–2.0 dex), not affected by levitation and gravitational settling effects. However, their huge uncertainties (0.3-0.4 dex) do not allow to firmly establish the real He content of these GCs..


According to the theoretical models of Pietrinferni et al. [59], the surface He mass fraction for a star with 0.8 , Z= 0.0003 (corresponding to [Fe/H]=–2.1) and -enhanced chemical mixture, increases by only 0.01 with respect to the initial value, after the First Dredge-Up episode. Therefore, the derived He abundances of HB stars in M30 and NGC6397 are totally compatible with the expectations for low-mass evolved stars formed with a primordial He abundance [37, = 0.254, ].
No trend between the He abundances and the corresponding (V-I) color and V-band magnitude is detected for the stars with no evidence of radiative levitation . Fig. 5 shows the behaviour of Y as a function of (V-I) and V. The best-fit linear fits are calculated with the routine fitexy by Press et al. [62] to take into account the uncertainties in both the quantities, whereas the corresponding uncertainties in the slope are calculated with the Jackknife bootstrapping technique. In a similar way, no evident trend between Y and is recognized: Fig. 3 shows the linear fits, providing slopes of 6.40.005 and -1.150.008.
The observed Y values among the stars of each target GC are compatible within the uncertainties. Thus, we can conclude that the two GCs are not strongly enriched in He, displaying a substantial He uniformity: only small (if any) Y variations could be present in their stellar content. This result agrees with the analysis of NGC6397 by di Criscienzo et al. [19], based on the width of the observed main sequence (MS), that predicts a maximum internal variation of 0.02 in the Y distribution of the cluster MS stars. Further results by Milone et al. [50] revealed the presence of a double MS in the color-magnitude diagram of NGC6397. This can be reproduced with a population (accounting for 30% of the total cluster population) having normal Y and another one with a mild He-enhancement of about 0.01. Again, this is fully consistent with our results. Concerning M30, no study so far has revealed splitting or anomalous broadening of the MS, suggesting a small or null intrinsic dispersion in the He content of this cluster, in agreement with our findings.
Finally, the uniform He content that we find in the HB stars of M30 and NGC6397 well agrees with theoretical models that predict only a mild He enhancement for clusters with HB morphologies similar to that of our targets (covering a narrow extension in color, thus in ; see Fig. 1), at odds with clusters with very extended blue tails for which high He enhancements (Y0.30) are predicted [15, see e.g. Fig. 10 in].
V He abundance and self-enrichment process
He enrichment in GC sub-populations is expected in light of the self-enrichment processes, thought to occur during the early stages (within 100 Myr) of GC history. All the GCs studied so far, both in the Milky Way [7] and in other galaxies of the Local Group [39, 53], display well-established chemical patterns, with homogeneous iron-peak element abundances and with anticorrelations between C and N, between O and Na, and (for some clusters) between Mg and Al. The only exceptions are a bunch of peculiar GC-like systems with an intrinsic dispersion in their iron content (with broad and/or multimodal [Fe/H] distributions), namely Terzan 5 [26], Omega Centauri [36, 55, 56, see e.g.], M22 [44, 46] and M54 [4, 9] 33 3 Note that other GCs are suspected to have small iron dispersions, namely NGC1851 [10], NGC5824 [65] and NGC3201 [67, 54], but there is no general consensus about them.. The chemical patterns involving light elements and observed in GCs are commonly interpreted as the signature of material processed through the high temperature extension of the proton-capture reactions (like NeNa and MgAl cycles).
Intermediate-mass AGB stars [18] and fast-rotating, massive stars [17], both able to ignite the complete CNO-cycle, have been proposed as main polluters. Whichever the true nature of the polluters is, new cluster stars, formed from pristine gas diluted with material processed in the stellar interiors, are expected to be also enriched in He, with a level of He enrichment varying from cluster to cluster, from very small values (0.02), as in the case of NGC6397 [19, 50], up to extreme He contents (Y0.4), as those proposed to explain the complex MS and/or HB morphologies observed in Centauri [60], NGC2808 [16, 61, 14] and NGC2419 [20].
A first, indirect hint of Y-[O/Fe] anti-correlation has been provided by Villanova et al. [70] and Villanova et al. [71], who analyse red HB stars of NGC6752 and blue HB stars of M4, respectively. The HB stars in NGC6752 show enhanced [O/Fe] ratios and Y compatible with the cosmological value, while the stars along the blue portion of the HB in M4 have enhanced values of Y (by 0.04-0.05) and [O/Fe] ratios compatible with the second generation stars of the cluster. Even if performed on two different clusters, these results by Villanova et al. [70] and Villanova et al. [71] suggest that the blue part of the HB is mainly populated by stars formed from gas enriched in He and, generally speaking, by the products of the high temperature proton-capture reactions. Analysis based on other elements and not involving directly the measure of the He abundance, have confirmed the connection between the position of the HB stars and their chemical composition [see for instance 45, 31, for the cases of M4 and NGC1851, respectively].
We can use our dataset to probe the existence of any Y-[O/Fe] correlations in the two surveyed clusters. Indeed Lovisi et al. [41] and Lovisi et al. [42] measured non-LTE [O/Fe] abundances for several HB stars of the two target clusters from the oxygen triplet at 7770 . Fig. 6 shows the behavior of Y as a function of [O/Fe] (excluding the Y-poor stars where the radiative levitation and gravitational settling have modified the surface abundances).
Abundances of both [O/Fe] and Y are available for only 12 stars of M30. No correlation between the two abundances is detectable (upper panel in Fig. 6): a straight line fit, performed with the routine fitexy by Press et al. [62] provides a slope of -0.0110.057 [43, where the uncertainty is computed with a Jackknife bootstrapping technique; see]. The small probability of correlation is confirmed also by the Spearman rank correlation coefficient (=–0.50), leading to a probability of only 90% that the two abundances are correlated.
On the other hand, the sample of 33 stars of NGC6397 for which both O and Y are available displays a mild Y-[O/Fe] anti-correlation (lower panel in Fig. 6). A linear fit provides a slope of -0.0360.010, corresponding to a 3.6 detection. The Spearman rank correlation coefficient is =–0.54, providing a probability higher than 99.9% of an anti-correlation between the two abundances. The same result is confirmed also by a non-parametric Kendall- test 44 4 In a similar way, Monaco et al. [52] recognized a very mild anti-correlation between Na and Li abundances among the dwarf stars of M4 (and justified in the framework of the multiple populations in GCs). Even if their abundance distributions do not show evidences of intrinsic scatter (in light of the estimated uncertainties), both parametric and non-parametric rank correlation test highlight an anti-correlation between the two abundances..
An interesting difference between the two clusters is their [O/Fe] distributions, being that of NGC6397 larger than that of M30 and including a component with [O/Fe]0. Previous determinations of the O abundance in NGC6397 provide a small range of [O/Fe], with no evidence so far of O-poor stars. Despite its proximity, the number of stars in NGC6397 in which the O abundance has been measured is very small and most of the analysis available so far are based on the forbidden O line at 6300 . Castilho et al. [12] provided [O/Fe] for 2 (out of 16) giants, finding for both the stars [O/Fe]=+0.15 dex. Carretta et al. [7], Carretta et al. [8] properly measured O in 12 giants observed with UVES (reaching [O/Fe]=+0.11 dex) and provided upper limits for other 7 giants, while for most of the stars of their GIRAFFE survey no measures at all are provided, because of the low SNR and the radial velocity of the cluster (RV20 km/s) that leads to an overlap between the forbidden O line with the sky O emission line. Recently, Lind et al. [40] derived O abundances for 16 giant stars, finding a very small variation of O among their stars, from [O/Fe]=+0.41 up +0.77 dex. Only Gratton et al. [28] measured the oxygen triplet at 7770 A for 7 dwarf/subgiants (and an upper limit) finding a range between +0.08 and +0.48 dex.
However, we suggest a possible bias in the measure of the O distribution of NGC6397 from giant stars. The derivation of the precise [O/Fe] abundances range in the giant stars of metal-poor globular clusters can be quite complex, because the only available oxygen line is the forbidden one that is very weak at low metallicity. Moreover, the almost zero radial velocity makes impossible to properly detect the O line (in the case of M 30 this effect does not occur because of its radial velocity, -185 km/s, prevents any blending with the sky emission line). We conclude that the giant stars are not the best sample to properly study the O abundance (and in particular to identify the most O-poor stars) in NGC6397. If a [O/Fe] sub-solar component does exist among the star of NGC6397, it cannot be detected from the analysis of its giant stars. On the other hand, the O triplet at 7770 A is well detectable and strong among HB stars, providing a more robust diagnostic. Also, we note the very good match between our [O/Fe] distribution and that by Carretta et al. [8] for M30, where the very low radial velocity of this cluster prevents any spurious blending between the forbidden O line and the emission O sky line.
We checked whether the impact of the atmospheric parameters uncertainties is able to introduce a spurious anti-correlation between the two abundances. In fact, the increase of (coupled with the corresponding increase of log g) leads to an increase of [O/Fe] and a decrease of Y. However, the slope is significantly steeper (-0.75) than that observed for the stars in NGC6397 (see the arrows in Fig. 6, showing the effects of a change in and log g by –200 K and –0.04, respectively). This slope remains the same for stars with different atmospheric parameters and with difference O abundances. Thus, we can rule out that the observed anti-correlation is an artifact of the uncertainty of the atmospheric parameters. Also, we checked that no correlation does exist between the abundances and sini; note that the internal uncertainties in sini are not able to introduce a spurious anticorrelation between the abundances.
As a sanity check, we roughly divided the Y abundances of NGC6397 in two samples, corresponding to [O/Fe] lower and higher than the solar value, finding Y= 0.2580.005 (= 0.015) and Y= 0.2330.005 (= 0.022), respectively. This small difference [19, 50, formally compatible with the results by] corresponds to a 3.5 detection. A Kolmogorov-Smirnov test provides a 1% probability that the Y abundances of the stars with sub-solar [O/Fe] abundances are extracted from the same population as the stars with [O/Fe]0.0.
VI Summary
We have analysed the He mass fraction Y for a sample of 24 and 35 HB stars in M30 and NGC6397, respectively. The main results are: (i) both clusters have an average He content compatible with the primordial He abundance (Y=0.2520.003 for M30 and Y=0.2410.004 for NGC6397) and they are not strongly enriched in He; (ii) a weak (but statistically significant) anticorrelation between Y and [O/Fe] among the HB stars of NGC6397 does exist (but it is not detected in M30).
We suggest that the O-poor, He-rich stars found in the HB of NGC6397 belong to the second stellar generation of the cluster. Unfortunately Na abundances are not available for these stars. In principle, Y-[O/Fe] anti-correlation is expected in all the GCs displaying the chemical signatures of the self-enrichment processes, even if its very small slope makes its detection very hard. The lack of Y-[O/Fe] anti-correlation for the stars in M30 can be due to several causes, mainly the size of our sample (three times smaller than that secured for NGC6397) and the SNR of the spectra (lower than that of the spectra of NGC6397). Also, we cannot rule out that M30 has undergone a self-enrichment process less efficient with respect to NGC6397, as suggested by their different [O/Fe] distributions (in fact M30 shows a lack of stars with [O/Fe]0, instead detected among the stars of NGC6397). Thus, the internal variation of the He content in the stellar population of M30 could be smaller than 0.01.
The Y-[O/Fe] anti-correlation observed in NGC6397 seems to confirm the theoretical expectations that the GC stars born after the first burst of star formation are both depleted in O and (mildly) enriched in He, demonstrating that the stars usually labelled as second generation stars show the signatures of hot-temperature proton-capture processes, with a simultaneous O-depletion and a weak He enrichment.

References
- [1] Behr, B. B., Cohen, J . G., McCarthy, J. K. & Djorgovski, S. G., 1999, 517L, 135
- [2] Behr, B. B., Cohen, J . G., & McCarthy, J. K., 2000, ApJ, 531L, 37
- [3] Behr, B. B., 2003, ApJS, 149, 67
- [4] Bellazzini, M., Ibata, R. A., Chapman, S. C., Mackey, A. D., Monaco, L., Irwin, M. J., Martin, N. F., Lewis, G. F., & Dalessandro, E., 2008, AJ, 136, 1147
- [5] Caffau, E., Bonifacio, P., Faraggiana, R., Francois, P., Gratton, R. G., & Barbieri, M., 2005, A&A, 441, 533
- [6] Cariulo, P. Degl’Innocenti, S., & Castellani, V., 2004, A&A, 421, 1121
- [7] Carretta, E. et al., 2009, A&A, 505, 117
- [8] Carretta, E., Bragaglia, A., Gratton, R. G., & Lucatello, S., 2009, A&A, 505, 139
- [9] Carretta, E., et al., 2010, A&A, 520, 95
- [10] Carretta, E., et al., 2010, ApJ, 722L, 1
- [11] Castelli, F., 2005, Mem. Soc. Astron. Ital. Suppl., 8, 25
- [12] Castiho, B. V., Pasquini, L., Allen, D. M., Barbuy, B., & Molaro, P., 2000, A&A, 361, 92
- [13] Cayrel, R., Spite, M., Spte, F., Vangioni-Flam, E., Cassé, M., & Audouze, J., 1999, A&A, 343, 923
- [14] Dalessandro, E., Salaris, M., Ferraro, F. R., Cassisi, S., Lanzoni, B., Rood, R. T., Fusi Pessi, F., & Sabbi, E., 2011, MNRAS, 410, 694
- [15] Dalessandro, E., Salaris, M., Ferraro, F. R., Mucciarelli, A., & Cassisi, S., 2013, MNRAS, 430, 459
- [16] D’Antona, F., Bellazzini, M., Caloi, V., Fusi Pecci, F., Galleti, S., & Rood, R. T., 2005, ApJ, 631, 868
- [17] Decressin, T., Meynet, G., Charbonnel, C., Prantzos, N., & Ekstrom, S., 2007, A&A, 464, 1029
- [18] D’Ercole, A., Vesperini, E., D’Antona, F., McMillan, S. L. W., & Recchi, S., 2008, MNRAS, 391, 825
- [19] di Criscienzo, M., D’Antona, F., & Ventura, P., 2010, A&A, 511, A70
- [20] di Criscienzo, M., D’Antona, F., Milone, A. P., Ventura, P., Caloi, V., Carini, R., D’Ercole, A., Vesperini, E, & Piotto, G., 2011, MNRAS, 414, 3381
- [21] Dotter, A., et al., 2010, ApJ, 708, 698
- [22] Dupree, A. K., Strader, J., & Smith, G. H., 2011, ApJ, 728, 155
- [23] Dupree, A. K. & Avrett, E. H., 2013, ApJ, 773, 28
- [24] Ferraro, F. R., et al., 2006, ApJ, 647, L53
- [25] Ferraro, F. R., et al., 2009, Nature, 462, 1028
- [26] Ferraro, F. R., et al., 2009, Nature, 462, 483
- [27] Ferraro, F. R., et al., 2012, Nature, 492, 383
- [28] Gratton, R. G. et al., 2001, A&A, 369, 87
- [29] Gratton, R. G., Carretta, E., Bragaglia, A., Lucatello, S., & D’Orazi, V., 2010, A&A, 517, 81
- [30] Gratton, R. G., Carretta, E., & Bragaglia, A., 2012a, A&AR, 20, 50
- [31] Gratton, R. G., Lucatello, S., Carretta, E., Bragaglia, A., D’Orazi, V., Momany, Y., Sollima, A., Salaris, M., & Cassisi, S., 2012a, A&A, 544, 12
- [32] Gratton, R. G., Lucatello, S., Sollima, A., Carretta, E., Bragaglia, A., Momany, Y., D’Orazi, V., Cassisi, S., Pietrinferni, A. & Salaris, M., 2013, A&A, 549, 41
- [33] Gratton, R. G., Lucatello, S., Sollima, A., Carrettam E., Bragaglia, A., Momany, Y., D’Orazi, V., Cassisi, S., & Salaris, M., 2014, arXiv1401.7109
- [34] Grundahl, F., Catelan, M., Landsam, W. B., Stetson, P. B., & Andersen, M. I., 1999, ApJ, 524, 242
- [35] Hubrig, S., Castelli, F., de Silva, G., Gonzales, J. F., Momany, Y., Netopil, M., & Moehler, S., 2009, A&A, 499, 865
- [36] Johnson, C. I., & Pilachowski, C. A., 2010, ApJ, 722, 1373
- [37] Izotov, Y. I., Stasinska, G., Guseva, N. G., 2013 A&A, 558, 57
- [38] Laird, J. B., Rupen, M. P., Carney, B. W., & Latham, D. W., 1988, AJ, 96, 1908
- [39] Letarte, B., Hill, V., Jablonka, P., Tolstoy, E., Francois, P., & Meylan, 2006, A&A, 453, 547
- [40] Lind, K., Charbonnel, C., Decressin, T., Primas, F., Grundahl, F., & Asplund, M., 2011, A&A, 527, 148
- [41] Lovisi, L., Mucciarelli, A., Lanzoni, B., Ferraro, F. R., Gratton, R., Dalessandro, E., & Contreras Ramos, R., 2012, ApJ, 754, 91
- [42] Lovisi, L., Mucciarelli, A., Lanzoni, B., Ferraro, F. R., Dalessandro, E., & Monaco, L., 2013, ApJ, 772, 148
- [43] Lupton, R., 1993, in Statistics in Theory an Pratice (Princeton, NJ: Princeton, Univ. Press)
- [44] Marino, A. F., Milone, A. P., Piotto, G., Villanova, S., Bedin, L. R., Bellini, A., & Renzini, A., 2009, A&A, 505, 1099
- [45] Marino, A. F. , Villanova, S., Milone, A. P., Piotto, G., Lind, K., Geisler, D., & Stetson, P. B., 2011, ApJ, 730, 16
- [46] Marino, A. F., et al., 2011, A&A, 532, 8
- [47] Marino, A. F., et al., 2014, MNRAS, 437, 1609
- [48] Michaud, G., Vauclair, G., & Vauclair, S., 1983, ApJ, 267,256
- [49] Mihalas, D., Barnard, A. J., Cooper, J., & Smith, E. W., 1974, ApJ, 190, 315
- [50] Milone, A. P., Marino, A. F., Piotto, G., Bedin, L. R., Anderson, J., Aparicio, A., Cassisi, S., & Rich, R. M., 2012, ApJ, 745, 27
- [51] Milone et al., 2013, arXiv1312.4169
- [52] Monaco, L., Villanova, S., Bonifacio, P., Caffau, E., Geisler, D., Marconi, G., Momany, Y.,& Ludwig, H.-G., 2012, A&A, ….
- [53] Mucciarelli, A., Origlia, L., Ferraro, F. R., & Pancino, E., 2009, ApJ, 695L, 134
- [54] Munoz, C., Geisler, D., & Villanova, S., 2013, MNRAS, 433, 2006
- [55] Pancino, E., Mucciarelli, A., Sbordone, L., Bellazzini, M., Pasquini, L, Monaco, L., & Ferraro, F. R., 2011, A&A, 527, 18
- [56] Pancino, E., Mucciarelli, A., Bonifacio, P., Monaco, L., & Sbordone, L., 2011, A&A, 534, 53
- [57] Pasquini, L., Mauas, P., Kaufl, H. U., & Cacciari, C., 2011, A&A, 531, 35
- [58] Peytremann, E., 1974, A&A, 33, 203
- [59] Pietrinferni, A., Cassisi, S, Salaris, M., & Castelli, F., 2006, ApJ, 642, 797
- [60] Piotto, G., et al. 2005, ApJ, 621, 777
- [61] Piotto, G., Bedin, L. R., Anderson, J., King, I. R., Cassisi, S., Milone, A. P., Villanova, S., Pietrinferni, A., & Renzini, A., 2007, ApJ, 661L, 53
- [62] Press, W. H., Teukolsky, S. A., Vetterling, W. T. & Flannery, B. P., 1992, Numerical Recipes, 2nd edn. (Cambridge: Cambridge Univ. Press)
- [63] Quievy, D., Charbonneau, P., Michaud, G., & Richer, J., 2009, A&A, 500, 1163
- [64] Richer, J., Michaud, G., Rogers, F., Iglesias, C., Turcotte, S., & Leblanc, F., 1998, ApJ, 492, 833, 1998, ApJ, 492, 833
- [65] Saviane, I., da Costa, G. S., Held, E. V., Sommariva, V., Gullieuszik, M., Barbuy, B., & Ortolani, S., 2012, A&A, 540, 27
- [66] Sbordone, L., Bonifacio, P., Castelli, F., & Kurucz, R. L., 2004, MSAIS, 5, 93
- [67] Simmerer, J., Ivans, I. I., Filler, D., Francois, P., Charbonnel, C., Monier, R., & James, G., 2013, ApJ, 764, 7L
- [68] Sweigart, A. V., 1997, ApJ, 474, 23
- [69] Valcarce, A. A. R., Catelan, M., & Sweigart, A. V., 2012, A&A, 547, A5
- [70] Villanova, S., Piotto, G., & Gratton, R. G., 2009, A&A, 499, 755
- [71] Villanova, S., Geisler, D., Piotto, G., & Gratton, R. G., 2012, ApJ, 748, 62
| ID | Ra | Dec | log g | Y | ||
|---|---|---|---|---|---|---|
| (J2000) | (J2000) | (K) | ||||
| M30 | ||||||
| 10201925 | 325.0989565 | -23.1613142 | 10914 | 3.7 | 0.229 | 0.021 |
| 10202614 | 325.0891261 | -23.1711663 | 10069 | 3.6 | 0.243 | 0.041 |
| 10203922 | 325.0904138 | -23.1512884 | 10186 | 3.6 | 0.261 | 0.051 |
| 10301333 | 325.1135774 | -23.1751181 | 10023 | 3.6 | 0.216 | 0.056 |
| 10301793 | 325.1201773 | -23.1736029 | 9376 | 3.4 | 0.266 | 0.036 |
| 10400762 | 325.0974077 | -23.1873751 | 9226 | 3.4 | 0.208 | 0.036 |
| 10401890 | 325.1056998 | -23.1838967 | 9931 | 3.6 | 0.216 | 0.045 |