Electroweak measurements from , and photon final states
Abstract
We present the most recent precision electroweak measurements of single and boson cross section and properties from the LHC and Tevatron colliders, analyzing data collected by ATLAS, CDF, CMS, D0, and LHCb detectors. The results include the measurement of the single and boson cross section at LHC, the differential cross section measurements, the measurement of boson mass, the measurement of and charge asymmetry. These measurements provide precision tests on the electroweak theory, high order predictions and the information can be used to constraint parton distribution functions.
keywords
LHC, Tevatron, Electroweak, ,1 Introduction
The precision electroweak measurements provide stringent tests the on Standard Model (SM): the measurement of single and boson cross section provides critical tests on the perturbative QCD and the higher order predictions, the measurement of charge asymmetry can be used to constraint the parton distribution functions (PDFs), and the measurement of mass and weak mixing angle () improves precision of the SM input parameters.
Recently, in both LHC and Tevatron, there are plenty of analyses related to the single and boson have been performed. The LHC is a collider, results reviewed in this article used the collision data at center-of-energy of 7 TeV and 8 TeV, collected by the ATLAS [1], CMS [2] and LHCb [3] detectors. The Tevatron is a collider, with center-of-energy of 1.96 TeV, using data collected by the CDF [4] and D0 [5] detectors. The and precision measurements have been performed based on these data.
At the Tevatron, the and are produced with the . And at the LHC, in the productions of single and boson, the and contributions become larger. Thus, single and measurements at the Tevatron are complementary to that at the LHC. Furthermore, with knowing incoming direction, the forward-backward charge asymmetry at the Tevatron will be more sensitive compared with that measurement at the LHC.
In this article, we review the and cross section measurements from the LHC at first, then review the measurements of boson transverse momentum from both the Tevatron and LHC. In the end, the measurement of the boson mass, / charge asymmetry measurements, are presented. The physics results are collected from ATLAS, CDF, CMS, D0, and LHCb collaborations.
2 The and total cross section measurements
Precise determination of the vector boson production cross section and their ratios provide an important test of the SM.
2.1 Inclusive cross section
At the LHC, the production of vector boson requires at least one sea quark, and given the high scale of this process, the gluon contribution becomes significant. Furthermore, the inclusive cross section of vector boson production is also sensitive to the PDFs, the cross section predictions depend on the momentum distribution of the gluon. And the theoretical uncertainty is another limitation for the cross section measurement, the current available predictions are at next-to-leading (NLO) and next-to-next-to-leading order (NLO) in perturbative QCD. In Fig. 1, the measured and cross sections from different hadron colliders are compared with NNLO predictions, the predictions agree with measured value well.

Both ATLAS [6] and CMS [7] collaborations presented the inclusive and cross section at TeV, with electron and muon decay channels, using a data sample corresponding to 35 pb-1 and 36 pb-1 of integrated luminosity collected in 2010. And furthermore, CMS [8] using data corresponding to 19 pb-1 of integrated luminosity collected in 2012 at TeV.
With TeV data, the measured inclusive cross sections from CMS are nb and nb, and from ATLAS are nb and nb.
By presenting the measured cross section as a ratio will result a cancellation of systematic uncertainty, including the luminosity uncertainty. Thus, the ratios between measured and , also the ratio between and , are shown in Fig. 2 and Fig. 3.
The measurements of vector boson production cross section are consistent between the electron and muon channels, and in agreement with NNLO order predictions.


2.2 Differential cross section
The differential cross section of Drell-Yan (DY) process as a function of two leptons invariant mass is sensitive to the PDFs, particular in the high mass region (corresponding to the distribution function of antiquarks with high value), and also provide stringent test on the high order perturbative QCD calculations. Additionally, this process is a important source of background for other beyond SM searches, the mass spectrum could be changed by new physics phenomena. The ATLAS [9] and CMS [10] report measurement of the high mass DY differential cross section measurement, as shown in Fig. 4. The measured differential cross sections are constant with different NLO (or NNLO) theoretical predictions, with more data in the future, this measurement could be used to constraint PDFs, in particular for antiquarks with large .

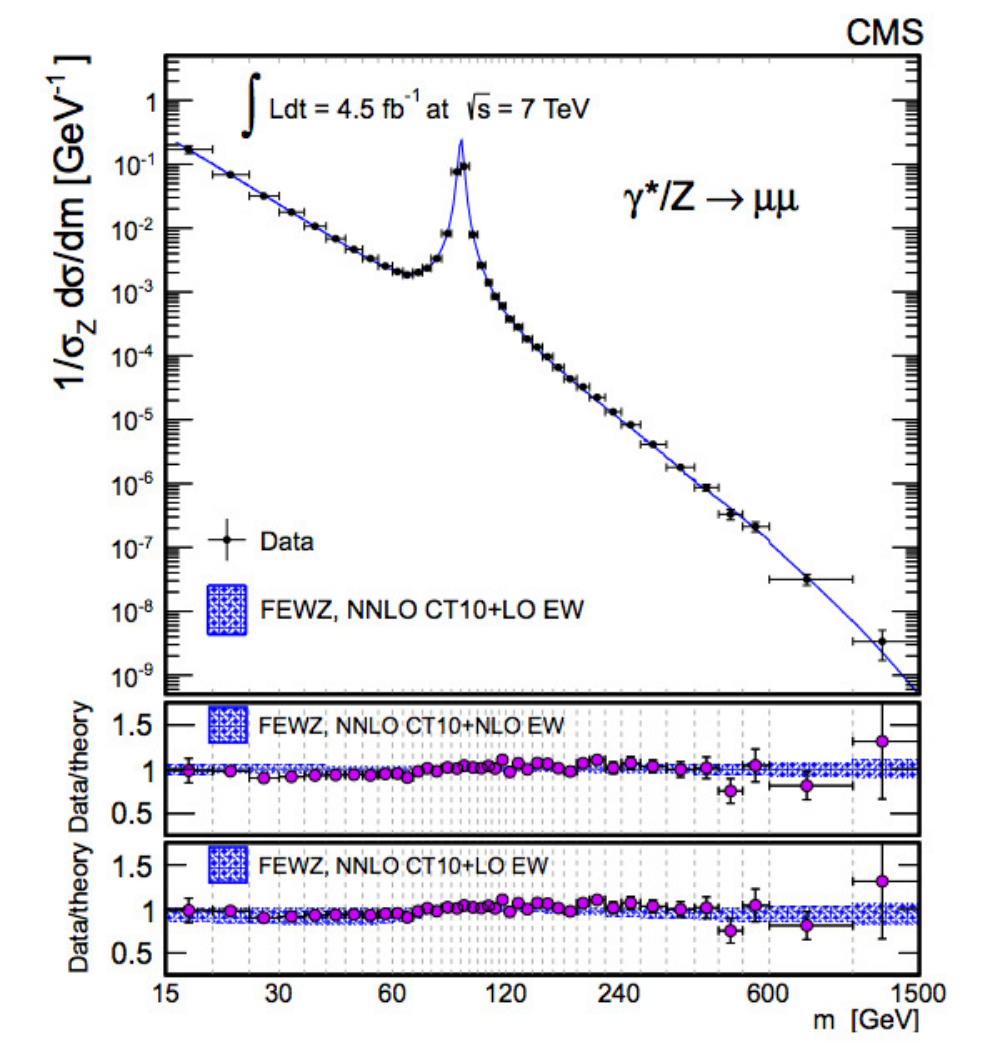
CMS also performed a double-differential cross sections measurement [10], as functions of boson rapidity () and invariant mass. By including additional boson rapidity information (), the differential cross section provides more information for the PDFs, while the low mass region, the high order effects and final state radiation (FSR) become particularly important. The measured differential cross section as a function of boson in the mass region of 20 to 30 GeV is shown in Fig. 5. The double -differential cross section measurement of DY will provides precise inputs to the future PDF sets fitting.

2.3 Lepton universality
The coupling of the leptons (, , ) to the gauge vector boson are independent. The ATLAS performed a measurement of lepton universality [6], by comparing the cross sections measured using electron channel and muon channel. The ratio between electron and muon channels results is shown in Fig. 6. The result confirms - universality in both and decays.
2.4 and cross section measurements at LHCb
In the LHCb, the measurement of the and cross section provide a unique test on the SM with high rapidity and events. Thus, the LHCb results have better precision than ATLAS and CMS in the forward region (). The most recent results [11, 12, 13, 14] are for the inclusive cross section measurements, and the differential cross section measurement in different channels, as functions of rapidity or invariant mass. The LHCb inclusive cross section measurements results are shown in Fig. 7, and one of the differential cross section measurement from LHCb is shown in Fig. 8.


3 The boson transverse momentum measurements
Initial state QCD radiation from the colliding parton can change the kinematic of the Drell-Yan process system, results boson be boosted with a transverse momentum, thus the precision measurement of boson can provide a stringent test on the higher order QCD perturbative calculation. And this measurement can be used to reduce the theory uncertainty of the measurement of mass . In the low region, this process is dominated by soft and collinear gluon emission, with the limitation of standard perturbative calculation, the QCD resummation methods are used in the low region. While in the high region, the process is dominated by single parton emission, thus, fixed-order perturbative calculations are used in the high region.
3.1 Traditional method
In general, the boson can be directly measured by using the reconstructed boson . As has been done before [15], CDF performed a precision measurement of transverse momentum cross section of pairs in the boson mass region of 66-116 GeV/, with 2.1 fb-1 of integrated luminosity [16]. Fig. 9 shows the ratio between measured data value and resbos predictions. And CMS reported a similar measurement using data corresponding to 18.4 pb-1 of integrated luminosity [17], as shown in Fig. 10. The overall agreement with predictions from the SM is observed, and the results have sufficient precision for the refinements of phenomenology in the future.


3.2 A Novel method
In the previous measurements, the uncertainty is dominated by the experimental resolution and efficiency, and the choice of bin widths is limited by the experimental resolution rather than event statistics. In order to improve the precision of the boson measurements, D0 published measurement of boson [18], presented with a novel variable () [19]. The ATLAS and LHCb performed same measurements of [20, 12], as shown in Fig. 11 and Fig. 12. The measured results provide sufficient information to the future retuning of theoretical predictions.

4 The and properties measurements
There are many other electroweak measurements from Tevatron and LHC, which measure input parameters of the SM with better precision, including the measurement of mass, the measurement of charge asymmetry, and the measurement of weak mixing angle.
4.1 Measurement of the boson mass
The precision measurement of mass contribute to the understanding of the electroweak interaction. By combining the more recent measurement of mass from both CDF [21], D0 [22], and previous Tevatron measurements, the Tevatron average value is MeV [23]. The combination of mass with the LEP average further reduces the uncertainty to 15 MeV, as shown in Fig. 13.
4.2 charge asymmetry measurements
The charge asymmetry is sensitive to PDFs. The Tevatron is a collider, the quark tends to carry higher momentum than quark, thus arise a non-zero asymmetry as a function of rapidity. The LHC is collider, proton has two valance quarks and one valence quark, there are more than . In hadron colliders, the neutrino escapes the detector without producing any measurable signal, without the neutrino longitudinal momentum, the charge asymmetry can be measured as lepton charge asymmetry, which is a convolution of the boson asymmetry and - decay.
The lepton asymmetry has also been measured at the LHC in collisions by the ATLAS [24] and CMS [25], [26] Collaborations using data corresponding to 31 pb-1 and 840 pb-1 of integrated luminosity, respectively. One of CMS results is shown in Fig. 14. With 37 pb-1 of integrated luminosity collected with LHCb detector, the lepton charge asymmetry is performed using muon channel [11], as shown in Fig. 15. These measurements provide useful information for future PDF set fitting.


4.3 Weak mixing angle measurements
Weak mixing angle is one of fundamental parameters in the SM. It is one of key input parameters related to the electroweak couples, for both charge current () and neutrino current (). The weak mixing angle is a running parameter in a wide region of center-of-energy, there are many measurements have been done at the low energy experiments, like atomic parity violation [27], Milloer scattering [28], and NuTeV [29]. In the peak region, the most precision measurements are from LEP quark asymmetries, and SLD Left-Right hand asymmetries () [30]. The results from LEP and SLD are deviated by three standard deviations in different directions.
Recently at the hadronic collider, CDF [31], D0 [32, 33], and CMS [34, 35] have been performed this measurement, which show reasonable agreement with world average value. Due to the limitations from PDFs and quark fragments, the dominated systematic uncertainty comes from PDFs, which can be possibly suppressed by the update of PDFs sets.
With data corresponding to 2 fb-1 of integrated luminosity, CDF performed a measurement of weak mixing angle [36] using events. Using data corresponding to 4.8 fb-1 of integrated luminosity, ATLAS presented a measurement of weak mixing angle [37], after combining both electron and muon channels, the measured value at ATLAS is . The summary for weak mixing angle measurement from different experiments is shown in Fig. 16. The PDF uncertainty is the key element for this measurement at hadron colliders, with more data and new PDF set, the precision of weak mixing angle from hadron collider may be comparable to that from LEP.
5 Summary
Precision measurements with single and bosons events provide stringent tests on the SM. With the data collected from the LHC and Tevatron, good consistency between SM and data is observed, these measurements also provide more information for PDF fitting, critical tests on the high order predictions, and more precisely SM input parameters. With good understanding on the detector response, more precision electroweak results with larger data set will come out soon from both LHC and Tevatron.
6 References
References
- [1] ATLAS Collab. (G. Aad et al.), JINST 3, S08003 (2008).
- [2] CMS Collab. (S. Chatrchyan et al.), JINST 3, S08004 (2008).
- [3] LHCb Collab. (A. A. Alves Jr. et al.), JINST 3, S08005 (2008).
- [4] CDF Collab. (A. Abulencia et al.), J. Phys. G, 34, 2457 (2007).
- [5] D0 Collab. (V. M. Abazov et al.), Nucl. Instrum. Meth. Phys. Res. A 565, 463 (2006).
- [6] ATLAS Collab. (G. Aad et al.), Phys. Rev. D 85, 072004 (2012).
- [7] CMS Collab., (S. Chatrchyan et al.), J. High Energy Phys. 007, 1110 (2011).
- [8] CMS Collab., (S. Chatrchyan et al.), CMS-PAS-SMP-12-011.
- [9] ATLAS Collab. (G. Aad et al.), Phys. Lett. B 725, 223-242 (2013).
- [10] CMS Collab., (S. Chatrchyan et al.), CERN-PH-EP-2013-168.
- [11] LHCb Collab., (R. Aaij et al.) J. High Energy Phys. 1206 058 (2012).
- [12] LHCb Collab., (R. Aaij et al.) J. High Energy Phys. 1302 106 (2013).
- [13] LHCb Collab., (R. Aaij et al.) J. High Energy Phys. 1301 111 (2013).
- [14] LHCb Collab., (R. Aaij et al.) LHCb-CONF-2012-013.
- [15] D0 Collab., (V. M. Abazov et al.), Phys. Lett. B 693 522 (2010).
- [16] CDF Collab., (T. Aaltonen et al.), Phys. Rev. D 86 052010 (2012).
- [17] CMS Collab., (S. Chatrchyan et al.), CMS-PAS-SMP-12-025.
- [18] D0 Collab., (V. Abazov et al.), Phys. Rev. Lett. 106 122001 (2011).
- [19] A. Banfi, S. Redford, M. Vesterinen, P. Waller, and T. R. Wyatt, Eur. Phys. J. C 71, 3 (2011).
- [20] ATLAS Collab., (G. Aad et al.) Phys. Lett. B 720 32-51 (2013).
- [21] CDF Collab., (T. Aaltonen et al.) Phys. Rev. D 108 151803 (2012).
- [22] D0 Collab., (V. M. Abazov et al.) Phys. Rev. Lett. 108 151804 (2012).
- [23] CDF and D0 Collab., (T. Aaltonen et al.) Phys. Rev. D 88 052018 (2013).
- [24] ATLAS Collab., (G. Aad et al.), Phys. Rev. D85 072004 (2012).
- [25] CMS Collab., (S. Chatrchyan et al.), Phys. Rev. Lett.109 111806 (2012).
- [26] CMS Collab., (S. Chatrchyan et al.), Eur. Phys. J.C73 2318 (2013).
- [27] S. C. Bennett and C. E. Wieman, Phys. Rev. Lett. 82, 2484 (1999).
- [28] SLAC E158 Collaboration (P. L. Anthony et al.), Phys. Rev. Lett. 95, 081601 (2005).
- [29] NuTeV Collaboration (G. P. Zeller et al. ), Phys. Rev. Lett. 88, 091802 (2002) [Erratum-ibid. 90, 239902(2003)].
- [30] LEP Collaborations ALEPH, DEL-PHI, L3 and OPAL; SLD Collaboration, LEP Elec-troweak Working Group, SLD Electroweak and Heavy Flavor Groups (G. Abbiendi et al.), Phys. Rep. 427, 257 (2006).
- [31] CDF Collaboration (D. Acosta et al.), Phys. Rev. D 71, 052002 (2005).
- [32] D0 Collaboration (V. M. Abazov et al.), Phys. Rev. Lett. 101, 191801 (2008).
- [33] D0 Collaboration (V. M. Abazov et al.), Phys. Rev. D 84, 012007 (2011).
- [34] CMS Collaboration (S. Chatrchyan et al.), Phys. Rev. D 84, 112002 (2011).
- [35] CMS Collaboration (S. Chatrchyan et al.), Phys. Lett. B 718, 752 (2013).
- [36] CDF Collab., (T. Aaltonen et al.), Phys. Rev. D 88 072002 (2013).
- [37] ATLAS Collab., (G. Aad et al.), ATLAS-CONF-2013-043.