Gamma-ray fluxes from the core emission of Centaurus A: A puzzle solved
Abstract
A high-energy component in the radio galaxy Centaurus A was reported after analyzing four years of Fermi data. The spectrum of this component is described by means of a broken power law with a break energy of 4 GeV and, below and above spectral indices of =2.740.03 and =2.090.20, respectively. Also a faint -ray flux at TeV energies was detected by H.E.S.S.. In this paper we show that the spectrum at GeV-TeV energies is described through synchrotron self-Compton emission up to a few GeV ( 4 GeV) and decay products up to TeV energies, although the emission of synchrotron radiation by muons could contribute to the spectrum at GeV energies, if they are rapidly accelerated. Muons and s are generated in the interactions of accelerated protons with two populations of seed photons which were reported by Compton Gamma-Ray Observatory: one population at intermediate state emission with energy peak of 0.15 MeV and another at low state emission with energy peak of 0.59 MeV. In addition, we show that the reported observations of ultra-high-energy cosmic rays and non high-energy neutrino detection around Centaurus A can be explained through these interactions, assuming that proton spectrum is extended up to ultra-high-energies.
Keywords:
Galaxies: active – Galaxies: individual (Centaurus A) – Physical data and processes: acceleration of particles — Physical data and processes: radiation mechanism: nonthermal1 Introduction
Centaurus A (Cen A) is classified as Fanaroff Riley Class I (Fanaroff &
Riley, 1974) active galactic nucleus (AGN). At a distance of D Mpc, it has been one of the best studied extragalactic sources, characterized by having an off-axis jet of viewing angle which is estimated as (see, e.g. Horiuchi et al., 2006, and reference therein) and two giant radio lobes of hundreds of kiloparsec. Close to the core, this source has been imaged in radio, infrared, optical (Winkler &
White, 1975; Mushotzky et al., 1976; Bowyer et al., 1970; Baity &
et al., 1981), X-ray and -rays (MeV-TeV) (Hardcastle et al., 2003; Sreekumar et al., 1999; Aharonian &
et al., 2009; Abdo &
et al., 2010; Reynoso
et al., 2011). Particularly, in the range of MeV - TeV energies, Cen A has been observed by Compton Gamma-Ray Observatory (CGRO) mission, Fermi Gamma-Ray Space Telescope and High Energy Stereoscopic System (H.E.S.S.) experiment. Observations from OSSE, COMPTEL and EGRET, all of them instruments of Compton Gamma-Ray Observatory (CGRO), imaged Cen A from 1991 to 1995 in two states (intermediate and low). The intermediate state exhibited its brightest peak at MeV with a flux of MeV/cm2/s and luminosity of 5 erg/s whereas the low one showed it at MeV with a flux of MeV/cm2/s and luminosity of 3 erg/s (Steinle et al., 1998). Also, for a period of 10 months, Cen A was monitored by the Large Area Telescope (LAT) on board the Fermi. The -ray flux collected was described by a power law with a photon index of 2.67 (Abdo &
et al., 2010). For more than 120 hr, Cen A was also observed by H.E.S.S. (Aharonian &
et al., 2005; Aharonian &
et al., 2009). The spectrum was described by a power law with a spectral index of 2.7 and an integral flux of erg s-1 above an energy threshold of 250 GeV. Recently, Sahakyan et al. (2013) reported a new high-energy (HE) component in the spectrum of Cen A as a result of analyzing four consecutive years of Fermi-LAT data. The spectrum of this component was described using a broken power law with a break energy at 4 GeV and spectral indices of =2.740.03 (below) and =2.090.20 (above). It has to be highlighted that although the spectral energy distribution (SED) has been successfully described up to GeV energy range by means of synchrotron self-Compton (SSC) emission, there is still controversy about the emission processes that could contribute to spectrum at GeV-TeV energies such us one-zone SSC model (Abdo &
et al., 2010), photo-disintegration of heavy nuclei (Kundu &
Gupta, 2013) and photo-hadronic processes (Fraija et al., 2012; Sahu
et al., 2012; Petropoulou et al., 2014). On the other hand, Pierre Auger Observatory (PAO) associated some ultra-high-energy cosmic rays with the direction of Centaurus A (UHECRs) (Pierre Auger Collaboration & et al., 2007; Pierre Auger Collaboration & et al., 2008) and IceCube reported 28 neutrino-induced events in a TeV - PeV energy range, although none of them related with this direction (IceCube Collaboration et al., 2013a; IceCube Collaboration et al., 2013b).
In this work, we describe a hadronic model through the proton-photon (p) interactions to describe the -ray spectrum from the core emission of Cen A at the GeV - TeV energy range. Based on the p interactions and taking into account the seed photons at two emission states (intermediate and low), we present the synchrotron radiation by muons and decay products. We use the muon synchrotron emission to fit the spectrum up to 126 GeV and decay products up to a few TeV. Finally, correlating the produced -ray fluxes for both states with UHECR and neutrino fluxes, we estimate the number of expected events in PAO and IceCube, respectively. We have assumed that the proton spectrum is extended through a simple power law up to ultra-high-energies. We hereafter use k==c=1 in natural units and z.
2 P interactions
Relativistic protons are accelerated and cooled down by p interactions at the emission region in the jet. The single-pion production channels are
where , and are neutron, charged and neutral pions, respectively. Two important quantities that define the efficiency of this process are the photon density and the optical depth which are given by
| (5) |
and
| (6) |
here is the comoving dissipation radius which is limited by the variability time scale , is the cross section for the production of the delta-resonance in proton-photon interactions, is the observed luminosity, is the break energy of observed photons and is the Doppler factor with the observing angle along the line of sight and 1. Also we define the optical thickness to pair creation as (Peterson, 1997)
| (7) |
with me the electron mass. Here we have taken into account that the cross-section for pair production reaches a maximum value close to the Thomson cross section .
2.1 Muon synchrotron radiation
As known from p interactions, charged pions and then muons, positrons and neutrinos, are produced. Before muons in a magnetic field of the order of Gauss decay, they could be rapidly accelerated for a short period of time, radiate photons by synchrotron emission and contribute to the flux at GeV energies (Rachen & Mészáros, 1998; Aharonian, 2000; Mannheim, 1993; Abdo et al., 2011). It is useful and convenient to define the observed photon energies radiated by muons as a function of electron energies. From the comoving photon energy radiated by muons, , the relationship between electron and muon Lorentz factors , the cooling time characteristic for this process, and the maximum acceleration time scale, , we can write the break and maximum photon energies as
| (8) | |||||
| (9) |
Here mμ is the muon mass, is the elementary charge, and are the magnetic field and muon energy in comoving frame, respectively. Supposing that accelerated muons with energies are well described by a broken power-law : for and for , then the observed synchrotron spectrum can be written as (Longair, 1994; Hardcastle et al., 2001; Hardcastle & Croston, 2011)
| (10) | |||
| (11) |
with
| (12) |
where is the total number of radiating muons in the and is the maximum radiation power. Hence, the muon density can be written as
| (13) |
The previous equation gives the information on the muon density as a function of magnetic field.
2.2 decay products
Neutral pion decays into photons, , and typically carries of the proton’s energy . As has been pointed out by Fraija et al. (2012) and Waxman & Bahcall (1997), its spectrum can be derived from the spectral characteristics of the accelerated protons where is the proton proportionally constant and the spectral index, target photons (), and the time scales involved in this interaction (the dynamical () and pion () cooling time scale). The energy loss rate due to pion production (pion cooling time) can be written as
| (14) |
where is the proton Lorentz factor, cm2 is the cross section of pion production in the =0.2 GeV at 0.3 GeV. Comparing the pion cooling and the dynamical time scales (),
| (15) | |||
| (16) |
and taking into account that photons released in the range to by protons in the range and are , then photo-pion spectrum can written as
| (17) | |||
| (18) |
with the normalization energy , proportionality constant given by
| (19) |
and the break photon-pion energy given by
| (20) |
where , and are the pion, resonance and proton masses. Eq. 17 describes the contribution of photo-pion emission to the SED. Similarly, the proton luminosity, , at the break photo-pion energy, , can be written as
| (22) | |||||
where is given by eq. 19.
3 High-Energy Neutrinos
The neutrino flux, dN, is correlated with the photon-pion spectrum by (see, e.g. Halzen, 2007, and reference therein)
| (23) |
Assuming that the spectral indices for neutrino and photo-pion spectrum are similar (Becker, 2008), taking into account that each neutrino carries 5% of the proton energies () (Halzen, 2013) and from eq. 17, we can write the relationship between HE neutrino and photon normalization factors as
| (24) |
with Ap,γ given by Eq. (19). We could estimate the number of events expected per time unit (T) through
| (25) |
where Eth is the threshold energy, cm is the charged current cross section (Gandhi et al., 1998), 0.9 g cm-3 is the density of the ice, NA= 6.022 1023 g-1 and Veff is the effective volume. If we assume that the neutrino spectrum extends continually over the whole energy range (Cuoco & Hannestad, 2008), then the expected number of neutrinos can be written as
| (26) |
with Aν given by eq. 24.
4 UHE cosmic rays
At least two events with energies larger than 60 EeV were reported and studied by PAO inside a circle centered at Cen A (Pierre Auger Collaboration & et al., 2007; Pierre Auger Collaboration & et al., 2008). The study of the shower composition found that the distribution of their properties was situated in somewhere between pure p and pure Fe at 57 EeV(Yamamoto, 2008; Pierre Auger Collaboration & et al., 2008; Unger et al., 2007), although HiRes data were consistent with a dominant proton composition at these energies (Unger et al., 2007).
The maximum energy achieved in the comoving frame for a particle in the acceleration phase depends on the size () and the strength of the magnetic field () where it is confined, (Hillas, 1984). Additional limitations are mainly due to radiative losses or available time when particles diffuse through the magnetized region.
A short distance () from the black hole (BH), the region of particle acceleration is limited by comoving dissipation radius though the variability time scale, hence the maximum energy required is (Abdo &
et al., 2010; Sahu
et al., 2012)
| (27) |
where we have used in c.g.s. units. As can be seen in this small region there can not be accelerated protons up to the PAO energy range. However, Dermer et al. (2009) proposed that during flaring intervals for which the apparent isotropic luminosity can reach erg s-1 and supposing that the black hole (BH) jet has the power to accelerate particles up to ultra-high energies through Fermi processes, the maximum particle energy of accelerated UHECRs reached is
| (28) |
where , is the acceleration efficiency factor and Z is the atomic number and comes from a equipartition magnetic field.
On the other hand, Hardcastle et al. (2006); Hardcastle &
et al. (2007); Hardcastle et al. (2009) and Kraft
et al. (2009) have argued that lobes are inflated by jets in the surrounding medium, hence accelerated protons are injected into and confined within the lobes, by means of resonant Fermi-type processes, allowing that these can be re-accelerated at a distance of hundreds of kiloparsecs from the BH. Recently, Fraija (2013) showed that protons can be accelerated inside the lobes up to energies as high as eV only limited by the radius rd=100 kpc (volume of ) and the magnetic field of 3.41 G and 6.19 G for the north and south lobe, respectively. Similarly, Wykes et al. (2013) has argued that particles in the lobes can have acceleration stochastically by high temperatures, what would allow to reach energies as high as 1020 eV.
With the mechanisms of UHECR acceleration presented above and from the correlation between the proton and -ray spectrum at GeV-TeV energies (eq. 19), we propose that the spectrum of accelerated protons is extended up to eV and also that the number of these events can reach Earth. Hence, the number of UHECRs collected with PAO is calculated by means of , where the relative exposure from 1 January 2004 until 31 August 2007 is and N is the amount of protons at the source. Hence, from eq. (19) the number of UHECRs is
| (29) | |||
| (30) |
where EeV is the threshold energy of PAO.
5 Analysis and Results
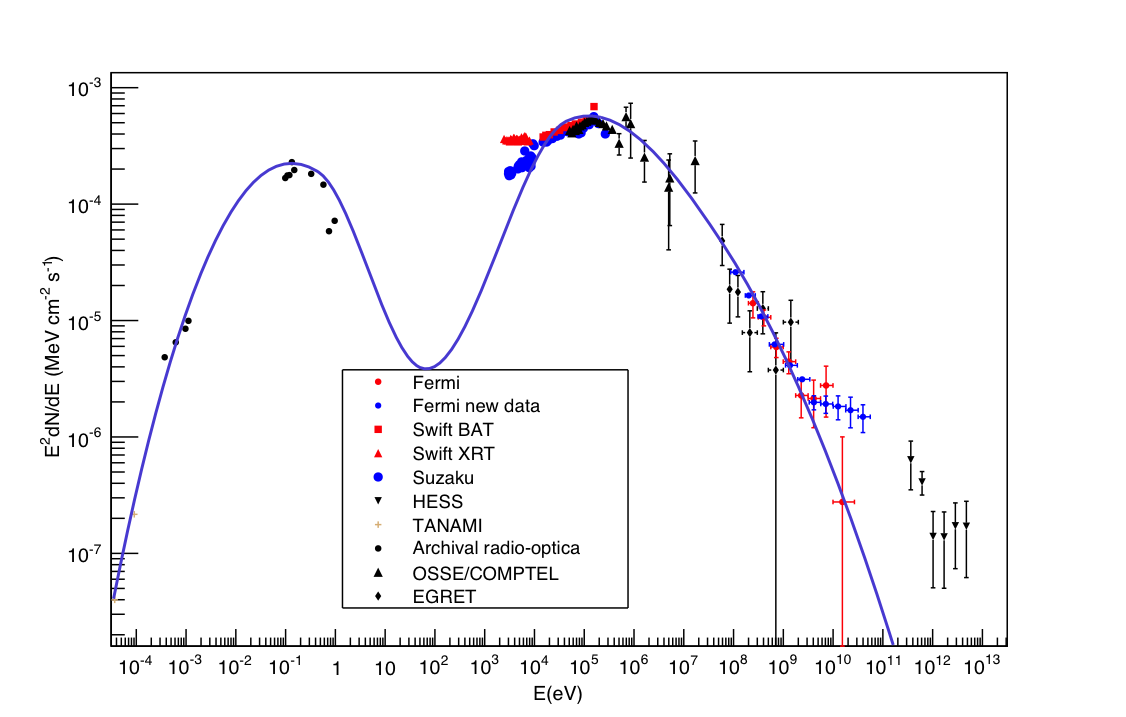
Recently, Fraija et al. (2012) presented a leptonic model based on SSC emission, thereby achieving to describe successfully the two prominent humps in the spectrum of Cen A. Then, for this analysis our first approach is to use this leptonic model and include the new Fermi data into the whole spectrum in the representation, as shown in figure 1. In this figure can be seen that SSC model can only give account of the new Fermi-LAT data below the break energy at 4 GeV and not above it. Hence, we will study the spectrum at higher energies than 4 GeV, including the H.E.S.S. data. We hereafter use the values , , and 0.5 G 10 G which are the ones reported by Abdo &
et al. (2010), Fraija et al. (2012) and Petropoulou et al. (2014).
To interpret the -ray spectrum at higher energies than 4 GeV, we have introduced a hadronic model through the p interactions and based on the fact that these interactions produce as secondary particles muons and photo-pions, we have developed a model based on synchrotron emission by radiating muons and decay products. In the synchrotron emission, assuming that the muon spectrum is described by a broken power law, we have derived the synchrotron spectrum (eq. 10). Additionally, we have calculated the time scale characteristics and the observed photon energies for this emission process. For our convenience, we have written the observed photon energies radiate by muons as function of those emitted by electrons (eq. 8). Thus, considering that the first broad hump was described by electron synchrotron radiation at eV, then from eq. (8), the break energy of synchrotron radiation from short-lived muons would be GeV which explains the value of break energy reported by Sahakyan et al. (2013) and similarly, by taking into account the maximum photon energy by radiating electron MeV (Fraija et al., 2012), then the maximum energy radiated for this process would be GeV. With the values of the break photon energies we use the method of Chi-square () minimization (Brun &
Rademakers, 1997) to adjust Fermi data (above 3.77 GeV) with the observed synchrotron spectrum derived in eq. 10. In this spectrum we introduce the parameters [0] and [1] to obtain the best fit of the proportionality constant () and power index (), respectively, as shown in eq. (31)
| (31) | |||
| (32) |
We show in table 1 the best set of parameters for muon synchrotron radiation and also we plot the synchrotron spectrum with the fitted parameters, as shown in fig. 2 (right-hand figure above).
| Parameter | Symbol | Value | |
|---|---|---|---|
| Proportionality constant () | [0] | ||
| Spectral index | [1] | 2.229 0.0284 | |
| Chi-square/NDF |
Table 1. The best fit of muon synchrotron radiation parameters obtained after fitting the new Fermi data.
Comparing the spectral indices; the fitted value () given in table 1 and that reported () by Sahakyan et al. (2013), one finds that the value obtained from the fit = 2.114 0.0142 is consistent with that reported =2.090.20. Moreover, from the best fit value of proportionally constant , we plot the muon density as a function of magnetic field, as shown in fig. 2 (left-hand figure below). From this figure can be seen that for a value reported in literature of magnetic field in the range 0.5 G 10 G, the muon density range lies in (Abdo &
et al., 2010; Fraija et al., 2012; Petropoulou et al., 2014). By considering that muons are rapidly accelerated, then the new Fermi data at the GeV energies can be described by muon synchrotron radiation.
From the decay model we have assumed that these neutral pions are produced in the interaction of accelerated protons in the jet described by a simple power law with two photon populations at the emission region. The spectrum generated by this process (eq. 17) depends on the proton luminosity (through ), photon luminosity, the comoving dissipation radius, the break energy of observed photons, the Doppler factor and parameters of p interaction. To find the best fit of photo-pion model parameters we use once again the method of Chi-square () minimization (Brun &
Rademakers, 1997), as described in eq. 33
| (33) | |||
| (34) |
We will consider as target two photon populations (Steinle et al., 1998): one population at intermediate state emission with energy peak 0.15 MeV and luminosity erg/s and another at low state emission with energy peak 0.59 MeV and luminosity erg/s. As follows, we will analyze each case separately.
Photons at the low state emission. Considering this photon population we calculate that the break photo-pion energy (eq. 20) is 91.3 GeV. As shown in fig. 2 (left-hand figure above) and table 2, we found the values of Ap,γ (parameter [0]) and (parameter [1]) that best describe these data for =10 GeV.
| Parameter | Symbol | Value | |
|---|---|---|---|
| Proportionality constant () | [0] | ||
| Spectral index | [1] | 2.970 0.048 | |
| Chi-square/NDF |
Table 2. The best fit of the spectrum parameters obtained after fitting the new Fermi and H.E.S.S. data.
From the photo-pion spectrum (eq. 17) and the value of spectral index () given in table 2, we compare both power laws, below and above of 91.3 GeV with new Fermi and H.E.S.S. data, respectively. Comparing the power law below , we can see that the obtained spectral index is = 1.970 0.048 which is consistent to that reported (=2.090.20) by Sahakyan et al. (2013) and when we compare the power law above , then the obtained spectral index is = 2.970 0.048 which is also in agreement with the reported value 2.7 by Aharonian &
et al. (2009).
Once again from the fitted values given in table 2 and eqs. (26) and (30), we calculate the number of neutrinos and UHECRs expected on IceCube and PAO, respectively. Assuming a threshold energy of Eth,ν = 30 TeV and two years of observation (IceCube Collaboration et al., 2013a), we obtained that 2.37 events are expected in IceCube, and considering a simple power law extended as high as PAO energy range, we found that 3.93 events are expected on PAO. In addition to the analysis performed, a proton luminosity of 2.2 erg/s is required.
Photons at intermediate state emission. Assuming this photon population, a similar analysis to the previous case will be performed. As has been pointed out, Cen A exhibits two prominent humps, the first one is related with photons at low energies 10-2 eV and the second one to those at high energies 150 keV. In this case we assume that accelerated protons interact with photons of around 150 keV which have a photon density (eq. 5) of 5.52 107 cm-3 and an optical depth (eq. 6) of 2.76 10-3. Then, from eq. (20), the break photo-pion energy is 359.11 GeV. As shown in fig. 2 (right-hand figure below) and table 3, we found the values of Ap,γ (parameter [0]) and (parameter [1]) that best describes these data for =1 TeV.
| Parameter | Symbol | Value | |
|---|---|---|---|
| Proportionality constant () | [0] | ||
| Spectral index | [1] | 2.811 0.378 | |
| Chi-square/NDF |
Table 3. The best fit of the set of p interaction parameters obtained after fitting the TeV spectrum.
As shown in table 3, the fitted value of the spectral index () and the reported one by H.E.S.S. (Aharonian &
et al., 2009) 2.7 are in agreement. Also from this plot (right-hand figure below) can be seen that the data value at energy of GeV fits nicely to the photo-pion emission. In a like manner, from the values of table 3 and eqs. (26) and (30), we estimate that the number of neutrinos and UHECRs expected are 0.82 and 10.44 events on IceCube and PAO, respectively. Again we have assumed that the proton power law is extended up to PAO energy range. For this case, a proton luminosity of 2.03 erg/s is required.
In addition to the SSC leptonic model (Fraija et al., 2012) and taking into account the p interactions with both photon populations as targets, we plot the whole SED of Cen A using our leptonic and hadronic model, as shown in fig. 3. In the figure above we use seed photons at low state emission and in figure below the intermediate state emission was taken into account. From both figures we can see that unlike emission of decay products which is asked for when regarding both photon populations, a muon synchrotron radiation is required when we consider photons at intermediate state emission but not when considering photons at low state emission in order to explain successfully the spectrum at GeV - TeV energy range.
Finally, analyzing both contributions of decay products at the same time (intermediate and slow state emission as seed photons) and regarding with = 91.3 GeV and = 359.11 GeV, the photo-pion spectrum (eq. 17) would have a small change; a power law would be added to the spectrum for whereas the first and the last power laws can be approximated to same ones (eq. 17); for and for , where we have assumed that the contribution of both interactions to the spectrum are similar. As a result, the fitted values are not much pretty different from those given in table 2, then we would expect small changes in the values of the proton proportionality constant and spectral index, and thus in the numbers of UHECRs and neutrinos in comparison with those values obtained when considering the low state emission as photon population in the p interactions.
6 Summary and conclusions
We have proposed a leptonic and hadronic model to explain the -ray spectrum at GeV - TeV energy range. In the leptonic model, we have applied the SSC emission described by Fraija et al. (2012) and have showed that SSC emission only gives account of photons with energies of less than 4 GeV. To explain the spectrum at higher energies than 4 GeV, we have introduced the hadronic model, assuming that accelerated protons in the jet interact with two photon population; at intermediate and low state emission. Based on these p interactions, we have developed synchrotron radiation by muons and decay products. Considering the photon population at low state emission, we found that both Fermi and H.E.S.S. data are well described by means of photo-pion spectrum (eq. 17) with break energy of 91.3 GeV and proton luminosity of 2.2 erg/s. In this case, the contribution of synchrotron radiation to the -ray spectrum is not required, so both new Fermi and H.E.S.S. data are described by decay products. Additionally, we have estimated that the numbers of UHECRs and neutrinos are 3.93 and 2.37 , respectively. On the other hand, assuming the photon population with intermediate state, H.E.S.S. and Fermi data are described separately; new Fermi data with muon synchrotron radiation and H.E.S.S. data with decay products. From this emission, we found the values of break energy of 359.11 GeV and proton luminosity of 2.03 erg/s. Additionally, extending the proton and neutrino spectrum again up to UHE, we estimate that the number of UHECRs is 10.44 and that of neutrinos 0.82 . It has to be added that although muons radiate at GeV energy range by synchrotron emission, if muons do not radiate rapidly, this process would not be effective, then decay products originated from low emission state would describe the whole spectrum at GeV - TeV energy range.
On the other hand, we have showed that extrapolating the proton spectrum by a simple power law up to 1020 eV, the number of UHECRs expected is closer when considering the low (3.93) than intermediate (10.44) state emission. Although UHECRs can hardly be accelerated up to the PAO energy range at the emission region (Emax= 40 EeV) (Abdo &
et al., 2010), they could be accelerated during the flaring intervals and/or in the giant lobes. It is very interesting the idea that UHECRs could be accelerated partially in the jet at energies ( eV) and partially in the Lobes at ( eV).
In summary, we have showed that hybrid leptonic SSC and hadronic processes are required to explain the -fluxes at GeV- TeV energy range. We have successfully described the spectral indices, break energies and fluxes, and also the expected number of UHECRs and neutrinos (Aharonian &
et al., 2009; Sahakyan et al., 2013; Pierre Auger Collaboration & et al., 2008; IceCube Collaboration et al., 2013a).
Acknowledgements
We thank to Bing Zhang, Francis Halzen and William Lee for useful discussions. This work was supported by Luc Binette scholarship and the projects IG100414 and Conacyt 101958.
References
- Abdo et al. (2011) Abdo A. A., Ackermann M., Ajello M., Baldini L., Ballet J., Barbiellini G., Bastieri D., Bechtol K., Bellazzini R., Berenji B., et al. 2011, ApJ, 736, 131
- Abdo & et al. (2010) Abdo A. A., et al. 2010, ApJ, 719, 1433
- Aharonian & et al. (2005) Aharonian F., et al. 2005, A&A, 441, 465
- Aharonian & et al. (2009) Aharonian F., et al. 2009, ApJ, 695, L40
- Aharonian (2000) Aharonian F. A., 2000, New A, 5, 377
- Baity & et al. (1981) Baity W. A., et al. 1981, ApJ, 244, 429
- Becker (2008) Becker J. K., 2008, Phys. Rep., 458, 173
- Bowyer et al. (1970) Bowyer C. S., Lampton M., Mack J., de Mendonca F., 1970, ApJ, 161, L1
- Brun & Rademakers (1997) Brun R., Rademakers F., 1997, Nuclear Instruments and Methods in Physics Research A, 389, 81
- Cuoco & Hannestad (2008) Cuoco A., Hannestad S., 2008, Phys. Rev. D, 78, 023007
- Dermer et al. (2009) Dermer C. D., Razzaque S., Finke J. D., Atoyan A., 2009, New Journal of Physics, 11, 065016
- Fanaroff & Riley (1974) Fanaroff B. L., Riley J. M., 1974, MNRAS, 167, 31P
- Fraija (2013) Fraija N., 2013, ArXiv e-prints
- Fraija et al. (2012) Fraija N., González M. M., Perez M., Marinelli A., 2012, ApJ, 753, 40
- Gandhi et al. (1998) Gandhi R., Quigg C., Reno M. H., Sarcevic I., 1998, Phys. Rev. D, 58, 093009
- Halzen (2007) Halzen F., 2007, Ap&SS, 309, 407
- Halzen (2013) Halzen F., 2013, Riv.Nuovo Cim., 036, 81
- Hardcastle et al. (2001) Hardcastle M. J., Birkinshaw M., Worrall D. M., 2001, MNRAS, 326, 1499
- Hardcastle et al. (2009) Hardcastle M. J., Cheung C. C., Feain I. J., Stawarz Ł., 2009, MNRAS, 393, 1041
- Hardcastle & Croston (2011) Hardcastle M. J., Croston J. H., 2011, MNRAS, 415, 133
- Hardcastle & et al. (2007) Hardcastle M. J., et al. 2007, ApJ, 670, L81
- Hardcastle et al. (2006) Hardcastle M. J., Kraft R. P., Worrall D. M., 2006, MNRAS, 368, L15
- Hardcastle et al. (2003) Hardcastle M. J., Worrall D. M., Kraft R. P., Forman W. R., Jones C., Murray S. S., 2003, ApJ, 593, 169
- Hillas (1984) Hillas A. M., 1984, ARA&A, 22, 425
- Horiuchi et al. (2006) Horiuchi S., Meier D. L., Preston R. A., Tingay S. J., 2006, PASJ, 58, 211
- IceCube Collaboration et al. (2013a) IceCube Collaboration Aartsen M. G., Abbasi R., Abdou Y., Ackermann M., Adams J., Aguilar J. A., Ahlers M., Altmann D., Auffenberg J., et al. 2013a, ArXiv e-prints
- IceCube Collaboration et al. (2013b) IceCube Collaboration Aartsen M. G., Abbasi R., Abdou Y., Ackermann M., Adams J., Aguilar J. A., Ahlers M., Altmann D., Auffenberg J., et al. 2013b, ArXiv e-prints
- Kraft et al. (2009) Kraft R. P., Forman W. R., Hardcastle M. J., Birkinshaw M., Croston J. H., Jones C., Nulsen P. E. J., Worrall D. M., Murray S. S., 2009, ApJ, 698, 2036
- Kundu & Gupta (2013) Kundu E., Gupta N., 2013, ArXiv e-prints
- Longair (1994) Longair M. S., 1994, High energy astrophysics. Volume 2. Stars, the Galaxy and the interstellar medium.
- Mannheim (1993) Mannheim K., 1993, A&A, 269, 67
- Mushotzky et al. (1976) Mushotzky R. F., Baity W. A., Wheaton W. A., Peterson L. E., 1976, ApJ, 206, L45
- Peterson (1997) Peterson B. M., 1997, An Introduction to Active Galactic Nuclei
- Petropoulou et al. (2014) Petropoulou M., Lefa E., Dimitrakoudis S., Mastichiadis A., 2014, A&A, 562, A12
- Pierre Auger Collaboration & et al. (2007) Pierre Auger Collaboration et al. 2007, Science, 318, 938
- Pierre Auger Collaboration & et al. (2008) Pierre Auger Collaboration et al. 2008, Astroparticle Physics, 29, 188
- Rachen & Mészáros (1998) Rachen J. P., Mészáros P., 1998, Phys. Rev. D, 58, 123005
- Reynoso et al. (2011) Reynoso M. M., Medina M. C., Romero G. E., 2011, A&A, 531, A30
- Sahakyan et al. (2013) Sahakyan N., Yang R., Aharonian F. A., Rieger F. M., 2013, ApJ, 770, L6
- Sahu et al. (2012) Sahu S., Zhang B., Fraija N., 2012, Phys. Rev. D, 85, 043012
- Sreekumar et al. (1999) Sreekumar P., Bertsch D. L., Hartman R. C., Nolan P. L., Thompson D. J., 1999, Astroparticle Physics, 11, 221
- Steinle et al. (1998) Steinle H., Bennett K., Bloemen H., Collmar W., Diehl R., Hermsen W., Lichti G. G., Morris D., Schonfelder V., Strong A. W., Williams O. R., 1998, A&A, 330, 97
- Unger et al. (2007) Unger M., Engel R., Schüssler F., Ulrich R., Pierre Auger Collaboration 2007, Astronomische Nachrichten, 328, 614
- Waxman & Bahcall (1997) Waxman E., Bahcall J., 1997, Phys. Rev. Lett., 78, 2292
- Winkler & White (1975) Winkler Jr. P. F., White A. E., 1975, ApJ, 199, L139
- Wykes et al. (2013) Wykes S., Croston J. H., Hardcastle M. J., Eilek J. A., Biermann P. L., Achterberg A., Bray J. D., Lazarian A., Haverkorn M., Protheroe R. J., Bromberg O., 2013, A&A, 558, A19
- Yamamoto (2008) Yamamoto T., 2008, in International Cosmic Ray Conference Vol. 4 of International Cosmic Ray Conference, The UHECR spectrum measured at the Pierre Auger Observatory and its astrophysical implications. pp 335–338