Cross section ratio and angular distributions of the reaction at and excess energy
Abstract
We present new data for angular distributions and on the cross section ratio of the reaction at excess energies of and . The data have been obtained at the WASA-at-COSY experiment (Forschungszentrum Jülich) using a proton beam and a deuterium pellet target. While the shape of obtained angular distributions show only a slow variation with the energy, the new results indicate a distinct and unexpected total cross section fluctuation between and , which might indicate the variation of the production mechanism within this energy interval.
pacs
13.60.LeMeson production and 14.40.BeLight mesons (S=C=B=0) and 25.10.+sNuclear reactions involving few-nucleon systems and 25.40.VeOther reactions above meson production thresholds1 Introduction
While the very near-threshold region of the reaction is well covered by a broad data set [1, 2, 3, 4, 5], at higher excess energies only a limited amount of data is available. In more detail, the total cross section values from ANKE and WASA/PROMICE [6, 7, 8] expose a plateau in the excitation function at excess energies between and with the exception of one single data point of the GEM experiment at [9]. Although still consistent with this cross section plateau shown by the neighboring data when considering the statistical and systematic uncertainties, this data point might be a hint for an increase of the cross section at this energy. Moreover, calculations available in the literature [10], based on either a one-step or two-step model, fail to explain in parallel the forward peaked angular distributions and the total cross section of this reaction channel. In order to better understand the underlying production processes and the strong final-state interaction it was proposed to perform new calculations based on a boson exchange model for which new high-quality data at intermediate excess energies are required [10].
Therefore, angular distributions have been obtained using the WASA-at-COSY installation for the reaction at excess energies of and . Furthermore, using the reaction the cross section ratio for the meson production has been determined.
2 Experiment and Data Analysis
The experiment was conducted at the COSY storage ring of the Forschungszentrum Jülich, using the WASA-at-COSY experimental setup [11]. Protons with beam energies of () and (), respectively, were scattered on a deuterium pellet target [12] and the produced nuclei were stopped and detected in the Forward Detector. The selection of these nuclei is presented in fig. 1, showing the energy loss in the first layer of the Forward Trigger Hodoscope (FTH1) against the energy loss in the first layer of the Forward Range Hodoscope (FRH1). The black solid line presents the selection cut to suppress other ejectiles such as protons, deuterons and pions [13]. By this cut much less than one percent of nuclei are rejected and, in addition, this factor cancels out in the following determination of the total cross section ratio. As expected the energy loss in the thin FTH1 detector decreases with increasing energy detected in the first layer of the FRH. The kink at a FRH1 energy of 0.25 GeV is due to the fact that nuclei with higher energies are no longer stopped in the first FRH layer but enter the second one. However, for the reaction of interest only events stopped in the FRH1 layer are of relevance.

The four-momentum vector of the ions is reconstructed by their total kinetic energy measured in the forward detector as well as their azimuthal and polar scattering angles in the laboratory system. The reaction is identified by the missing-mass method. The number of - events was extracted for individual polar angles to determine angular distributions. Since, for simple kinematic reasons, for this two-body reaction the particle momenta are directly correlated with the polar angle in the laboratory system, the energy calibration of the forward detector could be performed with high accuracy. In detail, the polar angle is reconstructed with an uncertainty of , corresponding to, e.g., a momentum resolution of at a laboratory angle of . The laboratory momenta reconstructed from the measured scattering angle have been used for a careful calibration of the forward detector. Figure 2 shows a corresponding scatter plot for identified nuclei at . The clear accumulation of events originates from the reaction for which the theoretical expectation assuming infinite resolution is presented by the solid line.

For both excess energies the full center-of-mass angular range is divided into 25 equally spaced bins for which the missing-mass distribution was determined. The resulting spectra were then fitted by a Monte Carlo cocktail in the missing mass range –, considering both the meson production and all energetically allowed multi-pion production channels. Figure 3 (a) shows the missing-mass spectrum for the full angular range of the data set, while figs. 3 (b) and (c) show the missing-mass spectra for and , respectively. For the final analysis this fit was performed for each individual angular bin. Uniform phase space distributions were assumed for modeling the missing-mass distributions and the magnitudes of each multi-pion reaction contribution were treated as free parameters for each angular bin. Whereas the four-pion production was found to be of minor relevance, the two- and three-pion production channels contribute dominantly to the background description. Although the ABC effect [14] is known to strongly influence the shape of the two-pion production background, a very good background description could be achieved. Nevertheless the presence of the ABC effect prevents from the direct extraction of the relative ratios. It should be noted that for angular bins which correspond to the very forward and backward region the background was fitted by polynomial fits which resulted in a slightly better description. For better visualization the background channels with the same number of pions but different charges are merged in this figure, although every channel was considered separately for the fit. Figures 3(a), (b), and (c) show that by this method the (multi-pionic) background can be described well in the vicinity of the mass peak.

Figure 4 shows the total missing-mass spectrum with a resolution of (RMS) after background subtraction. The number of events is extracted by considering a interval. In total () events were selected for the measurement at .

The acceptance of the rotational symmetric forward detector for nuclei of the reaction was determined by Monte Carlo simulations as function of the scattering angle (fig. 5). The acceptance varies smoothly in the range of – with the polar angle. Only in the very forward and backward direction a drop of the acceptance is caused by nuclei escaping through the hole for the beam pipe in the detector. Those two bins have been excluded from the following analysis.
To extract angular distributions the measured distributions have to be corrected for the geometrical acceptance of the detection system, for the track reconstruction efficiency as well as for effects caused by the finite momentum resolution. The first two effects are represented for both energies by the solid and dashed lines in fig. 5. An inclusion of the latter effect results in the dotted and dashed dotted lines. The presented correction factors have been determined by an iterative procedure using the extracted angular distributions as input for the Monte Carlo simulations until a conversion was reached.

3 Data normalization
A relative normalization of the measurements at and excess energy is obtained from the simultaneous analysis of the reaction. The acceptance and cross section corrected ratio of the respective yields corresponds to the ratio of the integrated luminosities. For both energies the acceptances were found to be identical within their uncertainties. As for the case, the reaction is identified from the missing mass with respect to the detected in the forward detector. Due to the higher momenta in the production a larger background from protons and deuterons misidentified as is visible. In order to reduce the background, exactly two photons registered in the central detector from the decay are required. In the analysis presented here only the polar angle range is used and divided into three equally sized bins. It should be noted that even when requiring the decay signal the acceptance is above for the chosen angular bins.
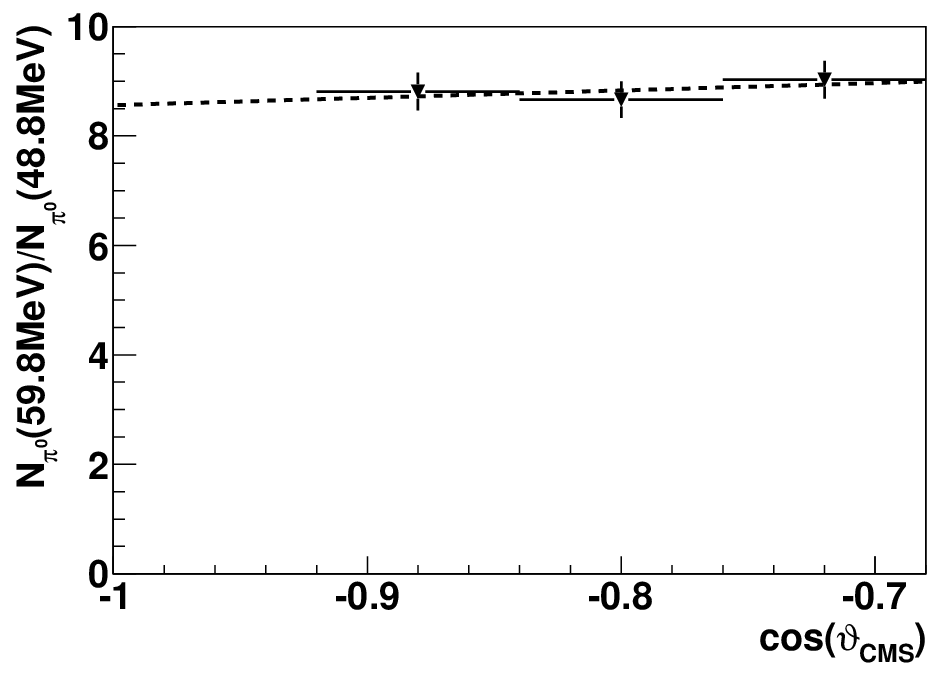

Figure 6 shows the ratio of the yields as function of the polar angle including statistical uncertainties. In order to extract the ratio of the yields at the data was fitted by a linear function. A value of
| (1) |
was determined with an uncertainty which is dominated by the lower statistics of the data. For a relative normalization of the cross sections via the reaction the ratio is needed in addition. Differential cross sections for of the reactions and , scaled by an isospin factor of , from ref. [15] as well as differential cross sections of the reaction from ref. [16] have been fitted by a fifth-order polynomial to extract the required values. Based on this fit shown in fig. 7,
| (2) |
has been obtained. The quoted uncertainty considers both systematic and statistical uncertainties. Using eqs. (1) and (2), the cross section ratio for the meson production is then given by:
| (3) | |||||
Here the numbers correspond to the acceptance corrected meson yields.
4 Results

Figure 8 (a) shows the angular distributions of the emitted meson in the center-of-mass system in arbitrary units including statistical uncertainties, systematic uncertainties due to the fitting of the missing-mass spectra as well as the systematic uncertainties introduced by the absolute COSY beam momentum precision of [17]. The values for the angular distributions are presented in table 1.
| - | |||
| - | |||
| - | |||
| - | |||
| - | |||
| - | |||
| - | |||
| - | |||
| - | |||
| - | |||
| - | |||
| - | |||
| - | |||
| - | |||
| - | |||
| - | |||
| - | |||
| - | |||
| - | |||
| - | |||
| - | |||
| - | |||
| - | |||
| Experiment | ||||||
|---|---|---|---|---|---|---|
| WASA-at-COSY | ||||||
| WASA-at-COSY | ||||||
| ANKE |
The data can be described well by a third-order polynomial fit:
| (4) |
The corresponding fit parameters , and are given in table 2. Both data sets show a strong forward-peaked angular asymmetry, while the backward cross sections almost vanish.
In the further analysis, extrapolations of the polynomial fits shown in fig. 8 (a) are used to derive the yield for the two missing angular bins in the very forward and backward direction. With these the cross section ratio for the meson production has been determined to be:
| (5) |
The uncertainty includes contributions from the number of detected events as well as from acceptance determinations at excess energy () and at excess energy () and uncertainties originating from the discussed normalization using the reaction ().
In fig. 8 (b) the new WASA-at-COSY angular distribution is compared to the GEM data [9] obtained at the same energy. Note that here the WASA-at-COSY data have been scaled to the latter ones, i.e. by a factor of . Both data sets show the same angular asymmetry. In fig. 8 (c) the WASA-at-COSY data are compared to the ANKE data [6]. The shown WASA-at-COSY angular distribution is scaled to the ANKE data, i.e. by a factor of . Also here both data sets show the same pronounced angular asymmetry. However, due to the high integrated luminosity of the WASA-at-COSY experiment the statistical uncertainties are significantly smaller than in the previous experiments and allow for precise studies on the angular distributions.

In order to discuss the impact of the extracted cross section ratio the data can be scaled to the cross section obtained at ANKE [6]. Here the latter uncertainty corresponds to the error in the quoted absolute normalization of 15%. In order to estimate systematic uncertainties introduced by minor differences in the shape of the angular distributions, both the ANKE and WASA data have been divided into five angular bins to extract separate normalization factors for these intervals. The uncertainty of the weighted mean value of these factors was determined to and is used as systematic uncertainty. Using the scaling to the data from ANKE and the ratio from eq. (5) one would derive a total cross section of
| (6) |
Here the first (statistical) uncertainty is dominated by the one of the determined ratio for the meson production (). In addition there are statistical uncertainties from the ANKE data point, i.e. . The systematic uncertainty is dominated by the ANKE data point () and the scaling to this data point ().
In fig. 9 this total cross section value is compared to the existing data for the reaction up to . Here it must be emphasized that our data are arbitrarily normalized relative to the ANKE data point at . As consequence the cross section of the WASA-at-COSY data point at coincides with the one from ANKE. Note that all data points are presented without absolute normalization uncertainties. Reason for this is that in the excess energy region of interest, i.e. above , the normalization uncertainties of the individual data sets are correlated. Furthermore, the data from ANKE [6] and WASA/PROMICE [7, 8] which use the same reaction for the absolute normalization are in very good agreement. A similar argumentation holds for the close to threshold data where most of the data originate from one single measurement from ANKE [1] which are normalized in the same way as the ANKE data at higher excess energies. Obviously the precisely determined cross section ratio in combination with the existing data base from ANKE [6] and WASA/PROMICE [7, 8] indicates the presence of a distinct cross section variation between and , which is not smooth.
5 Summary
It turned out that the shape of the angular distributions obtained in the present work agree well with those from previous measurements performed by the ANKE collaboration [6] and the GEM collaboration [9]. While at higher excess energies, i.e. above , the excitation function exposes a smooth behavior, the new determined cross section ratio indicates the presence of a cross section variation in the region of –. Due to the comparatively high excess energy it is unlikely that this effect is caused by a final state interaction. Instead, this observation might be caused by the onset of higher partial waves or could indicate the variation of the production mechanism. New total and differential cross section data in the region of – would be of high interest to investigate this effect in more detail. An according measurement with the WASA-at-COSY setup at COSY/Jülich was conducted in May 2014 [18].
Acknowledgements.
This work was supported in part by the EU Integrated Infrastructure Initiative Hadron Physics Project under contract number RII3-CT-2004-506078; by the European Commission under the 7th Framework Programme through the “Research Infrastructures” action of the “Capacities” Programme, Call: FP7-INFRASTRUCTURES-2008-1, Grant Agreement Number 227431; by the Polish National Science Centre through grant No. 2011/01/B/ST2/00431 and by the Foundation for Polish Science through the MPD programme. We gratefully acknowledge the support given by the Swedish Research Council, the Knut and Alice Wallenberg Foundation, and the Forschungszentrum Jülich FFE Funding Program of the Jülich Center for Hadron Physics. Finally we thank C. Wilkin for the fruitful discussions.References
- (1) T. Mersmann et al., Phys. Rev. Lett. 98, 242301 (2007).
- (2) J. Smyrski et al., Phys. Lett. B 649, 258 (2007).
- (3) J. Berger et al., Phys. Rev. Lett. 61, 919 (1988).
- (4) B. Mayer et al., Phys. Rev. C 53, 2068 (1996).
- (5) H.-H. Adam et al., Phys. Rev. C 75, 014004 (2007).
- (6) T. Rausmann et al., Phys. Rev. C 80, 017001 (2009).
- (7) R. Bilger et al., Phys. Rev. C 65, 044608 (2002).
- (8) R. Bilger et al., Phys. Rev. C 69, 014003 (2004).
- (9) M. Betigeri et al., Phys. Lett. B 472, 267 (2000).
- (10) N. G. Kelkar et al., Rep. Prog. Phys. 76, 066301 (2013).
- (11) H.-H. Adam et al., Proposal for the Wide Angle Shower Apparatus (WASA) at COSY-Jülich ”WASA at COSY” (2004).
- (12) F. Bergmann et al., IKP Annual Report 2008, FZ-Jülich (2008), Jül-4282, p. 52.
- (13) A. Passfeld, diploma thesis, Westfälische Wilhelms-Universität Münster, Germany, (2010).
- (14) M. Bashkanov et al., Phys. Lett. B 637, 223 (2006).
- (15) P. Berthet et al., Nucl. Phys. A 443, 589 (1985).
- (16) C. Kerboul et al., Phys. Lett. B 181, 28 (1986).
- (17) R. Maier, Nucl. Instr. Meth. A 390, 1 (1997).
- (18) A. Khoukaz, 42nd Meeting of the COSY Programme Advisory Committee (PAC), Proposal 220 (2014).