A new method for classifying galaxy SEDs from multi-wavelength photometryThanks: Scottish Universities Physics Alliance
Abstract
We present a new method to classify the broad band optical-NIR spectral energy distributions (SEDs) of galaxies using three shape parameters (super-colours) based on a Principal Component Analysis of model SEDs. As well as providing a compact representation of the wide variety of SED shapes, the method allows for easy visualisation of information loss and biases caused by the incomplete sampling of the rest-frame SED as a function of redshift. We apply the method to galaxies in the UKIDSS Ultra Deep Survey with , and confirm our classifications by stacking rest-frame optical spectra for a fraction of objects in each class. As well as cleanly separating a tight red-sequence from star-forming galaxies, three unusual populations are identifiable by their unique colours: very dusty star-forming galaxies with high metallicity and old mean stellar age; post-starburst galaxies which have formed 10% of their mass in a recent unsustained starburst event; and metal-poor quiescent dwarf galaxies. We find that quiescent galaxies account for 45% of galaxies with , declining steadily to 13% at . The properties and mass-function of the post-starburst galaxies are consistent with a scenario in which gas-rich mergers contribute to the growth of the low and intermediate mass range of the red sequence.
Keywords:
methods: statistical – galaxies: fundamental parameters – galaxies: photometry – galaxies: stellar content – galaxies: luminosity function, mass function –galaxies: statistics1 Introduction
The extraction of physical properties from the observed spectral energy distributions (SEDs) of galaxies lies at the heart of gaining a complete understanding of how galaxies form and evolve. At low redshift (), vast numbers of high quality, moderate resolution spectra have revolutionised our measurement of the physical properties of galaxies (?). At high redshift such high quality and extensive spectroscopy remains prohibitively expensive, but photometric surveys continue to expand at a rapid pace, in wavelength coverage, area on the sky and depth.
As both observations and spectral synthesis models have improved, directly observable quantities such as number counts, luminosity functions and observed-frame colours are commonly replaced with derived (physical) quantities: mass functions, star formation rates and rest-frame colours. This process has greatly improved our ability to compare with galaxy evolution models, and helped us to narrow down the dominant physical processes leading to the observed galaxy population over a large fraction of Cosmic time. The fitting of models to the multiwavelength SEDs of galaxies to obtain physical properties is now a standard tool in extragalactic astrophysics, with many teams developing a wide variety of tools, many of which are publicly available (e.g. ????, for a recent review).
While SED fitting has become the method of choice for estimating the physical properties of galaxies, it has two primary disadvantages: (1) it relies on the accuracy of spectral synthesis models (?), and (2) galaxies are fit independently from one another, so excluding additional information provided by the existence of a population of similar objects. Colour-colour diagrams provide a method of displaying large sets of SEDs on two dimensional diagrams, and classifying galaxies into groups based on observational (rather than physical) properties. With careful selection of colours this method can retain most of the physical information in the full SED (e.g. UVJ ??). However, rest-frame colour-colour diagrams still rely on spectral synthesis models to perform the K-corrections, while observed-frame colour-colour diagrams suffer significant degeneracies between redshift and physical properties for the vast majority of the galaxy population (e.g. ?).
The aim of this paper is to investigate a third method: a rest-frame (redshift independent) colour-colour diagram that combines the available information from all the observed bands, but is not constrained by fits to spectral synthesis models. We use a Principal Component Analysis (PCA) of a nominal set of spectral synthesis models to calculate the optimal linear combination of filters needed to separate populations with distinct optical to near infrared (NIR) SEDs. The advantages of this method over traditional colour investigations is that it (i) can determine equivalent linear combinations for galaxies over a wide redshift range, thus removing the problem of shifting bands; (ii) reduces the dimensionality of the dataset, eliminating the need for large numbers of colour-colour diagrams, while providing colour measurements of higher signal-to-noise ratio (SNR) than can be obtained from only two magnitudes; (iii) provides observed quantities which are not constrained to fit the stellar population synthesis models; (iv) allows easy visualisation of the error incurred on measuring the true SED shape of galaxies (and thus physical quantities such as mass-to-light ratio) due to poor sampling of the SED, as a function of both redshift and SED shape; (v) allows a clear visual comparison between the SED shapes of observed galaxies and the models that could be used to subsequently fit for physical parameters, thereby allowing the identification of populations for which a poor model fit will lead to incorrect parameter estimation, helping us to understand these objects rather than removing them from samples due to their bad .
The goals of the method presented in this paper are similar in spirit to the PCA spectral indices developed by ?), where the 4000Å region of optical spectra was studied. The PCA identified three well-known features as being optimal for describing the full shape of the spectrum (the strength of the 4000Å break, Balmer absorption lines and the Ca H&K lines). The PCA derived spectral indices benefit from a greatly enhanced SNR over traditional indices, by allowing information from all pixels to contribute, including both multiple correlated lines and the shape of the continuum. The accuracy and improved visualisation of the complete dataset afforded by these indices have allowed the identification of post-starburst galaxies from low resolution Vimos VLT Deep Survey (VVDS) spectra (?) and a complete evolutionary sequence of starbursts into the post-starburst phase sequence in higher resolution Sloan Digital Sky Survey (SDSS) spectra (?).
The dataset used to test the method is the Ultra Deep Survey (UDS), a deep, large area near-infrared (NIR) survey and the deepest component of the UKIRT Infrared Deep Sky Survey (UKIDSS, ?). The field has deep optical observations from the Subaru XMM-Newton Deep Survey (SXDS, ?), and mid-IR coverage from the Spitzer UDS Legacy Program (SpUDS, PI:Dunlop). A significant advantage of the SXDS/UDS field for this study is the large number of homogeneously observed spectra, taken as part of the UDSz project using a combination of the VIMOS and FORS2 instruments on the ESO VLT (ESO Large Programme 180.A-0776, PI: Almaini). These spectra are generally of insufficient SNR to make robust measurements of the stellar continuum features for individual galaxies, but can be stacked to provide a useful verification of the PCA derived classifications.
This paper is arranged as follows. In Section 2 we present the method used to derive the optimal combination of filters to parameterise the shapes of rest-frame optical-NIR SEDs. We apply the method to galaxies in the UKIDSS UDS survey at in Section 3, to reveal the physically distinct populations that can be identified from broad band photometric datasets. We compare with traditional K-corrected colour-colour and colour-magnitude diagrams, and stacked rest-frame optical spectra. In Section 4 we present the stacked SEDs, and the luminosity and mass functions of the galaxies by class. We use spectral synthesis models to measure the average physical properties of each class, highlighting which regions of colour space are not well fit by the models. Finally, in Section 5 we discuss how the method can be used to compare and contrast different stellar population synthesis models, investigate the impact of nebular emission lines, and constrain the dust attenuation law of galaxies. We also calculate the fraction of true quiescent galaxies as a function of stellar mass at , and discuss the implications of our results for using post-starburst galaxies and low-metallicity quiescent galaxies to improve our understanding of the evolving galaxy population.
The optimal linear combination of filters (eigenvectors) derived in this paper are provided in digital format, suitable for surveys using the same filterset as used here, together with IDL code for reading and applying them. Where necessary we assume a cosmology with , and . All magnitudes are on the AB system. Stellar masses are calculated assuming a Chabrier IMF and are defined as the stellar mass at the time of observation: i.e. , where R is the fraction of mass in stars returned to the interstellar medium (ISM) due to supernovae and mass loss.
2 Principal Component Analysis of extragalactic photometric datasets
Principal Component Analysis and similar techniques have become a popular tool for QSO and galaxy spectral analysis (???????????). They serve several purposes, for example, the exploration of a dataset to uncover unknown trends, the reduction of dimensionality to speed up model fitting, the optimal separation of physically distinct components, and the combination of correlated lines and features into high signal-to-noise ratio spectral indices.
These techniques also have great potential for the analysis and interpretation of photometric datasets, however, their application is not trivial due to the different redshifts of the galaxies. Moderate resolution extragalactic spectra can be de-redshifted to a common wavelength grid by performing minimal resampling, provided the redshift range covered by the sample is small enough and the wavelength range of the spectra is large enough to give sufficient overlap in wavelength space. On the other hand, the regions of a galaxy’s rest-frame SED sampled by a photometric dataset depend on the galaxy’s redshift, each filter sums a large number of spectral features into a single data point, and large wavelength regions can remain entirely unsampled. For this reason, application of multivariate statistical techniques to investigate extra-galactic photometric datasets are limited. Berta et al. (2013) used a Gaussian Mixture Model to group galaxies with similar SEDs and identify outliers (following the method presented in Connolly et al. 2000) and ?) performed a PCA on K-corrected colours to investigate the main variations in galaxy SEDs.
Our aim is to derive an optimal combination of colours (eigenvectors) that describe the full shape of galaxy SEDs using a minimal number of variables (principal component amplitudes). Often it is possible to calculate these optimal combinations from the dataset itself, however, in the case of extragalactic photometric data this is a complex problem, as individual galaxies each contribute only a small number of observed points. We therefore begin our analysis with a large sample of model SEDs that reasonably cover the colour space of observed galaxies. While it is important that the models make a reasonable attempt at covering the full range of galaxy SED shapes, it is not important for them to have the correct relative number density or realistic physical properties. From these models we build a large grid of observed frame colours using all the photometric bands in our survey and at all redshifts of interest. This will enable us to calculate the projection of every real galaxy SED onto the eigenvectors regardless of the redshift of the galaxy or filter coverage.
The models are only used to define the linear combination of filters that optimally describe the shape of the SEDs. Observed SEDs, or other models, can be projected onto these linear combinations without any requirement for the original models to be “correct”. Naturally, the model derived eigenvectors will not be perfectly optimal for the observed SEDs, in the sense that they will not contain as high a fraction of the variance of the dataset as for the models from which they were derived. However, at least in the optical-to-NIR wavelength range studied here, galaxy SED shapes are well enough understood that eigenvectors derived from any reasonable set of models or real data will be very similar. The approach described here forces a complete separation between observables (galaxy SED shapes) and model derived properties (mass-to-light ratios, dust contents, metallicities etc.).
2.1 Building a super-sampled colour grid

We begin with a library of 44,000 “stochastic burst” model SEDs built from ?) stellar population synthesis models with stochastic star formation histories: exponentially declining star-formation rates with inverse decay rates between 0 and 1 Gyr-1, with -function bursts of star formation randomly superposed with varying strengths and ages. The models have a flat prior on metallicities between one tenth and twice solar, and a flat prior on formation time between 0 and 6 Gyr (the age of the Universe at the lowest redshift we are interested in). Dust attenuation is included using the ?) prescription, where stars older than years suffer a fixed fraction () of the total effective attenuation (). The models have a Gaussian prior on the total effective dust attenuation centred on , which leads to between 0 and 6 magnitudes of attenuation in the -band for stars younger than years, and between 0 and 1.8 magnitudes of attenuation for older stars. Similar libraries have been widely used in the literature to determine the physical properties of galaxies (????). Altering the priors for the model grid was found to have no significant effect on the output from the PCA, so long as a reasonable range of SED shapes was included. Ultimately this occurs because a limited number of physical processes contribute to the optical-to-NIR SED of galaxies. In this wavelength range the origin of the SED shapes is reasonably well understood, we therefore do not expect the use of different spectral synthesis models to have a significant impact on the first few eigenvectors. Obtaining such a robust result for ultraviolet or far-infrared wavelength regions would be more challenging.
Nebula emission lines are not included in the models, as this remains an uncertain procedure. We tested the effect of their inclusion using a limited set of the strongest lines, with amplitude based on the number of ionising photons output from the stellar population synthesis model, and standard line ratios for star forming galaxies. Their addition was found not to have a significant effect on the eigenvectors. Emission line contamination in the data may subsequently be identified as regions of colour space where the models and data disagree (see Section 5.2). We emphasise that these stochastic burst models do not need to be a perfect representation of the data: any models can be projected onto the eigenvectors if they are subsequently deemed more appropriate to determine physical parameters from the data.
We convolve these model SEDs with the Subaru XMM-Newton Deep Survey (SXDS), UKIDSS ultra deep survey (UDS) and Spitzer UDS Legacy Program (SpUDS) filter sets (Subaru , , , , ; UKIRT, , ; SpUDS IRAC 3.6m and 4.5m), progressively shifting the model SEDs to redshifts of in steps of . Additionally the ESO -band, HST 125W (J) and 160W (H) filters are included as placeholders, but not used in the analysis presented in this paper. Smaller redshift steps were tested but led to no improvement. This redshift range was chosen to be physically interesting (where the majority of stellar mass in the Universe is formed), and also to include redshift regimes where the SED shapes are both well and less-well constrained. Any redshift range could be chosen depending on the science question being asked. The resulting flux matrix is truncated at rest wavelengths of between 3000Å and 1.5m, to avoid more uncertain regions in spectral synthesis models, giving a “super-sampled” matrix of 935 data points. Some examples of model galaxy SEDs filtered in this way are shown in Figure 1. Each filter at each redshift is represented by a dot placed at the effective rest-frame wavelength of the filter. Gaps indicate rest-frame wavelength regions that are not covered by any filter at any redshift. Conversely multiple traces appear in some regions, where two or more different filters sample the same wavelength region for galaxies at different redshifts.

We normalise all model SEDs at 1m, calculate the mean flux array, subtract this from each model SED, and perform a PCA of the resulting difference array i.e. we calculate the eigenvectors of the covariance matrix of the difference array. Both a narrative and mathematical description of our application of PCA can be found in Section 3 and Appendix A of ?)11 1 See ?) for an introduction to the mathematics of PCA. IDL code for performing PCA and attempts to homogenise different formalisms, is available for download from http://www-star.st-and.ac.uk/vw8/downloads. Two similar multivariate analyses were attempted, non-negative matrix factorisation and independent component analysis (ICA), however, PCA provided the most satisfactory results when applied to noisy and gappy data. . The first 3 eigenvectors are shown in Figure 2, and depict how the flux at different wavelengths is correlated within the set of model galaxy SEDs. By construction, the eigenvectors are ordered by the variance that they account for in the input dataset: the first 3 eigenvectors represent 96.9%, 2.9% and 0.15% of the variance, 99.98% in total.
A normalised galaxy SED () can be approximately reconstructed from the mean spectrum () plus a linear combination of the first eigenvectors ():
| (1) |
In perfect data, the accuracy of the reconstruction increases with increasing numbers of eigenvectors used. The linear combination coefficients (), also known as principal component amplitudes, uniquely define the shape of a galaxy’s SED and can be calculated for any arbitrary galaxy SED by inverting Eqn. 1:
| (2) |
The first three principal component amplitudes alone provide a compact representation of the shape of all the input SEDs, accounting for 99.98% of the variance in SED shapes in our model dataset. “Colours” are the simplest linear combination of filters that can be used to describe the shape of galaxy SEDs. From now on we will refer to the principal component amplitudes as “super-colours” (SCs): while colours are the combination of two filters weighted equally, super-colours combine multiple filters with an optimally defined weighting scheme (the eigenvectors).
The super-colours can be thought of as the “amount” of each eigenvector contained within each galaxy SED. The mean SED is an averagely blue galaxy (top panel of Figure 2), which can be made bluer or redder by adding or subtracting some of the first eigenvector (second panel). The second eigenvector alters the strength of the 4000Å or Balmer break. The third eigenvector is also associated with the shape of the SED around 4000Å. This tells us that to first order a model galaxy SED can be described by its overall slope (colour); to second order the exact shape of the 4000Å break region is important. The PCA formally quantifies these well known properties of galaxy SEDs.


In Figure 3 the super-colours of the 44,000 stochastic burst model SEDs are shown, with regions of super-colour space colour coded by the mean physical parameters of the models lying in that region. From top left to bottom right we show the -band light-weighted mean stellar age, metallicity, total effective dust attenuation and fraction of stars formed in starbursts in the last 1 Gyr. As expected, the first super-colour (SC1) correlates primarily with both mean stellar age and dust content – this is a well known degeneracy in photometric studies of galaxies. Both the second and third super-colours (SC2 and SC3) correlate with metallicity, and provide additional information on age and dust, which can break the degeneracy between these parameters in some cases. For example, very highly attenuated, high metallicity, old galaxies are identifiable at low SC1, SC2 and SC3; and old, low-metallicity galaxies can be isolated at low SC1 and high SC3. Another interesting region of colour space is the population of mixed metallicity objects at high SC2, which contains galaxies that have undergone a significant burst of star formation in the last 1 Gyr (post-starburst galaxies).
2.2 The reality of sparse sampling


Up to this stage, we have shown how the principal component amplitudes of a photometric dataset can be thought of as “super-colours” which provide a compact representation of the shape of galaxy SEDs. We have not yet addressed the core problem: in reality, each galaxy is observed at a single redshift, with only a handful of filters covering the wavelength range of interest. To demonstrate the effect of “sparse sampling” the array, we assign each of our 44,000 stochastic burst model SEDs a random redshift in the range used to build the super-sampled array (). Each SED is observed with between 5 and 7 filters, depending on redshift, that partially cover the full wavelength range. We project this sparsely sampled data vector onto the eigenvectors, using the “gappy-PCA” technique of ?), weighting the observed bins by and the unobserved bins by zero, where is the error on the observed data point. This technique estimates the principal component amplitudes in the presence of gappy and noisy data by minimising the error in the reconstructed spectrum, over the full range in wavelength, weighted by the variance of the observed bins (filters). In this mock dataset we set to be constant in all observed bins. An additional effect caused by the sparse-sampling of the data is that the precise flux normalisation of the SED is unknown and must be fitted for simultaneously with the super-colour amplitudes 22 2 The normalised-gappy PCA algorithm was created by G. Lemson (MPA) and IDL code is available for download from http://www-star.st-and.ac.uk/vw8/download (?). Figure 4 shows an example of how a sparse-sampled SED is reconstructed from the eigenvectors and the three measured super-colour amplitudes.


The accuracy to which the input SED can be recovered will depend on the filter set, the galaxy redshift and shape of the SED. In Figure 5 we show the error on the super-colours for our mock catalogue of 44,000 stochastic burst model SEDs, sparse-sampled with redshifts randomly assigned in the range . The solid line (a) compares the super-colours measured from the super-sampled and sparse-sampled array, but assuming that we know the flux normalisation33 3 This will never be the case with observed galaxy SEDs, but is included to emphasise the importance of fitting for the unknown normalisation as an additional step in solving for the principal component amplitudes.. The dotted line (b) includes the effect of unknown flux normalisation, and the dashed line (c) shows the effect of errors on the redshifts. To model the effect of photometric redshifts we assume a normal distribution of redshift errors, with a width of 0.06 (percentage error of 7% and 3% at and ).44 4 We take a fixed width for the distribution of redshift errors, which is the variance of the distribution of redshift error for 282 galaxies with spectra presented in Section 3.2. In reality photometric redshift errors depend on redshift, and catastrophic outliers exist. We do not attempt to model all eventualities here, which will depend on the dataset being studied. It is clear that both the sparse-sampled nature of the data and the unknown normalisation affect our ability to recover the SED shape, however, redshift errors at the level found in photometric datasets have no further significant impact on the measured super-colours. The 16th and 84th percentiles of the distributions (equivalent to 1 errors for a Gaussian distribution) when all effects are included (histogram c of Figure 5) are 0.28 and 0.31 for SC1, 0.18 and 0.19 for SC2, and 0.17 and 0.18 for SC3. There are no systematic offsets.
In Figure 6 we show the errors on the super-colours when all effects are included (histogram c), as a function of redshift and SED shape (parameterised by the light-weighted mean stellar age of the model). For the available filters in the UDS we obtain accurate super-colours, and can therefore reliably recover the SED shapes, in the redshift ranges of and . In the low-redshift range (), the 16th and 84th percentiles are 0.14 and 0.13 for SC1, 0.14 and 0.14 for SC2, and 0.09 and 0.1 for SC3. The percentage errors are 1.2% for SC1, 7% for SC2 and 15.8% for SC3. This figure highlights how, for certain redshift ranges, the ability to constrain the shape of a galaxy SED is significantly impaired by gaps in wavelength coverage of the broad band filters. Clearly, the physical parameters determined from SED fits of galaxies at observed with the UDS filter set will be less well constrained than at other redshifts.
The younger SEDs suffer larger errors, due to the lack of strong features in their SED. The older SEDs suffer from a systematic offset in SC1 and SC2, at the level of about 1%. This is unlikely to be a dominant source of error in the analysis of a real dataset, but is worth keeping in mind if highly accurate ages of old stellar populations are required from SED fitting.

In Figure 7 we show examples of the fractional error between the input and recovered SEDs, for the same five randomly selected model SEDs as shown in Figure 1. The black trace shows the effect of only using three eigenvectors, the blue trace includes the effect of sparse-sampling and unknown flux normalisation and the red trace additionally includes the effect of redshift errors. The blue trace is not easily visible under the red trace, which again emphasises the fact that photometric redshift errors have little additional impact on our ability to recover the SED shape.
3 Application to galaxies in the SXDS / UDS
| Band | ||||||
|---|---|---|---|---|---|---|
| Depth | 26.4 | 26.3 | 25.6 | 24.9 | 24.4 | 24.6 |
| () | 0.6507 | 0.7646 | 0.9011 | 1.2483 | 1.6319 | 2.2010 |
The Ultra Deep Survey (UDS) is a deep, large area near-infrared (NIR) survey centred on RA = 02:17:48, DEC = -05:05:57 with deep optical observations from the Subaru XMM-Newton Deep Survey (SXDS, ?), and mid-IR coverage from the Spitzer UDS Legacy Program (SpUDS, PI:Dunlop). The effective wavelengths and depths of the observations for the filters used to calculate the super-colours of galaxies in this paper are given in Table 1. We use a -band selected catalogue based on the eighth UDS data release (DR8), but update the photometry to DR10 and include new -band observations (Furusawa et al. in preparation, Bowler et al. 2012). The total survey area with full optical, NIR and mid-IR coverage and with conservative masking of diffraction spikes is 0.607 deg2.
Photometric redshifts were calculated by fitting the observed photometry ( and 3.6 and 4.5m when available) with synthetic and empirical galaxy templates using code based on the public package HYPERZ (?). Further details are given in ?) and ?). While it would be possible to solve for both the super-colours and photometric redshifts in a single step, we decided to focus on recovering the SED shapes in this paper, and use the well tested photometric redshifts calculated from a standard code with the full set of available filters.
We select 39,683 sources with , of which 6,912 lie in the redshift range . We select this redshift range for this initial analysis for four reasons: (1) the errors on the super-colours due to sparse-sampling of the SEDs is minimal given the current set of filters available in the UDS field (see Section 2.2); (2) there are a large number of spectra with coverage of the 4000Å rest-frame region that are available to test our method (see Section 3.2); (3) the strongest emission lines do not intercept narrow filters which may cause biases in the measured super-colours; (4) we do not require the IRAC photometry which is less reliable than the optical and NIR photometry.
We calculate the super-colours for the observed galaxies in exactly the same way as for the model galaxies (Eqn. 2), with errors derived from the depths in each band (Table 1). Bins with no information are given zero weight. In the following subsections we include all galaxies, regardless of the formal value for the photometric redshift fit or the distance between the observed super-colours and closest model galaxy. Excluding objects based on a goodness-of-fit to models can lead to biases in the samples when the models are not a perfect representation of the data.
3.1 Super-colours: data vs. models

In Figure 8 we show the distribution of the first three super-colours for the UDS galaxies, using both a number density representation (left panel) and plotting individual points (central panel). To facilitate comparison between the stochastic burst models used to build the eigenvectors and the data, we show the distribution of model colours in the right-hand panel. In the right panel we overplot the position of UDS galaxies which have spectra (Section 3.2), colour coded according to their position in super-colour space.
Although there are no truly discrete populations, separation of colour-colour space into classes will allow us to to stack galaxies with similar SEDs to study their average properties in more detail. Comparing to the mean model parameters shown in Figure 3 we can identify a tight red-sequence to the upper-left in SC1 vs. SC2. The more diffuse blue-cloud spreads across the full range of SC1, with mean stellar age decreasing with increasing SC1. We colour code the red-sequence galaxies as red and split the blue-cloud into three classes from cyan to blue to purple with decreasing mean stellar age. The position of these blue-cloud boundaries is arbitrary.
More unusual classes of galaxies can also be isolated. Galaxies that lie below and to the left of the red-sequence in SC1/2 and SC1/3 are expected to have very high dust contents; we colour code them brown to distinguish them from normal blue-cloud or red-sequence galaxies. Galaxies that have had a recent burst of star formation (post-starburst) form a distinct sequence entering the top-right of the red-sequence in SC1 vs. SC2; they are colour coded orange. The boundary between the red and post-starburst populations is determined empirically from comparison to the spectra (see Section 3.2 and Appendix A) to ensure that the photometric selection is as close as possible to a traditional spectroscopic selection. Finally, we identify a population of red-sequence galaxies with high SC3 (green points), which are consistent with low-metallicity red-sequence galaxies.
The stochastic burst model stellar populations shown in the right hand panel are not intended to reproduce the relative number density of different populations, however, their wide range of star formation histories has been constructed to allow full coverage of the colour distribution of real galaxies as far as possible. There is no a-priori reason that the data and models should lie in the same region of colour-colour space, as the data is not forced to fit the models as is the case when traditional K-corrections are performed. Differences between model and data colour distributions could occur for many reasons: incorrect star formation histories of the models; incomplete or incorrect stellar population models (lack of particular types of stars, incorrect evolutionary tracks); incomplete or incorrect model SEDs (wrong assumed dust attenuation, lack of emission lines); zero-point offsets in the photometry; photometric redshift errors. The fact that the observed galaxies are largely contained within the model distribution indicates that the spectral synthesis models used to build the eigenvectors are sufficiently accurate to reproduce the spectral energy distributions of most galaxies at .
Looked at another way, this figure shows that current rest-frame optical-NIR photometric observations of the vast majority of galaxies can not drive further substantial improvement in the models. However, there are three small offsets between model and data which suggest where improvements in the models might be made: the dustiest class has slightly higher SC1 values than is possible with the models; the youngest blue-sequence galaxies have higher SC3 values than is typically seen in the models; there is a population of red objects with very high SC3 values. In Section 5 we will investigate the reasons for each of these offsets with respect to possible observational errors or improvements in the population synthesis models.
There are a small number of galaxies with super-colours that scatter away from the main sample. All objects have been included in this plot, regardless of the goodness-of-fit of the first three eigenvectors to the observed points, or the formal errors on the principal component amplitudes or photometric redshifts. Two interesting populations appeared during our investigations of the outliers. Firstly, some of the outliers falling below the blue-sequence have X-ray detections, or are identified as spectroscopic broad line AGN (Ueda et al. 2008; Simpson et al. 2012; Akiyama et al. in prep.). The strong UV continuum from the AGN causes the objects to have blue SEDs and acts to reduce the strength of the Balmer break (or obliterate it entirely in many cases). Secondly, the output from some photometric redshift catalogues tested during initial studies for this paper caused a large scatter of objects to the upper right (small SC1 and large SC2). This was found to be caused by “aliasing” effects, whereby galaxies close to a certain redshift are all forced onto a similar, but incorrect redshift, due to the presence of a strong discontinuity in the SED. While we have verified that the photometric redshift catalogue used in this paper does not suffer from strong aliasing biases, photometric redshift errors remain a leading candidate for causing the outliers in super-colour space.
3.2 Comparison to medium resolution spectra
A significant advantage of the SXDS/UDS field for this first super-colour study is the large number of homogeneously observed spectra, taken as part of the UDSz project (ESO Large Programme 180.A-0776, PI: Almaini) using a combination of the VIMOS and FORS2 instruments on the ESO VLT. 2,881 optically brighter systems ( or ) were targeted with the VIMOS LR Blue grism (4.5 hours exposure) and LR Red grism (2.6 hours exposure), with a spectral resolution of = 180 and 210 respectively. 802 fainter, redder systems ( and ) were targeted with the FORS2 300I grism (5.5 hour exposure), with a spectral resolution of =660. Details of the reduction are given in ?) for VIMOS and ?) and ?) for FORS2.
From the complete catalogue we select 752 galaxies with secure redshifts and photometric matches in our masked UDS field, of which 335 lie in the redshift range . We further remove objects with spectral per-pixel SNR and rest-frame wavelength coverage that does not extend red enough to include 4150Å. This results in a final sample of 282 moderate quality spectra with coverage of the 4000Å break region. The spectra are not all of high enough quality to provide useful stellar continuum information for individual objects, but they can be stacked to confirm our super-colour based SED classifications. For the purposes of spectral stacking, we convolved the FORS2 spectra to a resolution of to match the VIMOS spectra and rebinned all spectra onto a common wavelength scale using a linear interpolation. The stacks were built using an arithmetic mean, with each spectrum normalised by its median flux. A weighted mean was also calculated, but did not improve results.
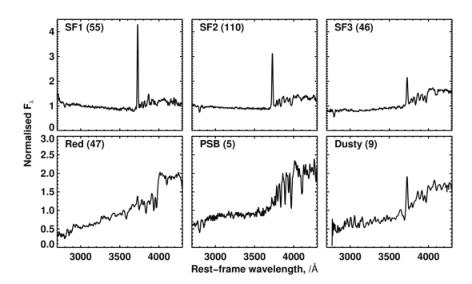
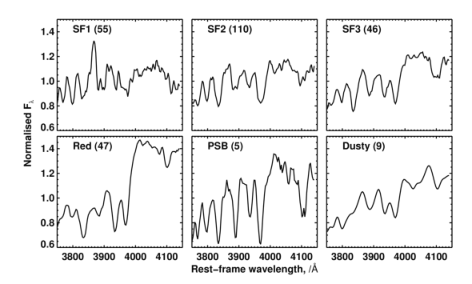
The availability of rest-frame optical spectra for galaxies in most of our super-colour defined classes provides an easy way to verify the method. One advantage of optical spectra over broad band photometry is that dust does not substantially change the strength of the 4000Å break or absorption lines, and therefore the age of the stellar population can be ascertained much more accurately. In Figure 9 we show stacked spectra of galaxies in each super-colour class, over the full wavelength range (left panel) and zooming in on the 4000Å break region (right panel). From the highly star-forming SF1 class to the red-sequence we see the expected steady decrease in [O ii] emission line strength, decrease in blue/UV flux, increase in 4000Å break strength, and strengthening of the Ca H&K absorption lines, all indicating that specific star formation rate decreases and mean stellar age increases as we move through these classes. Weak [O ii] emission is visible in the red-sequence stack, which may indicate the presence of a narrow line (obscured) AGN in some objects. The [Ne iii]3869Å emission line is visible in the SF1 class, consistent with the high ionisation state of gas in young starbursts.
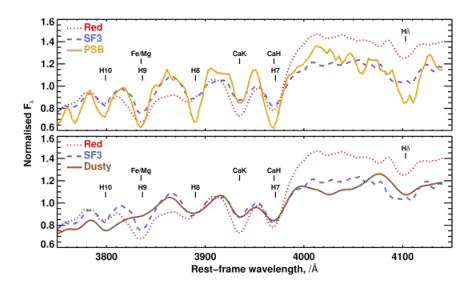
In Figure 10 we compare the 4000Å break region of the more unusual dusty and post-starburst classes with the red-sequence and SF3 classes, which have the most similar SED shapes. The top panel clearly shows the strong Balmer absorption lines of the post-starburst galaxies compared to the SF3 class, and the different continuum shape compared to the red-sequence galaxies caused by the post-starburst galaxies having a Balmer break rather than 4000Å break. The bottom panel shows that the dusty star-forming galaxies have absorption line and break strengths that are very similar to the SF3 class. In the left panel of Figure 9 we also see that they have a similar strength of [O ii] emission line, although the dusty star-forming galaxies have a noticeably redder UV continuum slope, as expected from their super-colour classification.
3.2.1 Selecting post-starburst galaxies
129 galaxies have spectra with sufficient SNR to measure their spectral indices using the method developed by ?, hereafter WWJ09) for galaxies in the VIMOS VLT Deep Survey (VVDS, see Appendix A). This allows us to position the super-colour demarcation line between post-starburst and red-sequence galaxies such that all the spectroscopically identified post-starburst galaxies (4) lie in the post-starburst super-colour class. Galaxies with lower SC1 and SC2 values have optical spectra that were consistent with being in the red-sequence as defined by the VVDS spectral indices. One galaxy has spectral indices placing it in between the red-sequence and post-starburst classes, and this galaxy also lies to the red end of the post-starburst class in super-colour space. We set the boundary to include this object, although this means that our photometrically selected post-starbursts may extend to slightly older ages than the spectroscopically selected post-starbursts in WWJ09.
3.3 Comparison to traditional colour-colour diagrams


In recent years, the rest-frame (K-corrected) UVJ colour-colour diagram has been the preferred method to separate red quiescent from blue-starforming and dusty-starforming galaxies (e.g. ???), and to identify “young red-sequence” or post-starburst galaxies (?). It is therefore valuable to compare the PCA derived super-colours with the UVJ colours. For each galaxy in our sample we perform a traditional K-correction by identifying the best-fit stochastic burst model SED, and then measuring the rest-frame U-V and V-J colours from the best-fit model55 5 We note that some authors extrapolate from the model colours in an attempt to allow for poor model fits (e.g. Williams et al. 2009, Whitaker et al. 2011, following Rudnick et al. 2003). We do not attempt to reproduce this method here and it is not simple to assess the success of the extrapolation as a function of redshift, SED type and assumed model templates. . To reproduce previous results from the literature we use the ?) and filters, and the UKIRT filter which is on the Mauna Kea system (?). The resulting UVJ diagram is shown in the left panel of Figure 11, with objects colour coded by the super-colour SED classification described in the previous subsection.
It is not a surprise to see that the two methods produce very consistent classifications between the major classes: as with optical spectra, PCA has identified the major variations of galaxy SEDs to be exactly those that astronomers have identified by eye. The advantage of the PCA is the combination of many filters into single colours to improve robustness and signal-to-noise, the independence from model fitting, and the ability to identify higher order variations as seen in the third component.
There are some details of this comparison that are worth highlighting. Firstly, for blue-cloud galaxies, the cuts of constant SC1 slice across the UVJ colour distribution almost perpendicular to the axis of the blue-cloud in UVJ colour space. This illustrates how PCA rotates colour-colour space to combine colours which are correlated (i.e. colours that provide equivalent information). Secondly, the post-starburst population are found at the bluest end of the red-sequence in the rest-frame UVJ colour-colour diagram, as suggested by ?), however their cut at includes a majority of objects that we are unable to confirm as post-starburst galaxies based on our comparison to the UDSz spectra. Low-metallicity red-sequence galaxies scatter throughout the red sequence and SF3 classes; this colour combination does not allow the separation of this class. Finally, the very tight red sequence identified by the PCA is considerably more extended in UVJ colour space, and has significant overlap with the low-level star-forming galaxies.
In the right hand panel of Figure 11 we show the colour-stellar mass diagram of the galaxies in our catalogue. Stellar masses are calculated from the stellar mass-to-light ratio of the best-fit spectral synthesis model and the flux normalisation at 1m output from the PCA. When the V-J colour is not considered, the red-sequence is clearly contaminated with dusty star-forming galaxies and older/dustier/more metal rich star-forming galaxies. The so-called “green-valley” between blue and red-sequences is comprised of predominantly older/dustier/more metal rich star-forming galaxies, but also contains a large fraction of the post-starburst galaxies (see also ?). The low-metallicity class lies predominantly at the low-mass end of the red-sequence. We will compare the stellar masses functions of the different classes in Section 4.2.
4 Results
In the previous sections we presented a method to define linear combinations of filters that optimally describe the shapes of galaxy SEDs. We applied this method to galaxies in the SXDS/UDS field, and qualitatively confirmed our interpretation of the physical properties of each class by stacking rest-frame optical spectra. In this Section we stack the SEDs of the galaxies in each class, and fit spectral synthesis models to obtain quantitative physical properties. We then construct luminosity and mass functions of each class.
4.1 Stacked SEDs and average physical properties

| Class | Number | SC1 | SC2 | SC3 |
|---|---|---|---|---|
| SF1 | 1608 | 30.20.9 | -1.00.9 | 0.90.5 |
| SF2 | 2583 | 4.01.0 | -1.20.9 | 0.50.5 |
| SF3 | 1396 | -16.90.5 | -3.60.4 | -0.40.3 |
| Red | 779 | -19.30.3 | -0.40.3 | 0.80.2 |
| PSB | 78 | -7.10.5 | 4.20.5 | 0.30.5 |
| Dusty | 320 | -27.30.2 | -7.20.2 | -1.90.2 |
| Low-met | 133 | -17.00.4 | -0.90.4 | 2.90.3 |
The UDS galaxies cover a wide range of redshifts, therefore while a single galaxy is observed at only 6 sparsely sampled wavelength points, the full wavelength range is observed within the sample. In Figure 12 we exploit this to show the average SEDs of each class. The number of galaxies in each class is shown in each panel in brackets. This figure highlights the distinctly different SED shapes that have been identified by the PCA. We show the sample as black points: the smaller errors on both the photometric redshifts and on the super-colours compared to higher redshifts are evident in the much reduced scatter in the combined SEDs, at a given wavelength. We include the higher redshift objects in this plot to help visualise the full SED and note features such as the H emission line visible in the starburst galaxies.
We calculate the typical super-colours of each class from the median normalised flux of all () galaxies which contribute to each wavelength bin, and take the 16th and 84th percentiles as estimates of the errors on these fluxes. The resulting typical super-colours of each class are given in Table 2 and the reconstructed SEDs are overplotted in each panel of Figure 12.
| Class | agewr/Gyr | agewm/Gyr | Z/Z⊙ | Fburst | log(M/L)V | log(M/L)K | ||
|---|---|---|---|---|---|---|---|---|
| SF1 | 0.7 | 0.4,0.4,0.4 | 0.8,0.8,1.0 | 0.8,1.2,1.3 | 0.2,0.2,0.5 | 0.0,0.0,0.1 | -0.61,-0.61,-0.55 | -0.90,-0.89,-0.80 |
| SF2 | 0.1 | 0.7,1.0,1.3 | 1.3,1.6,2.5 | 1.2,1.5,1.7 | 0.2,0.5,0.8 | 0.0,0.0,0.0 | -0.34,-0.28,-0.22 | -0.79,-0.70,-0.64 |
| SF3 | 0.3 | 1.6,2.1,2.4 | 2.2,3.1,3.6 | 1.6,1.7,1.9 | 0.8,1.1,1.7 | 0.0,0.0,0.0 | 0.12,0.15,0.21 | -0.57,-0.52,-0.48 |
| Red | 0.2 | 1.3,1.8,2.4 | 1.6,2.2,3.1 | 0.5,1.0,1.5 | 1.1,1.4,2.4 | 0.0,0.0,0.1 | 0.03,0.12,0.21 | -0.59,-0.50,-0.40 |
| PSB | 0.2 | 0.7,1.0,1.6 | 0.8,1.3,2.5 | 0.5,1.0,1.6 | 0.5,1.4,2.4 | 0.2,0.4,0.7 | -0.25,-0.16,-0.10 | -0.74,-0.62,-0.52 |
| Dusty | 1.6 | 0.7,1.0,1.6 | 1.3,1.6,2.5 | 1.5,1.9,1.9 | 2.1,2.7,4.9 | 0.0,0.0,0.0 | 0.57,0.60,0.66 | -0.42,-0.42,-0.38 |
| Low-met | 17.8 | 2.7,3.2,3.8 | 3.1,3.6,4.5 | 0.4,0.6,0.8 | 0.2,0.8,1.7 | 0.0,0.0,0.0 | 0.09,0.18,0.24 | -0.43,-0.37,-0.30 |
Col. (1): Class name
Col. (2): Reduced of the best-fit BC03 stochastic burst model
Col. (3-9): 16th, 50th and 84th percentiles of the probability distribution function of physical (derived) parameters: -band light-weighted age; mass-weighted age; metallicity; total effective -band optical depth due to dust attenuation; fraction of stars formed in a starburst in the last Gyr; log mass-to-light ratio in the and bands (we assume solar AB absolute magnitudes of 4.8 and 5.18 in the and bands respectively).

For each of these typical SEDs we calculate the probability distribution function (PDF) of derived (model) parameters, using the stochastic burst models as a prior. The method is similar to that described in detail in e.g. ?) and ?) for fitting models to SDSS data using spectral indices. The 16th, 50th and 84th percentiles of the PDFs are given in Table 3 for a selection of parameters, and the full PDFs are shown in Figure 13. The reduced of the best-fit model indicates the ability, or otherwise, of the models to fit the observed SED shape. In the case of the dusty galaxies and low-metallicity galaxies, this value is greater than unity, meaning the models provide a poor fit to these classes. Therefore the quoted physical parameters should be taken as indicative only66 6 Because of the poor model fits and small errors on the data afforded by the stacking of many galaxies, the PDFs for the dusty and low-metallicity classes are dominated by a single “closest” model spectrum. When estimating the physical parameters of these two classes, we therefore increased the errors on their super-colours by a factor of 1.5. This allowed a sufficient number of models to lie within the error range to obtain an estimate of the typical parameters of a range of the closest matching models. The precise factor chosen makes no significant difference to the results, which should be taken as indicative only. .
In agreement with the trends seen in the stacked optical spectra, we find an overall increase in mean stellar age from SF1 to SF3 galaxies. In contrast to what is expected from the optical spectra, however, the SF3 class is fit with models of an older mean stellar age than the red-sequence class. The SF3 class is fitted with models with a slower exponential decay time for star formation than the red-sequence class class (3.3 Gyr compared to 1.4 Gyr), and an earlier time of formation. To obtain more robust ages, there is clearly a need for a careful analysis of the degeneracies between age, dust and metallicity. Given the limitations of our SED fitting with respect to the fixed dust attenuation law, fixed metallicities, parameterised star formation histories and need to account for the variations between spectral synthesis models, we do not interpret these trends further.
Turning to the post-starburst, low-metallicity and dusty classes, the super-colours and errors show that these have statistically different SED shapes compared to the more usual classes, at high significance (Table 2). The post-starburst class is clearly identified from the SED fit as the only class with a significant recent burst mass fraction. The fraction of stars formed in a burst in the last 1 Gyr is not well constrained by the super-colours, but is larger than 10%. While the post-starburst class is well fit by the models, the conclusions we can draw about the physical properties of the dusty and low-metallicity classes are based on extrapolation from the closest models. The dusty galaxies are fit with models with total effective -band absorption optical depth of the dust seen by young stars inside birth clouds of , which is significantly higher than all other classes. Their fitted mean stellar age is similar to the blue-cloud galaxies (SF2), although the stacked optical spectra show a closer match to the SF3 class. We note that the old, metal-rich nature of this population is almost certainly a selection effect: only the oldest, most metal rich dusty star-forming galaxies will be uniquely identifiable at the very reddest end of the blue-sequence. Younger and less metal rich dusty galaxies will be indistinguishable from normal blue-sequence galaxies with broad band photometry alone. The low-metallicity class is fit with models with a metallicity of less than solar. Interestingly, the mean stellar ages of this population are the oldest of all classes. This suggests that we are able to select the oldest, most metal poor quiescent galaxies at a given redshift from SED shape alone.
4.2 Luminosity and Mass Functions

In Figure 14 we present the rest-frame 1m luminosity functions and stellar mass functions of the different galaxy classes, accounting for volume effects using the Vmax method. This weights each galaxy by 1/Vmax, where Vmax is the maximum volume in which the galaxy may be observed in the spectroscopic survey (?). We use the best-fit stochastic burst model for each galaxy in order to calculate how the apparent magnitude changes as a function of redshift, and therefore the volume in which a galaxy of that SED shape and absolute magnitude would be seen. To avoid being dominated by incompleteness correction, we only show bins where the median visible volume of galaxies in the bin is greater than 60% of the total survey volume. It is important to recall that the spectral synthesis models do not provide a good fit to the dusty star-forming galaxies, low-metallicity galaxies and some of the extreme starbursts and therefore the mass-to-light ratios have greater uncertainties than for other classes, even though for individual galaxies the fit is formally acceptable. This may result in stellar masses and volume corrections that are biased in an unknown way due to the failure of the models to match their colours. We have chosen to present luminosity functions at 1m as this is the normalisation point of the PCA, to avoid model dependent extrapolation. -band luminosity functions are additionally presented in Appendix B to facilitate direct comparison with other results in the literature (e.g. ?).
Three populations dominate at high stellar masses in almost equal proportions (): the red-sequence, high mean stellar age blue-cloud (SF3) and dusty star-forming classes. Within the blue-cloud we see the well known trend between mean stellar age and stellar mass. The “normal” blue-cloud class (SF2) dominates the population at masses below , and galaxies in the youngest class (SF1) have predominantly low masses (). Turning to the unusual classes, the mass distribution of the dusty-starforming galaxies closely matches that of the red-sequence galaxies, and is different from any of the other star forming classes. The post-starburst galaxies have predominantly intermediate masses () and their mass distribution is uniquely rather flat. The low-metallicity red-sequence galaxies have a stellar mass function that climbs steadily towards low mass ().
In the right panel we combine all of the quiescent and star-forming classes into two independent luminosity functions, to compare with similar analyses in the literature. We will return to this figure in Section 5.4 below.
5 Discussion

Previous analyses of galaxy SED shapes in broad-band photometric surveys can be split into two categories: SED-fitting and rest-frame colour-colour diagrams. In this paper we have presented a third alternative which allows a fresh look at both interesting populations of galaxies and the ability of spectral synthesis models to fit all SED types.
In this section we discuss the impact that different stellar population models, inclusion of emission lines and changing the dust attenuation law would have on our results and the implications for future improvement of spectral synthesis models and SED-fitting codes. We then summarise the implications of our results for three science topics that could be investigated further using this method.
5.1 BC03 vs. Maraston models
One key difference between some stellar population models is the relative strength of emission from the asymptotic-giant branch (AGB) phase of stellar evolution, which primarily alters the optical-to-NIR flux ratio of galaxies with stars younger than 2 Gyr. Attempts to positively identify AGB features in the NIR of integrated stellar populations have had mixed results [see Kriek et al. (2010) and Zibetti et al. (2013), compared to Melbourne et al. (2012) and Martins et al. (2013)].
In agreement with ?) and ?), we see no evidence for a deviation of colours from those predicted by the BC03 models in post-starburst galaxies (Figure 12 and Table 3), although our SED analysis does not extend as far into the NIR as these two studies. The positive identification of AGB features by both Melbourne et al. (2012) and Martins et al. (2013) are in galaxies with younger mean stellar ages, i.e. star-forming and starburst galaxies. The super-colours can be used to investigate the potential impact of different assumptions about this late stellar evolutionary phase on the SED shapes of galaxies.
In the left panels of Figure 15 we compare the super-colours of the AGB-light BC03 stellar population synthesis models with the AGB-heavy models of ?, hereafter M05). For the purposes of this investigation we focus on simple models with exponentially declining star formation histories with an e-folding time of 1 Gyr, and no dust attenuation. A range of metallicities are shown. As the stellar population ages the overall blue-to-red colour (SC1) does not vary significantly between the two models, but the same is not true for the features measured by SC2 and SC3 (the shape of the 4000Å break region). The largest difference occurs in the normal star-forming galaxies, particularly at sub- and super-solar metallicities. Unfortunately, this region has the least well constrained stellar population balance, and it will be difficult to break the degeneracy between TP-AGB star contribution and star formation history from photometry alone.
The lower panel shows how SC3 increases as metallicity decreases in the red-sequence. The black error bar indicates the mean colour of the low-metallicity class (the error on SC1 is insignificant on this scale). In contrast to the BC03 models, the M05 models reach a high enough value of SC3 to fit the low-metallicity class, although the reason for this difference is unclear. Further testing with realistic star formation histories would be required to see whether M05 models can provide an improved overall fit to this class than the BC03 models, for which a reduced of 17.8 was obtained.
While the BC03 models used in this paper extend down to 1/10th solar, the extreme low metallicity (1/1000th solar) M05 model included in this figure highlights another area where careful interpretation of the SED shapes is needed: at ages larger than 4 Gyr extreme low-metallicity galaxies have SC1/2 colours consistent with a post-starburst population. While the UVJ post-starburst selection method may include low-metallicity quiescent galaxies, the third super-colour allows us to cleanly separate these two interesting populations.
5.2 The impact of nebular emission lines
Narrow emission lines and blue continuum emission can arise from either HII regions in sites of active star formation or from obscured AGN. Their omission during SED fitting has been shown to bias the physical properties of galaxies with very high specific star formation rates (e.g. ?). While nebular continuum emission is not expected to be strong in the optical and NIR wavelength range studied here, strong nebular emission lines may be present. In the central panels of Figure 15 we investigate the impact of line emission on the super-colours, by adding the strongest optical emission lines to the spectra before calculating the observed frame broad band fluxes. The model emission lines were not attenuated by dust, thus giving the maximum possible impact.
The open circles show the impact on the super-colours due to emission from star formation regions. The H line strength was estimated from the number of ionising photons from the UV stellar continuum below 912Å and the hydrogen Balmer series were included up to H assuming Case B recombination line ratios (?). Strong metal lines were included using dust attenuation corrected line ratios observed for local star-forming galaxies of appropriate metallicity from ?) ([O iii], [O ii], [N ii], [S ii]). We observe a small increase in SC1 and SC2 in young galaxies when emission lines from star formation are included. The shift is most significant in SC2 for very young, low metallicity galaxies. Only a small effect is observed on SC3.
The crosses in the central panel of Figure 15 show the effect of emission from obscured (narrow-line) AGN by including a fixed line luminosity independent of the age of the stellar population. We assume a fiducial AGN [O iii] luminosity of L⊙ (?) and include strong metal lines with line ratios typical for narrow line AGN in the local Universe (?). The impact of these lines is most significant on the intermediate age population, causing a small shift in SC1.
Comparing to Figure 8 emission lines are not able to explain the high SC3 values of some of the youngest starbursts, nor are they able to explain the high SC3 values of the low-metallicity class of galaxies (black error bar in Figure 15). However, it is possible that the impact of emission lines is greater at certain redshifts, when the positioning of the filters happens to coincide with the strongest lines. The super-colours provide a new method for investigating this effect in much more detail in the future.
5.3 The impact of the assumed dust attenuation law
In the right hand panel of Figure 15 we investigate the sensitivity of the super-colours to the assumed shape of the dust attenuation law. We compare the colours of the exponentially declining model attenuated using the ?, CF00) prescription employed in the stochastic burst models and by the ?) attenuation law. This latter attenuation law lies at the grey end of the range of attenuation laws found in local star-forming galaxies (?), but is generally used for high-redshift galaxies. Note that the CF00 prescription is parameterised by the effective optical depth in the -band towards stars younger than years, which is independent of mean stellar age of the population. On the other hand, the Calzetti prescription is parameterised by the effective optical depth in the -band towards all stars. This makes it difficult to directly compare the evolution in colours for a fixed dust content over a wide age range. For old stellar populations, the Calzetti value is a factor of 3 lower than the CF00 value for the same amount of dust. As the dusty-starforming class has an old mean stellar age, we normalise the attenuation laws to best compare the oldest populations. At younger ages, the Calzetti attenuated models will have lower effective attenuation than the CF00 attenuated models.
In the upper right panel of Figure 15 we can clearly see the dust-age degeneracy, with dustier star-forming galaxies moving to lower SC1 values at all ages. Interestingly, the Calzetti attenuation law has a much larger impact on the SC2 values than the CF00 attenuation law. In the lower panel, we see the dust-metallicity degeneracy, with dustier galaxies moving to lower SC3 at all ages.
In Section 4 we noted that the mean SED of the dusty star-forming class of galaxies was not well fit by the stochastic burst models with the CF00 dust attenuation. The black error bar in these figures shows their mean super-colours. The models attenuated by the Calzetti law provide a good match in all three super-colours for a single model (2 Gyr, 2.5, =1.2). While this does not advocate the use of the Calzetti dust attenuation law for all blue-sequence galaxies in the high-redshift Universe, it does show that constraints might be placed on the shape of the attenuation law for certain classes of galaxies. It is possible that the slightly greyer attenuation law is preferred for the high-metallicity, old, dusty galaxies, because the high dust column densities will lead to observed optical depths close to unity over a wide range of wavelengths.
5.4 The fraction of quiescent galaxies
The evolving fraction of quiescent galaxies with redshift is a key constraint on galaxy evolution models. Observationally this measurement has been approached in two ways, using rest-frame colour selection (e.g. ??) or results from SED-fitting (e.g. ?). In Section 4.2 and Figure 14 we presented the super-colour version of the red-blue bimodal mass function. The blue cloud mass function is composed of all of our star-forming classes, including the dusty star-forming galaxies. The red sequence mass function combines the red, post-starburst and low-metallicity classes. From this we calculate that quiescent galaxies account for 45% of galaxies at high masses (), declining steadily to 25% by and 13% at .
This result contrasts significantly with ?), who finds a quiescent fraction of around 80% at and similar redshifts () in the COSMOS field. They also find a declining fraction with stellar mass, although only reaching 20% at . On the other hand, our results are in better agreement with those of ?) using the PRIMUS survey who find an almost constant fraction of quiescent galaxies, at a little over 50%, at masses of .
The difference between these results may in part be due to cosmic variance, as well as differences in how stellar masses are measured. The super-colour diagrams present a competitive way to measure a robust quiescent fraction, properly accounting for dust attenuation, as well as errors in the quantification of the SED shape caused by incomplete sampling of the wavelength range afforded by broad band filters.
5.5 Post-starburst galaxies
The clearest class of unusual galaxies identified in the super-colours are the post-starburst galaxies. The excess of A and F stars in this class gives rise to both the unique SED shape with the strong Balmer break, and strong Balmer absorption lines that are traditionally used to select these galaxies from spectroscopic surveys77 7 Often spectral selection of post-starbursts requires them to have no emission lines, but this causes an unwanted bias against galaxies with narrow-line (obscured) AGN (?), which are more prevalent in post-starburst galaxies than other classes (?), and also against galaxies where the starburst decays more slowly than a function. Selection on stellar continuum shape provides a more complete sample than selection on emission lines, but has only become possible since good spectrophotometric calibration has become standard in modern spectral surveys.. In Section 3.1 we defined the demarcation line between the post-starburst and red-sequence galaxies by comparing spectral indices measured from available optical spectra in the UDSz survey with a previous analysis of VVDS spectra by WWJ09 (see also Appendix A). This ensures that our photometric selection is similar to the WWJ09 sample, although we noted that it may extend to slightly older ages. SED fitting does not tightly constrain the mean burst mass fraction of the super-colour selected post-starbursts (Figure 13), but the probability distribution function is consistent with a value larger than 10%, similar to that measured by WWJ09.
WWJ09 detected 16 post-starburst galaxies with at , giving a number density of Mpc-3. In this paper, using photometric detection in the UDS field (covering a very similar survey volume to the VVDS), we detect 69 post-starburst galaxies with at and measure a slightly lower number density of . Assuming Poisson errors alone, we find fewer post-starburst galaxies at than at at a significance of around 2. Allowing for cosmic variance and the large completeness corrections involved in the analysis of the spectroscopic VVDS survey, together with the uncertainty in the relative positioning of the demarcation line separating post-starburst galaxies from blue and red-sequence in spectroscopic and photometric surveys, erodes the significance of this discrepancy. Overall we conclude that, while we tentatively detect an increase in the number of post-starburst galaxies between a mean redshift of 1 and 0.7, this is not significant within the errors.
?) used the narrow-band NEWFIRM survey to detect “young quiescent”/post-starburst galaxies using a traditional UVJ colour selection, finding a number density of Mpc-3 at and factor of 10 decrease in numbers between and . However, the mass limit of their sample () is an order of magnitude higher than in the VVDS and UDS surveys studied here. For an equivalent mass limit (using the same IMF) we find 10 post-starburst galaxies and a number density of Mpc-3, which is significantly lower. However, this is not surprising, as in Section 3.3 we showed that ?) include a large fraction of galaxies that we class as red-sequence, based on comparison to optical spectra.
5.6 Low metallicity quiescent galaxies
A new class of objects identified by their third super-colour are the metal poor quiescent galaxies (Figure 8). These are of potential interest, because a 4 Gyr old galaxy at has a formation time at . It opens the intriguing possibility that the detection of metal-poor quiescent galaxies at could provide useful constraints on the properties of the very first generation of galaxies, complementary to attempts at direct detection using their blue UV slopes ( ) at (e.g. ??).
This class of galaxies does not contribute significantly to the red sequence luminosity or mass functions except at the very lowest masses (Figure 14), and they are indistinguishable from red-sequence galaxies in traditional colour-colour diagrams.
Fitting BC03 stochastic burst models to the stacked SED of this class shows that they have sub-solar metallicities and mean stellar ages of Gyr. There are several possibilites for the poor fit of the BC03 stochastic burst models to this class of objects. Firstly it is possible that the models simply do not reach low enough metallicities (the lowest metallicity is 1/10th solar). There could be missing components in the stellar library and/or evolutionary tracks. The M05 models have the higher SC3 values required, although the old ages of these galaxies mean that the TP-AGB phase is unlikely to be responsible for this. Alternatively the stochastic burst models do not have the correct star-formation histories to describe these populations. On the other hand, we found no significant colour difference between Salpeter and Chabrier initial mass functions. We also investigated the possibility that these objects were contaminants with incorrect photometric redshifts, by removing objects with very poorly constrained photometric redshifts. The physical parameters of the sample did not alter significantly, and the reduced increased, indicating that incorrect redshifts are not the cause. Ultimately, follow-up spectroscopy is needed to confirm the nature of this class of objects.
6 Summary and Conclusions
In this paper we developed a new method to study the SED shapes of galaxies, allowing comparison between galaxies at different redshifts while retaining independence from spectral synthesis models. The aim was to develop a method that allowed us to: (i) stack SEDs of galaxies at different redshifts with the same SED shapes to better constrain mean physical properties; (ii) compare observed colours of galaxies without relying on the spectral synthesis models to be accurate, unlike traditional K-corrections; (iii) easily visualise loss of information and biases caused by the incomplete sampling of the rest-frame SED as a function of redshift and SED shape; (iv) investigate the potential of broad band photometric datasets for revealing unusual classes of galaxies.
Application to the UDS field for galaxies results in a very clean and tight red-sequence, and a blue-cloud that is extended primarily by mean-stellar age and dust content. Metallicity is orthogonal to the age-dust super-colour, meaning metallicity can be constrained for blue-sequence galaxies for an assumed star formation history and set of stellar population models. The reddest end of the blue-sequence is comprised of extremely dusty galaxies that are also metal rich and with old mean stellar ages. A strong post-starburst population stands out clearly in SED colour space, providing a clean method to identify galaxies which have recently undergone a massive starburst (% by mass) which has quenched, without the need for expensive spectroscopy.
We found that the BC03 spectral synthesis models provide a good description of the SED shapes for the vast majority of galaxies, meaning that rest-frame optical-to-NIR broad band photometry is not sufficient to distinguish more complex star formation histories and dust attenuation laws than used here. However, we also identified some SED shapes that are not well covered by the models: low metallicity dwarf quiescent galaxies and massive dusty star-forming galaxies. Here we summarise our conclusions.
- •
In modern multiwavelength broad-band photometric surveys with a wide wavelength coverage, the sparse sampling of galaxy SEDs caused by the redshifts of the galaxies does not necessarily cause a dramatic loss of information on their underlying SED shape. We show that, with currently available bands in the UDS, SED shapes can be recovered robustly in the redshift ranges of and .
- •
Broad-band multiwavelength photometry can detect post-starburst galaxies with similar properties to those detected in high-redshift spectroscopic surveys such as the VVDS. We detect a similar number density of post-starbursts more massive than between (UDS, this paper) and (VVDS, WWJ09).
- •
Dusty star-forming galaxies can be uniquely identified, but by selection they are high-metallicity (2 Z⊙), old (mass-weighted mean age 2 Gyr) and very dusty (total effective optical depth 3, approximately equivalent to a observed optical depth to the stellar continuum of 1). These galaxies have a mass function that is close to the red-sequence population in shape, however, we emphasise that this is purely a selection bias as only highest-metallicity, oldest, and dustiest galaxies are distinguishable to the red end of the blue-cloud.
- •
For the dustiest star-forming class we find better consistency with models attenuated by dust using the ?) dust attenuation law than with the ?) law. This does not support the use of the Calzetti law for all high-redshift star-forming galaxies, however. For extremely dusty galaxies a greyer dust attenuation curve may be caused by the high opacities to all stars at all wavelengths.
- •
We tentatively identify a new class of very low-metallicity quiescent galaxies, which have lower luminosities and masses than typical red-sequence galaxies. This class is not distinguishable using traditional colour-colour diagrams.
Broad band photometry contains considerable information about the physical properties of galaxies, but simple K-corrected rest-frame colour-colour diagrams fail to capture a significant fraction of the information and can be biased by poor model fits. Physical properties derived from SED fitting are prior dependent, and physical properties will be biased when models do not fit the SED shape of the data. Such biases are difficult to spot when errors on individual galaxies are large, and individual galaxies are fit in isolation with no way to group objects with similar properties prior to fitting. The method presented here provides a complementary approach to visualise the SED shapes of galaxy populations, allowing the stacking of populations with the same SED shapes. We have shown it to be useful in identifying populations with interesting physical properties, as well as identifying areas where the spectral synthesis models need some improvement.
acknowledgements
UKIDSS uses the UKIRT Wide Field Camera (WFCAM ?). The photometric system is described in ?), the calibration is described in ?) and the science archive is described in ?). We are indebted to the staff at UKIRT for their tireless efforts in the face of very difficult circumstances.
V. W. acknowledges support from the European Research Council Starting Grant (P.I. V. Wild), European Research Council Advanced Grant (P.I. J. Dunlop) and European Career Re-integration Grant (P.I. V. Wild). J. S. D. acknowledges support from the European Research Council Advanced Grant (P.I. J. Dunlop). R. M. acknowledges support from the European Research Council Consolidator Grant (P.I. R. McLure). JSD also acknowledges the contribution of the EC FP7 SPACE project ASTRODEEP (Ref.No: 312725). This work was supported in part by the National Science Foundation under Grant No. PHYS-1066293 and the hospitality of the Aspen Center for Physics. We would like to thank Claudia Maraston for providing us with low metallicity stellar population synthesis models, Paula Coelho for help identifying the FeMg absorption feature in quiescent galaxy spectra, Stéphane Charlot, Tim Heckman and Henry McCracken for initial encouragement to pursue this work, and the anonymous referee for providing a very detailed review that helped to improve the clarity of the paper.
Bibliography
- Acquaviva V., Gawiser E., Guaita L., 2011, ApJ, 737, 47
- Allen J. T., Hewett P. C., Richardson C. T., Ferland G. J., Baldwin J. A., 2013, MNRAS, 430, 3510
- Berk D. E. V., Shen J., Yip C.-W., et al., 2006, AJ, 131, 84
- Berta S., Lutz D., Santini P., et al., 2013, A&A, 551, 100
- Bessell M. S., 1990, PASP, 102, 1181
- Bolzonella M., Miralles J.-M., Pelló R., 2000, A&A, 363, 476
- Bouwens R. J., Illingworth G. D., Oesch P. A., et al. 2010, ApJL, 708, L69
- Bowler R. A. A., Dunlop J. S., McLure R. J., et al., 2012, MNRAS, 426, 2772
- Bradshaw E. J., Almaini O., Hartley W. G., et al., 2013, MNRAS, 433, 194
- Bruzual G., Charlot S., 2003, MNRAS, 344, 1000
- Calzetti D., Armus L., Bohlin R. C., Kinney A. L., Koornneef J., Storchi-Bergmann T., 2000, ApJ, 533, 682
- Casali M., Adamson A., de Oliveira C. A., et al., 2007, A&A, 467, 777
- Charlot S., Fall S. M., 2000, ApJ, 539, 718
- Cirasuolo M., McLure R. J., Dunlop J. S., Almaini O., Foucaud S., Simpson C., 2010, MNRAS, 401, 1166
- Cirasuolo M., McLure R. J., Dunlop J. S., et al., 2007, MNRAS, 380, 585
- Connolly A. J., Genovese C., Moore A. W., Nichol R. C., Schneider J., Wasserman L., 2000, arXiv:astro-ph/0008187
- Connolly A. J., Szalay A. S., 1999, AJ, 117, 2052
- Connolly A. J., Szalay A. S., Bershady M. A., Kinney A. L., Calzetti D., 1995, AJ, 110, 1071
- Conroy, C. 2013, ARAA, 51, 393
- Curtis-Lake E., McLure R. J., Pearce H. J., et al., 2012, MNRAS, 422, 1425
- da Cunha E., Charlot S., Elbaz D., 2008, MNRAS, 388, 1595
- Dale D. A., de Paz A. G., Gordon K. D., et al., 2007, ApJ, 655, 863
- Dunlop J. S., McLure R. J., Robertson B. E., Ellis R. S., Stark D. P., Cirasuolo M., de Ravel L., 2012, MNRAS, 420, 901
- Fukugita M., Ichikawa T., Gunn J. E., Doi M., Shimasaku K., Schneider D. P., 1996, AJ, 111, 1748
- Furusawa H., Kosugi G., Akiyama M., et al., 2008, ApJS, 176, 1
- Gallazzi A., Charlot S., Brinchmann J., White S. D. M., Tremonti C. A., 2005, MNRAS, 362, 41
- Glazebrook K., Offer A. R., Deeley K., 1998, ApJ, 492, 98
- Hambly N. C., Collins R. S., Cross N. J. G., et al., 2008, MNRAS, 384, 637
- Heavens A. F., Jimenez R., Lahav O., 2000, MNRAS, 317, 965
- Heckman T. M., Kauffmann G., Brinchmann J., Charlot S., Tremonti C., White S. D. M., 2004, ApJ, 613, 109
- Hewett P. C., Warren S. J., Leggett S. K., Hodgkin S. T., 2006, MNRAS, 367, 454
- Hodgkin S. T., Irwin M. J., Hewett P. C., Warren S. J., 2009, MNRAS, 394, 675
- Ilbert O., McCracken H. J., Fèvre O. L., et al., 2013, A&A, 556, 55
- Kauffmann G., Heckman T. M., White S. D. M., et al., 2003, MNRAS, 341, 33
- Kewley L. J., Groves B., Kauffmann G., Heckman T., 2006, MNRAS, 372, 961
- Kriek M., Labbé I., Conroy C., Whitaker K. E., et al., 2010, ApJL, 722, L64
- Lane K. P., Almaini O., Foucaud S., et al., 2007, MNRAS, 379, L25
- Lawrence A., Warren S. J., Almaini O., et al., 2007, MNRAS, 379, 1599
- Lu H., Zhou H., Wang J., Wang T., Dong X., Zhuang Z., Li C., 2006, AJ, 131, 790
- McLure R. J., Pearce H. J., Dunlop J. S., et al., 2013, MNRAS, 428, 1088
- Madgwick D. S., Somerville R., Lahav O., Ellis R., 2003, MNRAS, 343, 871
- Maraston C., 2005, MNRAS, 362, 799
- Martins L. P., Rodríguez-Ardila A., Diniz S., Gruenwald R., de Souza R., 2013, MNRAS, 431, 1823
- Melbourne J., Williams B. F., Dalcanton J. J., et al., 2012, ApJ, 748, 47
- Moustakas J., Coil A. L., Aird J., et al., 2013, ApJ, 767, 50
- Murtagh F., Heck A., 1987, Multivariate data analysis, ISBN 90-277-2425-3, Springer-Verlag Berlin Heidelberg
- Noll S., Burgarella D., Giovannoli E., Buat V., Marcillac D., Muñoz-Mateos J. C., 2009, A&A, 507, 1793
- Osterbrock D. E., Ferland G. J., 2006, Astrophysics of gaseous nebulae and active galactic nuclei, 2nd. ed., Sausalito CA: University Science Books
- Pacifici C., Charlot S., Blaizot J., Brinchmann J., 2012, MNRAS, 421, 2002
- Rudnick G., Rix H.-W., Franx M., Labbé I., et al., 2003, ApJ, 599, 847
- Salim S., Rich R. M., Charlot S., et al., 2007, ApJS, 173, 267
- Schaerer D., de Barros S., 2009, A&A, 502, 423
- Schmidt M., 1968, ApJ, 151, 393
- Simpson C., Rawlings S., Ivison R., et al., 2012, MNRAS, 421, 3060
- Tojeiro R., Heavens A. F., Jimenez R., Panter B., 2007, MNRAS, 381, 1252
- Tokunaga A. T., Simons D. A., Vacca W. D., 2002, PASP, 114, 180
- Ueda Y., Watson M. G., Stewart I. M., et al., 2008, ApJS, 179, 124
- Walcher J., Groves B., Budavári T., Dale D., 2011, Astrophysics and Space Science, 331, 1
- Whitaker K. E., Kriek M., van Dokkum P. G., Bezanson R., Brammer G., Franx M., Labbé I., 2012, ApJ, 745, 179
- Whitaker K. E., Labbé I., van Dokkum P. G., et al., 2011, ApJ, 735, 86
- Wild V., Charlot S., Brinchmann J., Heckman T., Vince O., Pacifici C., Chevallard J., 2011, MNRAS, 417, 1760
- Wild V., Heckman T., Charlot S., 2010, MNRAS, 405, 933
- Wild V., Hewett P. C., 2005, MNRAS, 358, 1083
- Wild V., Kauffmann G., Heckman T., Charlot S., Lemson G., Brinchmann J., Reichard T., Pasquali A., 2007, MNRAS, 381, 543
- Wild V., Walcher C. J., Johansson P. H., Tresse L., Charlot S., Pollo A., Fèvre O. L., de Ravel L., 2009, MNRAS, 395, 144
- Williams R. J., Quadri R. F., Franx M., van Dokkum P., Labbé I., 2009, ApJ, 691, 1879
- Wong O. I., Schawinski K., Kaviraj S., et al., 2012, MNRAS, 420, 1684
- Wuyts S., Labbé I., Franx M., et al., 2007, ApJ, 655, 51
- Yan R., Newman J. A., Faber S. M., Konidaris N., Koo D., Davis M., 2006, ApJ, 648, 281
- Yip C. W., Connolly A. J., Berk D. E. V., et al., 2004, AJ, 128, 2603
- York D. G., Adelman J., Anderson J., et al., 2000, AJ, 120, 1579
- Zibetti S., Gallazzi A., Charlot S., Pierini D., Pasquali A., 2013, MNRAS, 428, 1479
Appendix A Post-starburst spectra in the UDSz


In Figure 16 we show the spectra of the five super-colour selected post-starburst galaxies which have UDSz spectra. In the left panel the full wavelength range of the spectra is shown and in the right panel we focus on the region over which the spectral indicies are measured. The bottom spectrum has been observed with the FORS instrument, and the resolution has been downgraded to match that of the VIMOS observations. Overplotted is the reconstructed spectra using the first three VVDS spectral indices, and in Table 4 are the IDs, positions, redshifts and VVDS spectral indices for these objects. All spectra have sufficient SNR that the PCA spectral indices developed in ?) for VVDS spectra can be measured on individual objects as well as on the stacked spectrum, although unfortunately the strength of the more traditional H absorption line is not robustly constrained. We find that 4/5 would have been classified as a post-starburst galaxy by ?). The final one lies closer to the spectroscopically defined red-sequence, which is consistent with its slightly redder super-colours.
| UDSz-ID | RA | Dec | SC1 | SC2 | SC3 | PC1VVDS | PC2VVDS | ||
|---|---|---|---|---|---|---|---|---|---|
| 39205 | 34.536512 | -5.1441217 | 0.98 | 1.01 | -3.50 | 4.90 | -0.10 | -0.110.04 | 0.850.04 |
| 46929 | 34.538982 | -5.0721098 | 1.05 | 1.06 | -1.70 | 6.90 | 0.30 | 0.170.08 | 0.740.09 |
| 45319 | 34.308255 | -5.0884575 | 1.17 | 1.15 | 0.10 | 5.10 | 0.20 | -0.020.10 | 0.830.09 |
| 64155 | 34.409449 | -4.9054747 | 1.15 | 1.17 | -2.50 | 7.40 | 0.70 | -0.170.1 | 1.30.1 |
| 63906 | 34.704012 | -4.9078703 | 1.16 | 1.17 | -11.00 | 4.20 | 0.90 | 0.870.07 | 0.370.06 |
Appendix B The K-band luminosity function
In the main paper we present rest-frame 1m luminosities, which are within the observed wavelength range of the data, and therefore do not require extrapolation using spectral synthesis models. To enable direct comparison with previous work we provide here the rest-frame K-band luminosity function of each class, with K-band luminosity of each galaxy extrapolated using the best-fit BC03 stochastic burst spectral synthesis models to the first three super-colours of each galaxy.
