Southern class I methanol masers at 36 and 44 GHz
Abstract
The Australia Telescope Compact Array (ATCA) has been used for high angular resolution imaging of 71 southern class I methanol maser sources quasi-simultaneously at 36 and 44 GHz. The data reveal a high level of morphological and kinematical complexity, and allow us to demonstrate associations, at arcsecond precision, of the class I maser emission with outflows, expanding Hii regions, dark clouds, shocks traced by the 4.5-m emission and 8.0-m filaments. More than 700 maser component features were found at each of the two methanol transitions, but with only 23 per cent recognisable at both transitions; the morphology of class I emission is much better revealed by our survey of both transitions, compared with either one alone. We found that the number of masers falls exponentially with the projected linear distance from the associated class II 6.7-GHz methanol maser. This distribution has a scale of 26315 mpc, irrespective of the transition. The class I masers associated with OH masers were found to have a tendency to be more spread out, both spatially and in the velocity domain. This is consistent with the expectation that such sources are more evolved. Apart from a small number of high-velocity components (which are largely blue-shifted and predominantly seen at 36 GHz), the velocity distribution was found to be Gaussian, peaking near the systemic velocity of the region, which had been estimated as the middle of the velocity interval of the associated class II methanol maser at 6.7 GHz. The mean indicated a small, but significant blue shift asymmetry of 0.57 km s-1 (uncertainties are 0.06 and 0.07 km s-1 for the 36- and 44-GHz masers, respectively) with respect to the 6.7-GHz masers. The standard deviation of the velocity distribution was found to be 3.650.05 and 3.320.07 km s-1 for the 36- and 44-GHz masers, respectively. We also suggest a refined rest frequency value of 36169.2380.011 MHz for the 430 E methanol transition.
Keywords:
masers – ISM: molecules – stars: formation – ISM: Hii regions – ISM: jets and outflows – ISM: photodissociation region (PDR)1 Introduction
Methanol masers are common phenomena in the regions of active star formation, with more than twenty different centimetre and millimetre wavelength maser transitions discovered to date (Müller, Menten & Mäder, Müller et al.2004, e.g.,). Early studies have empirically divided methanol maser transitions into two classes based on the observed spatial distribution (Batrla et al., 1987, e.g.,). Class I methanol masers (e.g. the most widespread masers at 36 and 44 GHz) usually occur in multiple locations across the star forming region and are often scattered around an area up to 1 parsec in linear extent (Kurtz et al., 2004; Voronkov et al., 2006; Cyganowski et al., 2009, e.g.,). In contrast, the class II methanol masers (e.g. well-known masers at 6.7-GHz) reside in close proximity to individual young stellar objects (YSOs) and are rarely found in multiple locations across the star forming region at arcsec resolution (Caswell, 1997; Phillips et al., 1998; Walsh et al., 1998, e.g.,). Exclusively associated with high-mass star formation (see, e.g., Breen et al. (2013) and references therein), class II methanol masers are, therefore, excellent signposts of the exact location of high-mass YSOs. In this capacity, they have been the subject of numerous observational studies in the last two decades, which culminated in the Methanol Multibeam survey (Green et al., 2009; Caswell et al., 2010; Caswell et al., 2011a; Green et al., 2012a, MMB; e.g.,) providing the most accurate systematic census to date of the 6.7-GHz masers visible from the southern hemisphere, including measurement of their absolute positions with arcsecond accuracy. It is worth noting that the empirical classification of methanol maser transitions and the drastically different observational properties are now well understood through modelling of maser pumping (Cragg et al., 1992; Voronkov et al., 2005a, e.g.,). These models strongly suggest that the class I masers are pumped via collisions with molecular hydrogen, in contrast to the class II masers which are pumped by infrared radiation (Sobolev & Deguchi, 1994; Voronkov et al., 2006, see also).
To date, a few hundred class I methanol maser sources are known, but the majority still have only single dish data (Voronkov et al., 2012, for more details, see the review by). The major published interferometric surveys are those by Kurtz et al. (2004) and Cyganowski et al. (2009), which together provided maps for 56 mostly northern class I methanol masers at 44 GHz. Seven additional 44-GHz masers were imaged by Kogan & Slysh (1998), but phase referencing was not used in their experiment making the absolute positions uncertain. The reported interferometric observations of the 36-GHz methanol transition are scarce and limited to single source papers only (Sjouwerman et al., 2010; Voronkov et al., 2010a; Fish et al., 2011; Yusef-Zadeh et al., 2013). At the frequencies of these molecular transitions the beam size of a 20-m class single dish is comparable to the typical angular spread of the class I maser emission (Kurtz et al., 2004; Voronkov et al., 2006, e.g.,). Therefore, interferometric observations, which allow us to measure accurate positions (and also to correct for the beam attenuation to the first order), are required even for meaningful detection statistics. A search for associations with other phenomena that are commonly observed in the crowded environment of high-mass star forming regions is another important application of interferometric observations.
The majority of the class I masers are believed to trace interface regions of outflows, although direct observational evidence of this has only been obtained at high angular resolution for a limited number of sources (Kurtz et al., 2004; Voronkov et al., 2006; Cyganowski et al., 2012, e.g.,). Also based on interferometric data, alternative scenarios have been demonstrated to occur in some sources, in particular the class I masers have been shown to arise due to cloud-cloud collisions (Sjouwerman et al., 2010) and due to interaction of expanding Hii regions with the ambient molecular gas (Voronkov et al., 2010b; Cyganowski et al., 2012). The common feature of all these scenarios is the presence of shocked gas. Weak shocks are known to greatly enhance the methanol abundance by facilitating methanol release from dust grain mantles into the gas phase through heating (Hartquist et al., 1995; Gibb & Davis, 1998; Garay et al., 2002a, e.g.,). At the same time, the shocks compress and heat up the gas, which is usually considered to be a favourable condition for the pumping of the class I methanol masers due to an increased rate of collisions between methanol and hydrogen molecules. Therefore, as discussed by Voronkov et al. (2010b), the class I masers should be treated as merely shock tracers, where shocks could be caused by a range of phenomena. It is worth noting that Yusef-Zadeh et al. (2013) suggested an alternative methanol production mechanism due to cosmic rays and molecular gas interactions. This mechanism is most likely specific to the inner few hundred pc of the Galaxy (known as the central molecular zone).
In addition to the maser interferometry, in depth study of the morphology requires comparison datasets of similar angular resolution. The outflow identifications mentioned above (Kurtz et al., 2004; Voronkov et al., 2006) relied upon the images of the 2.12-m molecular hydrogen emission, which is a well-known shock tracer (Habart et al., 2005). However, such data are significantly affected by extinction and have a quality sufficient for meaningful interpretation (Brooks et al., 2003, e.g. as in) for only a handful of sources. In contrast, the images obtained with the Spitzer Space Telescope’s Infrared Array Camera (IRAC) are now available for the majority of known class I masers. It was shown by Cyganowski et al. (2009) that the class I maser emission is often associated with the extended features showing a prominent excess in the 4.5-m emission band in the Spitzer images. These features are also known as extended green objects (Cyganowski et al., 2009, EGOs;) or ‘green fuzzies’ (Chambers et al., 2009) because of the colour usually used to represent the 4.5-m emission in three-colour IRAC images. The excess of emission in this band is generally attributed to increased contribution from the emission of molecular hydrogen and carbon monoxide excited in shocks (Chambers et al., 2009; Cyganowski et al., 2009; De Buizer & Vacca, 2010, e.g.,). Other noteworthy structures often present in IRAC images include the 8.0-m filaments and bubbles (Churchwell et al., 2006, e.g.,). This IRAC band contains emission features of polycyclic aromatic hydrocarbons (PAHs), which often trace photodissociation regions (PDRs) around Hii regions, although near hot stars the emission in this band may be dominated by thermal dust emission with little or no contribution from PAHs (Watson et al., 1998, e.g.,).
In this paper, we present an interferometric survey at both 36 and 44 GHz of 71 southern class I masers, and attempt to interpret the observed morphologies. These are the strongest and the most common class I maser transitions, which belong to two different transition series (Voronkov et al., 2012, see). We also present a basic statistical analysis of observed maser properties. Note that this is the largest interferometric survey of common class I methanol masers available to date, and the first of this kind in the southern hemisphere. In addition, this is the first observation at 36 GHz for the majority of our targets and the first high angular resolution study of a large number of 36-GHz masers.
2 Observations
| Source | Pointing centre | 36 GHz | 44 GHz | |||||
|---|---|---|---|---|---|---|---|---|
| name | Observation | Velocity | Observation | Velocity | ||||
| date | noise | range | date | noise | range | |||
| (h:m:s) | (°:arcmin:arcsec) | (year 2007) | (mJy) | (km s-1) | (year 2007) | (mJy) | (km s-1) | |
| G269.151.13 | 09:03:34.2 | 48:28:04 | May 21 | 77 | 24, 35 | May 20 | 110 | 17, 32 |
| G270.260.84 | 09:16:37.6 | 47:56:10 | May 21 | 70 | 24, 35 | May 20 | 100 | 17, 31 |
| G294.981.73 | 11:39:12.6 | 63:28:47 | May 21 | 92 | 35, 24 | May 20 | 86 | 30, 18 |
| G300.971.15 | 12:34:52.5 | 61:40:02 | May 21 | 57 | 74, 14 | May 20 | 97 | 62, 13 |
| G301.140.23 | 12:35:34.3 | 63:02:38 | May 21 | 59 | 73, 14 | May 20 | 92 | 61, 13 |
| G305.210.21 | 13:11:09.6 | 62:34:41 | May 21 | 57 | 71, 12 | May 20 | 81 | 59, 10 |
| G305.250.25 | 13:11:32.7 | 62:32:03 | May 21 | 61 | 71, 12 | May 20 | 84 | 59, 10 |
| G305.370.21 | 13:12:33.8 | 62:33:25 | May 21 | 65 | 71, 12 | May 20 | 97 | 58, 10 |
| G309.380.13 | 13:47:26.0 | 62:18:12 | May 25 | 65 | 94, 35 | May 24 | 100 | 91, 43 |
| G316.760.01 | 14:44:56.2 | 59:48:12 | May 21 | 61 | 63, 4 | May 20 | 87 | 51, 2 |
| G318.050.09 | 14:53:42.6 | 59:09:01 | May 23 | 69 | 54, 46 | May 22 | 136 | 54, 46 |
| G318.950.20 | 15:00:53.2 | 58:59:06 | May 21 | 54 | 62, 2 | May 20 | 84 | 49, 1 |
| G320.290.31 | 15:10:18.8 | 58:25:25 | May 23 | 80 | 74, 56 | May 22 | 140 | 74, 56 |
| G322.160.64 | 15:18:40.5 | 56:38:46 | May 25 | 66 | 86, 27 | May 24 | 110 | 83, 35 |
| G323.740.26 | 15:31:46.0 | 56:30:59 | May 25 | 70 | 85, 26 | May 24 | 120 | 82, 33 |
| G324.720.34 | 15:34:58.0 | 55:27:28 | May 25 | 77 | 84, 25 | May 24 | 120 | 81, 33 |
| G326.480.70 ∗ | 15:43:16.3 | 54:07:17 | May 23 | 110 | 68, 21 | May 22 | 190 | 54, 36 |
| G326.640.61 ∗ | 15:44:32.7 | 54:05:31 | May 23 | 82 | 74, 15 | May 22 | 150 | 66, 17 |
| G326.660.57 ∗ | 15:44:48.9 | 54:06:49 | May 23 | 70 | 74, 15 | May 22 | 140 | 66, 17 |
| G326.860.68 | 15:51:14.2 | 54:58:05 | May 23 | 88 | 90, 31 | May 22 | 160 | 92, 44 |
| G327.290.58 ∗ | 15:53:06.2 | 54:37:06 | May 23 | 79 | 73, 14 | May 22 | 150 | 65, 16 |
| G327.390.20 | 15:50:18.5 | 53:57:06 | May 23 | 88 | 123, 64 | May 22 | 170 | 113, 64 |
| G327.620.11 | 15:52:50.2 | 54:03:01 | May 23 | 68 | 123, 64 | May 22 | 180 | 112, 64 |
| G328.210.59 ∗ | 15:57:54.8 | 54:02:13 | May 23 | 80 | 67, 20 | May 22 | 120 | 59, 21 |
| G328.240.55 ∗ | 15:57:58.3 | 53:59:17 | May 23 | 77 | 73, 14 | May 22 | 150 | 64, 16 |
| G328.250.53 ∗ | 15:57:59.8 | 53:57:59 | May 23 | 81 | 73, 14 | May 22 | 140 | 64, 16 |
| G328.810.63 ∗ | 15:55:48.5 | 52:43:19 | May 23 | 82 | 73, 14 | May 22 | 150 | 64, 16 |
| G329.030.20 ∗ | 16:00:31.1 | 53:12:37 | May 23 | 77 | 72, 13 | May 22 | 160 | 64, 15 |
| G329.070.31 ∗ | 16:01:08.9 | 53:16:08 | May 23 | 83 | 72, 13 | May 22 | 120 | 64, 16 |
| G329.180.31 | 16:01:47.0 | 53:11:44 | May 25 | 82 | 81, 22 | May 24 | 120 | 78, 30 |
| G329.470.50 | 15:59:40.7 | 52:23:28 | May 23 | 79 | 89, 30 | May 22 | 140 | 91, 43 |
| G331.130.24 | 16:10:59.9 | 51:50:39 | May 23 | 70 | 120, 62 | May 22 | 160 | 110, 62 |
| G331.340.35 | 16:12:26.3 | 51:46:13 | May 23 | 97 | 87, 28 | May 22 | 150 | 90, 41 |
| G331.440.19 | 16:12:12.5 | 51:35:10 | May 23 | 83 | 121, 61 | May 22 | 190 | 110, 62 |
| G332.300.09 | 16:15:45.4 | 50:55:54 | May 25 | 83 | 79, 20 | May 24 | 170 | 76, 28 |
| G332.600.17 | 16:17:29.3 | 50:46:12 | May 25 | 79 | 79, 20 | May 24 | 130 | 76, 28 |
| G332.940.69 | 16:21:19.0 | 50:54:10 | May 25 | 68 | 79, 20 | May 24 | 120 | 76, 27 |
| G332.960.68 | 16:21:22.9 | 50:52:59 | May 25 | 73 | 79, 20 | May 24 | 130 | 76, 27 |
| G333.030.06 ∗ | 16:18:56.7 | 50:23:54 | May 23 | 61 | 70, 11 | May 22 | 140 | 61, 13 |
| G333.130.44 | 16:21:03.3 | 50:35:50 | May 25 | 80 | 79, 20 | May 24 | 140 | 76, 27 |
| G333.130.56 | 16:21:35.7 | 50:40:51 | May 25 | 77 | 79, 20 | May 24 | 160 | 76, 27 |
| G333.160.10 | 16:19:42.7 | 50:19:53 | May 25 | 54 | 129, 69 | May 24 | 130 | 123, 75 |
| G333.180.09 | 16:19:45.6 | 50:18:35 | May 23 | 71 | 119, 60 | May 22 | 170 | 109, 60 |
| Source | Pointing centre | 36 GHz | 44 GHz | |||||
|---|---|---|---|---|---|---|---|---|
| name | Observation | Velocity | Observation | Velocity | ||||
| date | noise | range | date | noise | range | |||
| (h:m:s) | (°:arcmin:arcsec) | (year 2007) | (mJy) | (km s-1) | (year 2007) | (mJy) | (km s-1) | |
| G333.230.06 | 16:19:51.3 | 50:15:14 | May 23 | 100 | 119, 60 | May 22 | 190 | 109, 60 |
| G333.320.11 ∗ | 16:19:29.0 | 50:04:41 | May 23 | 84 | 70, 10 | May 22 | 160 | 61, 13 |
| G333.470.16 ∗ | 16:21:20.1 | 50:09:47 | May 23 | 72 | 70, 10 | May 22 | 140 | 61, 13 |
| G333.560.02 ∗ | 16:21:08.7 | 49:59:48 | May 23 | 81 | 70, 10 | May 22 | 140 | 61, 13 |
| G333.590.21 | 16:22:11.1 | 50:06:11 | May 25 | 83 | 79, 19 | May 24 | 120 | 75, 27 |
| G335.060.43 ∗ | 16:29:23.4 | 49:12:20 | May 23 | 85 | 69, 9 | May 22 | 190 | 60, 11 |
| G335.590.29 | 16:30:59.3 | 48:43:47 | May 25 | 88 | 77, 18 | May 24 | 140 | 74, 26 |
| G335.790.17 | 16:29:45.6 | 48:16:16 | May 25 | 84 | 77, 18 | May 24 | 130 | 74, 26 |
| G336.410.26 | 16:34:14.3 | 48:06:22 | May 23 | 81 | 117, 58 | May 22 | 180 | 107, 58 |
| G337.400.40 | 16:38:49.8 | 47:28:18 | May 25 | 75 | 76, 17 | May 24 | 110 | 73, 24 |
| G337.920.46 | 16:41:08.3 | 47:07:56 | May 25 | 73 | 76, 17 | May 24 | 110 | 73, 24 |
| G338.920.55 | 16:40:31.9 | 45:41:53 | May 23 | 120 | 83, 24 | May 22 | 170 | 85, 36 |
| G339.881.26 ∗ | 16:52:04.8 | 46:08:34 | May 23 | 77 | 65, 6 | May 22 | 140 | 57, 8 |
| G341.190.23 | 16:52:15.8 | 44:28:33 | May 25 | 88 | 74, 15 | May 24 | 130 | 71, 22 |
| G341.220.21 | 16:52:18.3 | 44:26:52 | May 25 | 92 | 74, 15 | May 24 | 130 | 71, 22 |
| G343.120.06 ∗ | 16:58:16.4 | 42:52:23 | May 23 | 79 | 64, 4 | May 22 | 160 | 55, 7 |
| G344.230.57 | 17:04:07.8 | 42:18:39 | May 25 | 80 | 47, 12 | May 24 | 130 | 41, 7 |
| G345.000.22 ∗ | 17:05:09.5 | 41:29:04 | May 23 | 99 | 62, 3 | May 22 | 160 | 54, 5 |
| G345.011.79 | 16:56:49.0 | 40:14:20 | May 25 | 76 | 47, 12 | May 24 | 110 | 42, 7 |
| G345.420.95 | 17:09:33.5 | 41:35:30 | May 25 | 85 | 46, 13 | May 24 | 120 | 41, 8 |
| G345.500.35 | 17:04:23.5 | 40:44:10 | May 25 | 91 | 46, 13 | May 24 | 120 | 41, 7 |
| G348.180.48 | 17:12:04.7 | 38:30:41 | May 25 | 80 | 45, 14 | May 24 | 130 | 39, 9 |
| G349.090.11 | 17:16:25.9 | 37:59:23 | May 23 | 110 | 103, 57 | May 22 | 270 | 94, 56 |
| G351.160.70 | 17:19:56.9 | 35:57:46 | May 25 | 90 | 43, 16 | May 24 | 140 | 38, 11 |
| G351.240.67 | 17:20:15.9 | 35:54:58 | May 25 | 85 | 43, 16 | May 24 | 160 | 38, 11 |
| G351.420.65 | 17:20:53.5 | 35:47:02 | May 25 | 78 | 39, 13 | May 24 | 110 | 35, 9 |
| G351.631.26 | 17:29:18.0 | 36:40:09 | May 25 | 70 | 40, 14 | May 24 | 130 | 34, 8 |
| G351.770.54 | 17:26:42.7 | 36:09:18 | May 25 | 89 | 43, 17 | May 24 | 140 | 37, 11 |
Observations were made with the Australia Telescope Compact Array (ATCA) 2007 May 20-25 (project code C1642) using the hybrid H214C array configuration. The most distant CA06 antenna (located about 4.5 km to the west of the other five antennas) was not used in this experiment. The remaning baselines had lengths ranging from 82 to 247 m corresponding to the synthesised beam sizes of about 7 and 6 arcsec at 36 and 44 GHz, respectively. The targets were drawn from Slysh et al. (1994), Val’tts et al. (2000) and Ellingsen (2005) and included essentially all sites of class I maser emission reported in the literature at the time of observations and located south of declination 35°, 71 unique targets in total. The exception was a well-known maser in NGC 6334I(N) already imaged by Kogan & Slysh (1998) and later studied in detail by Brogan et al. (2009). It is worth noting, that since the time of our observations, a large number of new class I methanol masers have been found in this declination range in various single dish surveys (Chen et al., 2011; Voronkov et al., 2012; Chen et al., 2013).
To reduce the calibration overheads two transitions were observed in separate slots, but no more than one day apart for the same source. Each target was observed in a few cuts 2.5- to 3-min in duration spread in hour angle to improve -coverage (the typical total integration time is about 10 to 15 min). The targets were grouped according to their position. Each group was bracketed with 1.5-min observations of a nearby phase calibrator in such a way that calibrator scans were no more than 10 minutes apart. The same calibrator sources served also as pointing calibrators to improve antenna pointing accuracy beyond the level provided by the default pointing model. Following the standard practice for the reference pointing procedure, the solutions were obtained every hour or when the next group of targets was further away than 15°. From the statistics of these solutions, the resulting reference-pointing accuracy was estimated to be 4.82.6 arcsec. This residual pointing error affects the accuracy of flux-density measurements, particularly for sources of emission which are significantly offset from the pointing centre. The full width at half maximum (FWHM) of the primary beam was 84 and 69 arcsec at 36 and 44 GHz, respectively. Note, the accuracy of the absolute positions for maser emission depends primarily on the quality of the phase calibration and is believed to be around 0.5 arcsec (1) for the majority of sources. We make a specific comment in the case when poorer accuracy of the absolute position is expected.
The project used the original Australia Telescope correlator before the new broad band backend became available. It was configured with 1024 spectral channels across an 8-MHz bandwidth, providing a spectral resolution of 0.078 and 0.064 km s-1 at 36 and 44 GHz, respectively. The initially adopted rest frequencies (36169.2650.03 and 44069.4100.01 MHz for the E and A+ methanol transitions, respectively) were taken from Müller, Menten & Mäder (Müller et al.2004). The velocity uncertainties corresponding to the rest frequency uncertainties are 0.24 and 0.068 km s-1 at 36 and 44 GHz, respectively (see also section 4.1 for an improved estimate of 36169.2380.011 MHz based on the present work).
The data reduction was undertaken in miriad and followed the standard procedure with the exception of bandpass calibration. For the latter, we solved for bandpass correction in the form of a third order polynomial, fitting independently for the real and imaginary parts of the visibility data of the bandpass calibrator (PKS 1253-055) using the uvlin task. A number of spectral channels near both ends of the band (typically 100 channels at both ends or 20 per cent of the band in total, but sometimes more if the target source had strong continuum emission) were excluded from the fit and further analysis. This approach is preferable for high spectral resolution mm-wavelength observations (i.e. the case of low signal-to-noise ratio in the calibration data) and suits maser observations well. After the absolute positions had been determined, we executed a single pass of phase only self-calibration with 1 minute solution interval. The strongest spectral feature was typically used as a reference (sometimes weaker features with less structure had to be used). The flux-density ratio for the reference feature before and after self-calibration is a measure of decorrelation due to atmospheric phase variations on the time-scale shorter than the minimum temporal separation of phase calibrator scans. We estimate that the effect of this decorrelation on the measured flux densities did not exceed a few per cent and was corrected by the self-calibration to first order. The absolute flux-density scale was bootstrapped from observations of Uranus for which we assumed flux densities of 1.38 and 1.98 Jy at 36 and 44 GHz, respectively. The opacity correction has been applied using the model built into miriad and environmental parameters such as ambient temperature, pressure and humidity registered at the time of observations by the weather station. We estimate the flux density scale to be accurate to about 20 per cent.
As is standard with interferometric observations, no real-time Doppler tracking was done. The correction was performed off-line during imaging which was done for the full velocity range available for analysis and used uniform weighting. We adopted 05 image pixels for all sources at both frequencies, which delivered sufficient oversampling in the image plane for adequate imaging and analysis (the synthesised beam is greater than 6 arcsec). Note that no additional Hanning smoothing has been done, so all image cubes had the same frequency resolution as in the measured visibility data. The maser emission was searched for in these velocity cubes prior to the primary beam correction (i.e. the noise level was constant across the field of view). We used a combination of automatic detection in the spectral domain (Green et al., 2009, same procedure as used in MMB; see) and visual inspection of each individual image plane. The formal detection criterion was 3 consecutive spectral channels above 3. However, the majority of cubes appeared to be dynamic range limited due to the presence of strong emission and the complexity of its spatial distribution. We rejected all such potential detections if there were reasonable grounds to believe they might be dynamic range artefacts. In particular, we rejected apparent detections weaker than twice the typical dynamic range artefacts in the field. Therefore, the ability to detect weak features is notably reduced within the velocity range of strong emission. Another type of artefact is caused by spatially extended (and probably thermal) sources which cannot be properly imaged with the sparse -coverage attained in this experiment tailored for maser imaging. We excluded such sources from analysis unless they could be reliably localised (i.e. their sizes did not exceed a few seconds of arc). After the emission had been located, we applied primary beam correction at the appropriate frequency and extracted spectra at each location as slices along the spectral axis taken at the position of the peak. Given the oversampling in the image plane, this method provides accurate flux densities for compact sources, such as masers, and is very robust to imperfections of the point spread function caused by limited -coverage and dynamic range artefacts. For each velocity of interest, an accurate position was determined by fitting a point source with the imfit task into a 55 arcsec2 region centred at the peak pixel (see also section 3).
The basic source-dependent parameters of observations are summarised in Table 1. The first three columns list the source name and the pointing direction used in observations (the same pointing centre was used at 36 and 44-GHz). The remaining columns include the UT date of observations, the noise level (1) in the image cube before the primary beam correction (i.e. constant noise across the field of view) and the velocity range inspected for the 36 and 44-GHz transitions.
| Source | Region with maser emission | Pointing | # of | other | Associations with class I masers | |||||||||
| name | centre | radius | velocity | offset | 6.7 GHz | masers | regular | at arcsec scale | ||||||
| range | from centre | masers | OH | H2O | struct. | SDC | EGO | other | 8.0 m | cm- | ||||
| (h:m:s) | (°:arcmin:arcsec) | (arcsec) | (km s-1) | (arcsec) | 1 arcmin | 4.5 m | cont. | |||||||
| G269.151.13 | 09:03:32.2 | 48:28:10 | 34 | 7, 14 | 21 | 1 | ||||||||
| G270.260.84 | 09:16:40.7 | 47:56:16 | 11 | 7, 20 | 32 | 1 | ||||||||
| G294.981.73 | 11:39:14.1 | 63:29:10 | 8 | 10, 3 | 25 | 1 | ||||||||
| G300.971.15 | 12:34:52.3 | 61:39:55 | 17 | 48, 40 | 7 | 1 | ||||||||
| G301.140.23 | 12:35:35.3 | 63:02:29 | 4 | 42, 34 | 12 | 1 | ||||||||
| G305.210.21 | 13:11:10.6 | 62:34:45 | 39 | 46, 36 | 9 | 2 | ||||||||
| G305.250.25 | 13:11:32.5 | 62:32:08 | 2 | 39, 34 | 5 | 1 | ||||||||
| G305.370.21 | 13:12:33.1 | 62:33:47 | 32 | 43, 31 | 22 | 0 | ||||||||
| G309.380.13 | 13:47:22.3 | 62:18:01 | 23 | 88, 47 | 28 | 1 | ||||||||
| G316.760.01 | 14:44:56.1 | 59:48:02 | 22 | 43, 36 | 10 | 0 | ||||||||
| G318.050.09 | 14:53:43.2 | 59:08:58 | 21 | 54, 48 | 5 | 1 | ||||||||
| G318.950.20 | 15:00:55.5 | 58:58:54 | 19 | 37, 27 | 22 | 1 | ||||||||
| G320.290.31 | 15:10:19.1 | 58:25:17 | 2 | 69, 60 | 8 | 1 | ||||||||
| G322.160.64 | 15:18:37.0 | 56:38:22 | 38 | 60, 51 | 38 | 1 | ||||||||
| G323.740.26 | 15:31:45.6 | 56:30:52 | 8 | 53, 47 | 8 | 1 | ||||||||
| G324.720.34 | 15:34:57.9 | 55:27:27 | 37 | 57, 44 | 1 | 1 | ||||||||
| G326.480.70 | 15:43:18.1 | 54:07:25 | 25 | 56, 29 | 18 | 2 | ||||||||
| G326.640.61 | 15:44:31.0 | 54:05:10 | 34 | 66, 26 | 25 | 1 | ||||||||
| G326.660.57 | 15:44:47.7 | 54:06:43 | 11 | 41, 41 | 12 | 0 | ||||||||
| G326.860.68 | 15:51:13.9 | 54:58:05 | 6 | 71, 65 | 2 | 1 | ||||||||
| G327.290.58 | 15:53:09.5 | 54:36:57 | 19 | 50, 38 | 30 | 1 | ||||||||
| G327.390.20 | 15:50:19.2 | 53:57:07 | 10 | 92, 85 | 7 | 2 | ||||||||
| G327.620.11 | 15:52:50.2 | 54:03:03 | 4 | 91, 84 | 2 | 1 | ||||||||
| G328.210.59 | 15:57:59.5 | 54:02:14 | 2 | 44, 39 | 41 | 0 | ||||||||
| G328.240.55 | 15:58:01.2 | 53:59:09 | 35 | 46, 41 | 27 | 2 | ||||||||
| G328.250.53 | 15:58:02.2 | 53:57:29 | 36 | 49, 43 | 36 | 1 | ||||||||
| G328.810.63 | 15:55:48.7 | 52:43:03 | 36 | 45, 38 | 16 | 2 | ||||||||
| G329.030.20 | 16:00:30.9 | 53:12:34 | 25 | 49, 37 | 3 | 2 | ||||||||
| G329.070.31 | 16:01:09.6 | 53:16:08 | 30 | 51, 28 | 7 | 1 | ||||||||
| G329.180.31 | 16:01:46.7 | 53:11:38 | 36 | 76, 44 | 6 | 1 | ||||||||
| G329.470.50 | 15:59:39.8 | 52:23:35 | 41 | 80, 64 | 11 | 1 | ||||||||
| G331.130.24 | 16:10:59.9 | 51:50:19 | 10 | 92, 81 | 21 | 1 | ||||||||
| G331.340.35 | 16:12:26.5 | 51:46:20 | 0 | 67, 65 | 8 | 1 | ||||||||
| G331.440.19 | 16:12:11.4 | 51:35:09 | 22 | 92, 84 | 10 | 1 | ||||||||
| G332.300.09 | 16:15:45.2 | 50:55:54 | 9 | 53, 45 | 2 | 2 | ||||||||
| G332.600.17 | 16:17:29.4 | 50:46:08 | 7 | 52, 45 | 4 | 1 | ||||||||
| G332.940.69 | 16:21:20.3 | 50:54:12 | 13 | 51, 47 | 12 | 1 | ||||||||
| G332.960.68 | 16:21:22.5 | 50:52:57 | 9 | 59, 46 | 4 | 1 | ||||||||
| G333.030.06 | 16:18:56.7 | 50:23:54 | 1 | 43, 39 | 0 | 1 | ||||||||
| G333.130.44 | 16:21:02.1 | 50:35:49 | 32 | 56, 45 | 11 | 4 | ||||||||
| G333.130.56 | 16:21:36.1 | 50:40:57 | 28 | 64, 48 | 7 | 2 | ||||||||
| G333.160.10 | 16:19:42.5 | 50:19:57 | 4 | 93, 90 | 5 | 1 | ||||||||
| G333.180.09 | 16:19:46.0 | 50:18:34 | 5 | 88, 85 | 4 | 1 | ||||||||
| Source | Region with maser emission | Pointing | # of | other | Associations with class I masers | |||||||||
| name | centre | radius | velocity | offset | 6.7 GHz | masers | regular | at arcsec scale | ||||||
| range | from centre | masers | OH | H2O | struct. | SDC | EGO | other | 8.0 m | cm- | ||||
| (h:m:s) | (°:arcmin:arcsec) | (arcsec) | (km s-1) | (arcsec) | 1 arcmin | 4.5 m | cont. | |||||||
| G333.230.06 | 16:19:50.8 | 50:15:13 | 14 | 107, 84 | 5 | 2 | ||||||||
| G333.320.11 | 16:19:28.3 | 50:04:46 | 9 | 55, 44 | 8 | 1 | ||||||||
| G333.470.16 | 16:21:20.2 | 50:09:44 | 12 | 50, 39 | 2 | 1 | ||||||||
| G333.560.02 | 16:21:08.8 | 49:59:48 | 0 | 42, 38 | 1 | 1 | ||||||||
| G333.590.21 | 16:22:06.7 | 50:06:23 | 4 | 52, 48 | 45 | 0 | ||||||||
| G335.060.43 | 16:29:23.4 | 49:12:26 | 19 | 43, 34 | 6 | 1 | ||||||||
| G335.590.29 | 16:31:00.3 | 48:43:37 | 50 | 56, 38 | 15 | 3 | ||||||||
| G335.790.17 | 16:29:46.5 | 48:15:50 | 23 | 53, 45 | 28 | 1 | ||||||||
| G336.410.26 | 16:34:13.5 | 48:06:18 | 5 | 91, 86 | 9 | 1 | ||||||||
| G337.400.40 | 16:38:48.9 | 47:27:55 | 25 | 46, 35 | 25 | 1 | ||||||||
| G337.920.46 | 16:41:08.5 | 47:07:44 | 52 | 45, 36 | 12 | 1 | ||||||||
| G338.920.55 | 16:40:34.5 | 45:41:50 | 27 | 79, 56 | 28 | 2 | ||||||||
| G339.881.26 | 16:52:04.3 | 46:08:28 | 19 | 33, 31 | 9 | 1 | ||||||||
| G341.190.23 | 16:52:16.4 | 44:28:44 | 3 | 71, 15 | 13 | 0 | ||||||||
| G341.220.21 | 16:52:17.4 | 44:27:03 | 27 | 47, 39 | 14 | 1 | ||||||||
| G343.120.06 | 16:58:16.8 | 42:52:09 | 30 | 35, 20 | 15 | 0 | ||||||||
| G344.230.57 | 17:04:07.8 | 42:18:26 | 48 | 26, 15 | 14 | 1 | ||||||||
| G345.000.22 | 17:05:10.7 | 41:29:13 | 26 | 31, 16 | 16 | 2 | ||||||||
| G345.011.79 | 16:56:46.0 | 40:14:09 | 21 | 18, 10 | 36 | 2 | ||||||||
| G345.420.95 | 17:09:35.6 | 41:35:40 | 47 | 25, 17 | 25 | 2 | ||||||||
| G345.500.35 | 17:04:24.1 | 40:44:07 | 33 | 19, 14 | 8 | 1 | ||||||||
| G348.180.48 | 17:12:06.8 | 38:30:38 | 40 | 9, 5 | 25 | 0 | ||||||||
| G349.090.11 | 17:16:24.6 | 37:59:43 | 7 | 81, 75 | 25 | 2 | ||||||||
| G351.160.70 | 17:19:56.4 | 35:57:54 | 30 | 9, 3 | 11 | 1 | ||||||||
| G351.240.67 | 17:20:18.0 | 35:54:45 | 6 | 6, 2 | 29 | 1 | ||||||||
| G351.420.65 | 17:20:52.3 | 35:46:42 | 32 | 12, 3 | 24 | 2 | ||||||||
| G351.631.26 | 17:29:17.9 | 36:40:29 | 9 | 18, 12 | 20 | 0 | ||||||||
| G351.770.54 | 17:26:42.4 | 36:09:14 | 40 | 11, 2 | 5 | 1 | ||||||||
3 Results
A general overview of the results obtained for all the 71 observed targets is presented in Table 3. In agreement with the earlier results on common class I masers (Kurtz et al., 2004; Voronkov et al., 2006; Cyganowski et al., 2009; Brogan et al., 2009, e.g.,), the maps often reveal significant spatial spread in the emission. Columns two to four of Table 3 characterise this spatial extent by listing the position and radius of the smallest circle encompassing all the emission regardless of the frequency for each particular target. The fifth column characterises the spread in the velocity domain and shows the total velocity range of the class I maser emission in both transitions. For most targets, our observations were the first with the spatial precision of an interferometer, and our initial target positions, taken from single dish surveys, were typically rather inaccurate and often corresponded to the positions of some other maser species. Therefore, the pointing centres turned out to be sub-optimal on many occasions. In extreme cases like G333.590.21, all the detected emission happened to be outside the 50 per cent sensitivity region (primary beam FWHM is 84 and 69 arcsec at 36 and 44 GHz, respectively). The sixth column of Table 3 shows the magnitude of the offset between the chosen pointing centre and the centre of the maser emission region shown in columns 2 and 3 (the actual orientation is shown in the maps, pointing centres are also listed in Table 1). The large spatial spread of the class I maser emission also has the potential to create confusion in cross-referencing the sources as the traditional naming convention for masers is based on their Galactic positions. We used the following approach to source naming throughout the paper and rounded the appropriate positions to the nearest 001 (see the first column of Table 3). For sources with only one class II methanol maser at 6.7-GHz within 1 arcmin of any class I maser emission according to the MMB survey (there are 45 such sources in our sample) we used the position of this 6.7-GHz maser. Thus, the source name reflects the presumed location of the YSO. For 17 sources with two or more such nearby 6.7-GHz masers we used the average position of the 6.7-GHz masers, except for G328.24-0.55, which was treated as a source with a single 6.7-GHz maser (the other 6.7-GHz maser seems to be unrelated given the distribution of the class I maser emission). For the remaining nine sources which do not have 6.7-GHz masers detected in the vicinity according to the MMB survey, we used the flux-weighted average position of all class I maser emission regardless of the transition. There are only three sources in our sample which have prior interferometric data on common class I masers reported in the literature, G309.380.13 (Voronkov et al., 2010a), G343.120.06 (Voronkov et al., 2006), and G351.420.65 (Gómez et al., 2010, NGC 6334F;). This approach resulted in identical names as used in the previous publications for the first two sources (and the latter is more commonly named as NGC 6334F). The number of associated 6.7-GHz masers is given in the seventh column of Table 3. Columns eight and nine summarise information on OH and H2O masers if such observations have been undertaken towards our targets. For OH masers the positive detection data were taken from Caswell (1998) and the non-detections relied upon blind surveys of Caswell et al. (1983) and Caswell & Haynes (1987b), unless the particular target was in the primary beam of another observation (see section 3.1 for details on individual sources). As indicated in Table 3, the H2O masers were found towards every source studied in this project for which sensitive data exist. The H2O surveys of Breen et al. (2010a) and Breen & Ellingsen (2011) cover most of our targets, although better data exist for G351.770.54 (Zapata et al., 2008). The tenth column indicates whether the distribution of class I maser emission trace regular structures such as lines or arcs. The remaining columns are self-explanatory and indicate whether the class I maser emission is associated with Spitzer dark clouds (Peretto & Fuller, 2009, SDC;), EGOs (Cyganowski et al., 2008), 4.5-m emission sources not identified as EGOs by Cyganowski et al. (2008), 8.0-m filaments and cm-wavelength continuum emission. For the latter we do not draw any conclusions from non-detections due to very inhomogeneous information available for this sample of sources (see also section 4.9).
For detailed analysis of the spatial and kinematic structure of detected class I maser emission, we fitted all spectral profiles with a sum of Gaussians. The number of components in the fit was typically the smallest required to represent the measured profile given the noise. However, on some occasions additional components were fitted if warranted by the spatial distribution. In a few cases, the spectra had some (usually weak) feature which could not be fitted reliably as a sum of Gaussians, for example an abrupt jump in the flux density at a certain velocity. We make an explicit comment on all such individual sources where there is a significant systematic residual after the fit. For each Gaussian, the position fit was done under the assumption that the source is spatially unresolved. We selected a representative velocity channel for this fit, which corresponded to the peak unless there was significant blending of several Gaussian components. Unless noted otherwise, the position fits agreed within the fit uncertainty for all velocity channels dominated by the particular Gaussian component and any systematic effects could be ignored.
The fit results for individual Gaussian components are given in Table 5 (for sources other than G305.370.21 see the full version of the table available online). The total number of components is 848 at 36 GHz and 879 at 44 GHz (this includes one absorption component at 36 and two such components at 44 GHz in G301.140.23, see notes on this source in section 3.1). Following the same approach as Voronkov et al. (2010a), the components in Table 5 are grouped by a rough spatial location labelled with letters to assist cross-referencing between images and spectra (see Fig. 1). We use these location labels for presentation purposes only and disregarded them in the statistical analysis. The correspondence between individual Gaussian components and a particular location is determined by practicality of presenting these components together in a single spectrum (individual spectral profiles were combined with appropriate weighting, if necessary). Typically, the components which are further apart than several arcseconds were assigned to different locations, unless dictated otherwise by the sidelobe structure of the synthesised beam. In some cases we were unable to assign locations the same way for two transitions. For example, the locations C and D of the 44-GHz emission in G305.370.21 correspond to a single location CD of the 36-GHz emission (see Table 5). The source name, the location and the transition frequency are given in the first three columns of Table 5. The remaining columns are self-explanatory and include the peak velocity, the positions, full width at half maximum (FWHM) and the peak flux density for each Gaussian component. The uncertainties are given in parentheses and expressed in units of the least significant figure.
| Source | Location | Frequency | LSR | Line | Flux | ||
|---|---|---|---|---|---|---|---|
| name | velocity | FWHM | density | ||||
| (GHz) | (km s-1) | (h:m:s) | (°:arcmin:arcsec) | (km s-1) | (Jy) | ||
| G305.37+0.21 | A | 36 | 40.21 (1) | 13:12:30.36 (4) | 62:34:08.0 (3) | 0.50 (3) | 1.9 (1) |
| 44 | 40.79 (6) | 13:12:30.51 (8) | 62:34:07.8 (5) | 1.10 (9) | 2.5 (4) | ||
| 40.511 (5) | 13:12:30.465 (6) | 62:34:07.55 (4) | 0.40 (2) | 11.5 (4) | |||
| B | 36 | 42.32 (4) | 13:12:29.0 (2) | 62:34:01.2 (8) | 0.65 (8) | 0.66 (8) | |
| 44 | 42.50 (3) | 13:12:28.92 (4) | 62:34:00.9 (3) | 0.56 (6) | 2.3 (2) | ||
| C | 44 | 38.48 (6) | 13:12:31.72 (6) | 62:34:08.0 (4) | 2.1 (2) | 1.57 (9) | |
| 36.77 (1) | 13:12:31.63 (2) | 62:34:08.1 (1) | 0.48 (3) | 4.5 (2) | |||
| 36.32 (2) | 13:12:31.54 (3) | 62:34:07.4 (2) | 0.21 (5) | 1.5 (3) | |||
| CD | 36 | 37.55 (9) | 13:12:31.50 (9) | 62:34:06.5 (6) | 3.4 (2) | 0.59 (4) | |
| 37.20 (1) | 13:12:31.51 (4) | 62:34:02.2 (3) | 0.50 (3) | 1.96 (8) | |||
| D | 44 | 37.372 (3) | 13:12:31.51 (1) | 62:34:01.69 (8) | 0.596 (7) | 11.3 (1) | |
| E | 36 | 36.57 (1) | 13:12:36.17 (3) | 62:33:27.1 (2) | 0.27 (4) | 0.68 (8) | |
| 36.27 (3) | 13:12:36.0 (1) | 62:33:27.7 (6) | 1.59 (8) | 0.71 (6) | |||
| 36.18 (1) | 13:12:36.1 (1) | 62:33:27.3 (7) | 0.29 (4) | 0.70 (8) | |||
| 44 | 36.82 (1) | 13:12:36.21 (2) | 62:33:26.7 (1) | 0.31 (3) | 1.6 (1) | ||
| 36.45 (1) | 13:12:36.12 (5) | 62:33:27.3 (3) | 0.31 (3) | 1.8 (2) | |||
| 36.28 (6) | 13:12:36.12 (9) | 62:33:26.8 (5) | 1.7 (2) | 0.6 (2) | |||
| 35.925 (7) | 13:12:36.46 (3) | 62:33:25.2 (2) | 0.32 (2) | 1.8 (1) | |||
| F | 36 | 35.1 (1) | 13:12:35.9 (1) | 62:33:35.2 (7) | 2.3 (3) | 0.37 (4) | |
| 35.047 (7) | 13:12:36.08 (9) | 62:33:36.3 (6) | 0.27 (2) | 1.32 (8) | |||
| 33.80 (5) | 13:12:35.74 (4) | 62:33:32.4 (3) | 0.57 (8) | 2.6 (2) | |||
| 33.469 (2) | 13:12:35.554 (3) | 62:33:32.04 (2) | 0.342 (3) | 23.9 (5) | |||
| 32.36 (6) | 13:12:35.9 (1) | 62:33:33.7 (7) | 0.4 (1) | 0.5 (1) | |||
| 31.85 (5) | 13:12:35.92 (6) | 62:33:33.9 (4) | 0.63 (9) | 0.94 (6) | |||
| 44 | 36.45 (2) | 13:12:36.05 (6) | 62:33:35.4 (4) | 0.76 (6) | 1.03 (8) | ||
| 35.314 (3) | 13:12:36.04 (4) | 62:33:35.9 (3) | 0.459 (8) | 6.35 (9) | |||
| 34.38 (1) | 13:12:35.83 (6) | 62:33:33.7 (4) | 0.51 (2) | 5.0 (1) | |||
| 33.746 (1) | 13:12:35.609 (5) | 62:33:31.82 (3) | 0.283 (3) | 35.0 (6) | |||
| 33.649 (5) | 13:12:35.715 (6) | 62:33:31.68 (4) | 0.646 (8) | 25.8 (6) | |||
| 32.4 (3) | 13:12:35.903 (8) | 62:33:32.99 (5) | 0.8 (3) | 3 (1) | |||
| 31.94 (4) | 13:12:35.91 (2) | 62:33:33.1 (1) | 0.57 (8) | 4 (3) | |||
| G | 36 | 34.99 (5) | 13:12:36.7 (2) | 62:33:36 (1) | 0.27 (8) | 0.9 (2) | |
| 34.718 (6) | 13:12:36.819 (4) | 62:33:37.47 (3) | 0.289 (8) | 8.2 (2) | |||
| 33.66 (1) | 13:12:37.013 (7) | 62:33:35.43 (5) | 0.59 (2) | 5.2 (3) | |||
| 33.608 (4) | 13:12:37.011 (4) | 62:33:35.24 (3) | 0.20 (1) | 4.3 (3) | |||
| 33.107 (2) | 13:12:36.968 (2) | 62:33:35.68 (1) | 0.212 (9) | 16 (2) | |||
| 32.995 (8) | 13:12:37.01 (2) | 62:33:34.8 (2) | 0.336 (6) | 35 (2) | |||
| 32.49 (3) | 13:12:37.10 (8) | 62:33:34.1 (7) | 0.38 (6) | 0.66 (6) | |||
| 44 | 35.6 (1) | 13:12:36.85 (9) | 62:33:37.5 (6) | 0.4 (3) | 0.6 (3) | ||
| 34.99 (2) | 13:12:36.87 (2) | 62:33:37.4 (1) | 0.53 (5) | 12 (3) | |||
| 34.930 (3) | 13:12:36.850 (7) | 62:33:37.33 (4) | 0.26 (1) | 22 (3) | |||
| 34.05 (2) | 13:12:37.082 (6) | 62:33:35.56 (4) | 0.42 (3) | 18.7 (8) | |||
| 33.808 (3) | 13:12:37.023 (2) | 62:33:35.26 (2) | 0.259 (7) | 30 (2) | |||
| 33.262 (2) | 13:12:36.999 (2) | 62:33:35.49 (2) | 0.404 (4) | 100 (4) | |||
| 33.0 (2) | 13:12:37.20 (2) | 62:33:34.7 (1) | 0.7 (1) | 6 (2) | |||
| 31.57 (8) | 13:12:36.96 (6) | 62:33:35.0 (5) | 0.6 (2) | 0.6 (1) | |||
| H | 36 | 32.61 (1) | 13:12:36.9 (1) | 62:33:30.7 (8) | 0.56 (3) | 1.87 (5) | |
| 44 | 32.847 (5) | 13:12:36.95 (8) | 62:33:30.0 (4) | 0.518 (9) | 9.0 (3) |
The spatial distribution of the class I maser emission for each source is shown in Figure 1 along with the spectra for each location marked in the image (for sources other than G305.370.21 see the full version of the figure available online). For the single selected source G305.370.21 we also show the scalar-averaged visibility spectra at 36 and 44 GHz to illustrate the amount of additional information provided by interferometric data in comparison to the typical single dish experiment as well as the biases of the latter when the spatial distribution is as wide as the primary beam. To declutter the image plots we showed Gaussian components co-located in position and velocity within 3 by a single symbol (crosses for the 36-GHz and pluses for the 44-GHz masers). The position uncertainty does not exceed the symbol size. Some symbols were enlarged to ensure this. The wide concentric circles (or arcs) in Fig. 1 represent the full width at half maximum (FWHM) of the primary beam in both transitions. Centred at the pointing position, these circles therefore enclose the 50 per cent sensitivity region for each target. With the exception of six sources for which no Spitzer data were available, the three-colour background in Fig. 1 shows the emission in the 8.0, 4.5 and 3.6-m IRAC Spitzer bands as red, green and blue, respectively. A survey of ground-state hydroxyl masers, designated MAGMO (Green et al., 2012b, and further data in preparation) provided 18-cm radio continuum measurements for the majority of our targets (except for eight sources specifically commented on in the following section) with a typical 1 noise level of about 510 mJy. If detected within the image boundaries, this continuum emission (referred to as MAGMO data) is shown by contours in Fig. 1, unless more appropriate data are available for the particular source (see the notes on individual sources for details). Note, the radio emission from Hii regions is usually optically thick and weak at low frequency. Therefore, observations at higher frequencies are required to establish reliably whether an Hii region is present in a particular source. However, such sensitive observations are scarce at the moment for class I maser targets. The positions of the class II methanol masers at 6.7-GHz measured as part of the Methanol Multibeam survey (Caswell et al., 2010; Caswell et al., 2011a; Green et al., 2012a, MMB;) are shown by squares in Fig. 1, if such masers were found. The absolute radial velocity in the spectra depends on the adopted value of rest frequency. The velocity uncertainty associated with the uncertainty of the rest frequency is shown by horizontal error bars for all 36-GHz spectra (Fig. 1; this uncertainty is comparable to the spectral resolution at 44 GHz). However, in subsequent analysis (section 4.1 and 4.3) we argue that the best estimate rest frequency at 36 GHz should be lower than currently adopted, and the plotted 36-GHz spectra should be shifted to lower velocity by approximately the width of the error bar shown; peaks of many 36- and 44-GHz features then become aligned.

3.1 Notes on individual sources
3.1.1 G269.151.13
This source is located in the Vela Molecular Ridge cloud B (Murphy & May, 1991, e.g.,) in the area devoid of radio continuum emission stronger than a few mJy (e.g. 3-cm measurement of Walsh et al., 1998, 18-cm MAGMO data). However, outside the field shown in Fig. 1, there is an Hii region about 30 arcsec west of the class I maser location C (Caswell & Haynes, 1987a). This area is well outside the half-power point of the primary beam and may contain additional masers (e.g. associated with an Hii region) which our data are not sensitive to. The rest of the class I maser emission is found to cluster around the position of the 6.7-GHz maser (Caswell, 2009; Green et al., 2012a, Fig. 1;). There is also an H2O maser near this position (Breen & Ellingsen, 2011). Note, the uncertainties of the profile fit (listed in Table 5) may be underestimated for the 36-GHz maser at A. Guided by the spatial distribution, we had to fit this profile with one more Gaussian component than would be required by the spectral profile and this destabilised the fit in the spectral domain. Partially resolved thermal emission may have contributed to 36-GHz profiles of E and B.
3.1.2 G270.260.84
This target is associated with the Vela Molecular Ridge cloud A (Murphy & May, 1991, e.g.,). The class I masers are scattered around the position of the 6.7-GHz maser (Caswell, 2009; Green et al., 2012a) near the half-power point of the primary beam. They are red-shifted in velocity with respect to the 6.7-GHz maser, which peaks at around 4 km s-1. The largest velocity offset (over 15 km s-1) is at the location G detected at 36 GHz only. Caswell et al. (1989) detected a strong H2O maser towards this source albeit without accurate position measurement (note that Breen & Ellingsen (2011) measured the accurate position but their spectrum suffers from ringing artefacts). The water maser peaks at 8 km s-1 and is also red-shifted with respect to the 6.7-GHz maser up to velocities of about 30 km s-1. No 18-cm continuum has been detected towards this source in the MAGMO project (1 rms is 0.8 mJy).
3.1.3 G294.981.73
This class I maser source was found towards an IRAS source (Slysh et al., 1994), which is associated with a weak ( 1 mJy at 3cm) Hii region (Walsh et al., 1998). The pointing centre lies just beyond the northern edge of the field shown in Fig. 1, more than 20 arcsec from the actual position of class I masers. This offset explains the rather marginal appearance of the 95-GHz spectrum (Val’tts et al., 2000) which was registered at the same pointing position and with a narrower beam. A highly variable 6.7-GHz maser was found near the class I masers in the MMB project (Green et al., 2012a). The class I masers at A and B are blue-shifted with respect to the 6.7-GHz maser emission, while masers at C, detected at 36 GHz only, are red-shifted. No 18-cm continuum was found within the boundaries of Fig. 1 (MAGMO continuum rms is 0.7 mJy).
3.1.4 G300.971.15
The class I masers are spread over an elongated 2040 arcsec2 region located approximately 15 arcsec south of the extended Hii region revealed by the MAGMO data at 18-cm (see Fig. 1). The Hii region has a compact core situated near its edge. This core is associated with the 6.7-GHz maser which is red-shifted with respect to all detected class I masers (Caswell, 2009; Green et al., 2012a). The 2MASS data revealed a chain of compact 2-m sources roughly tracing the shape of the leading edge of the Hii region a few arcseconds south of it (Mottram et al., 2007). There is also a weak filament between two 2-m sources possibly tracing shocked gas. One of these sources (located near B), is associated with a 10.4-m source and also detected at 21m (MSX). Therefore, this source is likely to be the site of induced star formation. The class I masers are most likely associated with the new generation of YSOs, although the masers at B, the maser location closest to the Hii region, could be related to the ionization front.
3.1.5 G301.140.23
This is a reasonably well studied source which harbours a molecular outflow deeply embedded in a dense molecular cloud (Henning et al., 2000). The Spitzer IRAC images reveal four strong infrared sources labelled MIR1 to MIR4 by Henning et al. (2000) in addition to a number of weak ones. Two infrared sources have associated radio continuum emission, presumably from Hii regions (Walsh et al., 1998, see MAGMO data in Fig. 1 and). There is an extended 4.5-m halo around these two sources and a weaker source which lies immediately to the north in the area where Henning et al. (2000) detected nebulous 2.12-m H2 emission. Therefore, the presence of shocked gas is likely in this source despite the fact that it is not listed as an EGO by Cyganowski et al. (2008), perhaps due to the effects of strong sources. The class I masers at A are situated near the edge of the northern Hii region, which is also at the rim of the H2 emission (Henning et al., 2000, c.f.) presumably tracing the outflow. The maser at B is associated with the southern Hii region and has a remarkable absorption feature in the spectrum. This absorption feature is unresolved at the ATCA resolution and was fitted with Gaussians and presented in Table 5 the same way as the maser componets. However, we have excluded the absorption features from the statistical analysis presented in the following sections. This location also has a weak (1 Jy) 6.7-GHz maser (Caswell, 2009; Green et al., 2012a) which spans the velocity range from 41 to 37 km s-1, comparable to the velocities of the absorption feature (Green et al., 2012a, c.f. Fig. 5 and), and a co-located OH maser which shows an unusually wide spread of velocity components from 64 to 33 km s-1 (Caswell & Haynes, 1987b; Caswell, 1998).
3.1.6 G305.210.21
This is a well studied region of high-mass star formation (see Walsh et al. (2007) and references therein). There are two 6.7-GHz masers in the region, the stronger 305.2080.206 and the weaker 305.2020.208 (Green et al., 2012a), which were referred to as G305A and G305B, respectively by Walsh et al. (2007). The latter site (G305B) is associated with a strong infrared source (see Fig. 1) but no detected radio continuum emission, while the former (G305A) is a deeply embedded hot core detected in a number of molecular tracers which has either no associated infrared source or a very weak one (Walsh et al., 2007, e.g.). The source has two prominent Hii regions, one located approximately 30 arcsec to the south-east of G305A just outside the region shown in Fig. 1 (Walsh et al., 2007, referred to as G305HII(SE) by) and the other located 15 arcsec to the west of G305B (Walsh et al., 2007, referred to as G305HII by). None of the 6.7-GHz masers appear to be directly associated with any of these Hii regions (Phillips et al., 1998). The contours in Fig. 1 represent reprocessed ATCA archival data at 6 cm (project code C865, 6A array configuration). The emission at 36 and 44 GHz is scattered around the large area exceeding the FWHM of the primary beam. The locations AE, G and L seem to be associated with G305A and, except for A and B which are situated in the vicinity of the 6.7-GHz maser, are arranged in an elliptic arc approximately 107 arcsec2 across possibly tracing an outflow cavity. The strongest masers at both 36 and 44 GHz are at location F, approximately 3 arcsec to the east of the 6.7-GHz maser position at G305B. This region is active in a number of rare class I methanol maser transitions which require higher than average temperatures and densities to form (Voronkov et al., 2010b, see the discussion of this source by). It is worth noting that in addition to the 25-GHz methanol masers at F (Voronkov et al., 2005b; Voronkov et al., 2010b), Walsh et al. (2007) found 25-GHz maser emission at D as well as the broad and possibly quasi-thermal emission at B which may be a counterpart to the broad 36- and 44-GHz features seen in the spectrum (see Fig. 1). Detected at 44-GHz only, the maser emission at J is seen projected onto the continuum source G305HII and may, therefore, be associated with the interface between this Hii region and the molecular gas in the cold cloud identified by Walsh & Burton (2006) in the area to the south-west of G305B and G305HII. The maser emission at K, H and I may also originate from this cloud or its interface. However, given the angular separation of at least 10 arcsec, it seems unlikely that the emission at K and H is caused by interaction with G305HII.
3.1.7 G305.250.25
This region also belongs to the G305 complex and has widespread star formation activity (Longmore et al., 2007, e.g.). The class I methanol masers are distributed very tightly around a 6.7-GHz maser (Caswell, 2009; Green et al., 2012a, Fig. 1;). All class I maser emission is blue-shifted with respect to the class II maser velocities. An infrared overlay reveals a nearby filament most likely tracing PAH emission. There is also a nearby infrared source with 4.5-m excess, but it is too compact to be considered as an EGO. No 18-cm continuum has been detected in the MAGMO project (rms is 1 mJy). Note, the uncertainties of the fit are likely to be underestimated for the most red-shifted Gaussian component of A at both 36 and 44 GHz (at 35.0 and 35.68 km s-1, respectively).
3.1.8 G305.370.21
There are two clearly separated sites of class I maser emission: the south-western locations AD situated near the boundary of an extended Hii region traced by the 18-cm emission contours and the north-eastern locations EH encircling a compact infrared source at the tip of the ridge of the 18-cm emission (Fig. 1). We also overlay an image of the 15 mJy 3-cm continuum source located in the north-eastern site obtained by Hindson et al. (2012) using the spatial filtering of the data to enhance the compact structure. The circular distribution of the class I maser emission supports the idea of possible association of such masers with expanding Hii regions (Voronkov et al., 2010b; Cyganowski et al., 2012). Voronkov et al. (2007) reported detection of a strong class I methanol maser in the 25 GHz series (J=5 transition of the series was observed) with two components, which both seem to be associated with the location G, according to the measured position and velocity. No 6.7-GHz methanol maser has been detected in this source in the MMB survey.
3.1.9 G309.380.13
This source has been studied in detail at 36 and 44 GHz by Voronkov et al. (2010a), who revealed a maser feature blue-shifted by over 30 km s-1 from the systemic velocity. In this paper, we present an independent observation of this source, which was carried out a few days after the original dataset had been taken. In particular, the new observation was made at a different receiver tuning which allowed us to better register the high-velocity feature at both 36 and 44 GHz (the original 44-GHz dataset did not cover the velocities corresponding to the high-velocity feature at all and the 36-GHz dataset had them near the edge of the band). The two datasets provide an excellent cross-check on the reliability of the measurements. The comparison of Table 5 and Figure 1 with table 2 and figure 2 from Voronkov et al. (2010a) shows that they are in a good agreement (note, the coordinate grid in Figure 2 of Voronkov et al. (2010a) has a rounding error in the labels due to a software error, the plot itself reflects correct relative positions). The main difference, apart from the detecton of a weak 44-GHz counterpart of the high-velocity feature (also labelled E for consistency with the earlier paper), is the detection of a few additional weak components in the new dataset, including a 36-GHz counterpart at the location A at 51.0 km s-1 and a new 2-Jy feature at 44 GHz near 50.2 km s-1 labelled J (Voronkov et al., 2010a, both were most likely missed due to confusion with dynamic range artefacts caused by other strong emission in). The new data confirmed the presence of the 44-GHz emission towards the location I and also revealed a marginal 44-GHz component at the same location near 88 km s-1, i.e. near the velocities of the high-velocity feature (the spectrum is labelled Im in Fig. 1). The broad component of H is the only one with more than 3 disagreement with the previous results. Finer structure of this component is also evident in the spectrum (Fig. 1). This minor discrepancy could be due to the presence of a partially resolved thermal emission. The 6.7-GHz methanol maser in the region peaks at 49.6 km s-1. It is located just a few seconds of arc south of locations B and E. There is also an EGO located in the area indicating presence of the shocked gas (Cyganowski et al., 2008, classified as a likely outflow candidate according to). No 18-cm radio-continuum emission has been found in this region with an rms of 2 mJy (MAGMO data).
3.1.10 G316.760.01
The field is dominated by an infrared source which has a 4.5-m excess but was not classified as an EGO by Cyganowski et al. (2008), perhaps due to its regular shape (Fig. 1). The MMB survey revealed no 6.7-GHz methanol maser in this source (Green et al., 2012a). The class I maser emission is spread over a large area with separation of up to 05 from the infrared source. The most offset emission components (at F, D and E) are weak and detected at 36 GHz only. The emission profiles at locations F and D are broad and possibly correspond to quasi-thermal emission from the parent molecular cloud. The maser emission at C (this location contains the strongest peak at both 36 and 44 GHz) and B forms an arc structure around the eastern side of the infrared source. Both the H2O and hydroxyl masers are located near C (Breen et al., 2010a; Caswell, 1998) and may be part of the same arc. No 18-cm continuum emission was detected towards this source (MAGMO, with rms of 5 mJy).
3.1.11 G318.050.09
Most of the class I masers are distributed over a large area about 30 arcsec in extent to the south-east from the 6.7-GHz maser position (Caswell, 2009; Green et al., 2012a, Fig. 1;). The exception is the maser location B, which lies approximately 20 arcsec to the south-west. The Spitzer image reveals a number of infrared sources in the general area occupied by class I masers and an elongated 4.5-m feature, possibly an outflow emanating from the YSO near the 6.7-GHz maser, which seems to be associated with the class I masers at C and G (Cyganowski et al., 2008, Fig. 1; likely outflow candidate by). Location A is situated a few arcseconds to the north of this structure and also likely to be associated with the same outflow. The 36-GHz emission at DF is located futher to the south-east and does not follow the direction traced by the 4.5-m feature. Therefore, either the outflow is bent or all locations except B trace an arc-like structure at the rim of the dark cloud identified by Peretto & Fuller (2009) approximately 05 to the south of class I masers. Diffuse 4.5-m emission extends to the west and south-west of the 6.7-GHz maser. There is also a brighter knot in the immediate vicinity of B. No 18-cm continuum emission has been detected in this source (MAGMO, with rms 1 mJy).
3.1.12 G318.950.20
The distribution of class I masers in this source is elongated in the north-west to the south-east direction symmetrically with respect to the position of the 6.7-GHz maser, which is associated with the strongest infrared source (Green et al., 2012a, Fig. 1;). This morphology suggests the presence of an outflow in the region. Assuming a distance of 10.6 kpc (Green & McClure-Griffiths, 2011), this outflow is at least 1.1 pc long. It is worth noting that the 36-GHz spectrum of C (likely in the terminal area of the outflow) shows a pronounced red-shifted wing spanning several km s-1 (see Fig. 1), although the spatial resolution of our data was insufficient to detect a velocity gradient in this feature. The baseline of the 36-GHz spectrum of B contained weak (a few 100 mJy) undulations raising the detection threshold a few times. The cause of this is not entirely clear and could indicate the presence of resolved, probably thermal, emission with complex kinematics. No radio continuum emission has been detected in this source (the 18-cm MAGMO image has rms of 4 mJy; the 3-cm measurement of Ellingsen et al. (1996) has a 5 limit of 0.82 mJy).
3.1.13 G320.290.31
The class I masers in this source are tightly clustered around a rather weak 6.7-GHz maser (Green et al., 2012a, Fig. 1; 0.8 Jy at 6.7 GHz according to). They are located at the interface between a dark area in the Spitzer image, presumably a molecular cloud, and two infrared sources with the 4.5-m excess (Cyganowski et al., 2008, neither qualified as an EGO according to). There is a stronger infrared source and an extended PDR at the northern tip of the molecular cloud, approximately 10 arcsec north from the masers (Fig. 1). The spectral fit required broad pedestals at both frequencies to fit the data within the noise (peaks are 1.5 and 3 Jy at 36 and 44 GHz, respectively). However, we were unable to position these features and therefore do not list them in Table 5. No 18-cm continuum has been detected in this source (MAGMO, with rms 6 mJy).
3.1.14 G322.160.64
This region has a complex distribution in the infrared emission (see Fig. 1). It contains 3 well-separated sites of class I methanol maser emission which could be independent sources. The most abundant site is around the position of the 6.7-GHz maser (Caswell, 2009; Green et al., 2012a) and an infrared source with a strong 4.5-m excess (locations AD and F in Fig. 1). The latter may actually be a cluster of compact sources without any significant extended component and, therefore, is not listed as an EGO by Cyganowski et al. (2008). Some emission at A, B and C is located near the edge of the 4.5-m source. There is a hint of 36-GHz emission at A not shown in the spectra due to poor signal-to-noise ratio. It is worth noting that the hydroxyl maser (co-located with the 6.7-GHz methanol maser within the measurement uncertainty) is rather weak (1 Jy) and blue-shifted with respect to the class I methanol masers (Caswell, 1998). The 6.7-GHz methanol maser is strong (200 Jy) and has a wide velocity range (Green et al., 2012a, from 66 to 51 km s-1;) covering that of both class I methanol and hydroxyl masers.
The second class I maser site is represented by the location E near the pointing centre in the south-east corner of the field shown in Fig. 1. This location is near the edge of an Hii region with some class I methanol masers projected onto it. There is also an associated water maser 322.1650.625, but no 6.7-GHz methanol maser at this position (Breen et al., 2010a; Green et al., 2012a). The remaining site is represented by locations G and H. Situated in the north of the field, this area is devoid of strong infrared emission and presumably contains a molecular cloud (Peretto & Fuller, 2009, although not listed as a dark cloud by). The location H is near the interface of this cloud traced by the 8.0-m PDR emission. The PDR emission shows some symmetry and has a dark area along the perceived symmetry axis which goes through G and H (Fig. 1). The continuation of this line further to the south-east goes through the Hii region at E suggesting that a physical connection between these two sites cannot be completely excluded, although this is pure speculation. It is also worth noting that the blue and red wings of the peak at G may correspond to slightly different positions (although the separation is below the uncertainty of our measurement).
3.1.15 G323.740.26
The class I masers are scattered around a pronounced EGO (Cyganowski et al., 2008, designated as a possible outflow candidate by) and very strong 6.7-GHz methanol maser (Phillips et al., 1998; Green et al., 2012a, over 3000 Jy;). There are at least three infrared sources embedded in the EGO (Walsh et al., 2001) with the two dominant ones clearly visible in the Spitzer overlay (Fig. 1). Note, there are two components of the 6.7-GHz maser (Phillips et al., 1998, see e.g.) which the MMB project treated as a single source due to their close proximity (about 3 arcsec). The stronger 6.7-GHz maser is associated with the western infrared source and an OH maser showing a wide velocity spread from 62 km s-1 to 39 km s-1 (Caswell, 1998). The latter (along with the EGO) suggests a strong outflow activity in the region. The eastern infrared source is associated with the weaker 6.7-GHz maser and the class I maser emission at C. The rest of the class I maser sites (A, B and D) are in close proximity to the edge of the EGO. There is an extended Hii region associated with the pronounced PDR in the north of the field shown in Fig. 1, but no radio continuum emission in the vicinity of class I masers (Phillips et al., 1998, below 0.4 mJy at 18 cm according to MAGMO data and 0.2 mJy at 3 cm according to).
3.1.16 G324.720.34
The class I masers are spread over a large area comparable to the ATCA field of view. The distribution is approximately symmetric with respect to the position of the 6.7-GHz methanol and mainline OH masers (Caswell, 1998; Caswell, 2009; Green et al., 2012a, Fig. 1;), which are located at a tip of an EGO (Cyganowski et al., 2008, likely outflow candidate according to). There is a dark cloud located to the north-west of the 6.7-GHz maser position (Peretto & Fuller, 2009), so the class I masers at F may be associated with its interface. The broader spectral feature of F and the masers at E are located in the immediate vicinity of the EGO. The masers at A, B and C are the most offset from it. Assuming the distance to the source is 11.1 kpc (Green & McClure-Griffiths, 2011), this implies a linear separation in excess of 2 pc for the most offset location B. The EGO has a faint tail of emission which curves towards A suggesting a possible physical association. The masers at C and B are likely to be independent sources. No 18-cm continuum emission was detected (MAGMO, rms 1 mJy).
3.1.17 G326.480.70
This region has two class II methanol masers at 6.7-GHz, 326.475+0.703 and 326.476+0.695 (Caswell, 2009; Green et al., 2012a). The former is a strong maser (flux density in excess of 100 Jy) located in an area devoid of strong infrared sources in the north-west corner of the field shown in Fig. 1. It is estimated to be at the far kinematic distance of 11.8 kpc by Green & McClure-Griffiths (2011). In contrast, the latter 6.7-GHz maser is co-located with a strong infrared source (Fig. 1) and assumed to be at the near kinematic distance of 2.9 kpc. This drastic difference in assumed distances makes identification of the class I masers with a particular 6.7-GHz maser a non-trivial task because the region of influence of 326.4760.695 extends virtually across the whole field of view shown in Fig. 1. In particular, location F is most likely attributed to 326.4760.695, despite a slightly greater angular separation than from the other 6.7-GHz maser. The distribution of the class I masers in the vicinity of 326.4750.703 (locations AC, G and H) is rather compact, which is consistent with the large assumed distance (although the Galactic latitude implies a large offset from the Galactic plane in this case). The maser at C (detected at 44 GHz only) could not be positioned and fitted reliably due to confusion with other strong emission (mainly A). We only denote its approximate location in Fig. 1. There are two EGOs in the region (Cyganowski et al., 2008, both are likely outflow candidates according to), one is several arcsec to the east of A and the other is at the position of the bulk of the class I maser emission at this location (obscured by the maser symbols in Fig. 1). There is also a compact infrared source with 4.5-m excess near G and a more diffuse 4.5-m source several seconds of arc north of F (see Fig. 1), neither classified as EGOs. It is worth noting that Peretto & Fuller (2009) identified a dark cloud immediately to the north of G. However, this could be a foreground object. Garay et al. (2006) reported the most sensitive continuum measurement available to date towards this region, but detected no radio continuum emission in the field shown in Fig. 1 (rms below 3 mJy at 20 and 13 cm and below 0.3 mJy at 6 and 3 cm).
3.1.18 G326.640.61
The class I masers are spread over a large area exceeding 1 arcmin in angular extent. Most of the emission (locations A, B, D, E, G and J) is tightly clustered immediately to the north-west of the 6.7-GHz maser (326.6410.611; see Fig. 1) located near the edge of the prominent 8.0-m filament (barely captured in the corner of the field shown in Fig. 1). The remaining emission is further away, with the locations C, F and H being near the half power offset of the primary beam at 44 GHz and the most offset locations I and K being well outside the 50 per cent sensitivity region at both frequencies. Therefore, our data were sensitive only to the strongest emission in this area. There is a marginal detection of a high-velocity feature at K (labelled K∗ in the spectra in Fig. 1) peaking near 63 km s-1 (other emission detected at the same location is confined to the velocities from 31 to 25 km s-1). The area occupied by the class I maser emission is largely devoid of infrared sources, with the exception of weak infrared sources near A, F and K (Fig. 1). No 18-cm continuum emission was detected in the MAGMO project within the field presented in Fig. 1 (rms noise is 12 mJy).
3.1.19 G326.660.57
There are two sites of class I maser emission in this source separated by about 20 arcsec. Labelled as locations A and B, they were detected only at 36 and 44 GHz, respectively. Both masers are quite faint, so no self-calibration has been performed as part of the reduction process. This had no effect on the presented data because there was only one emission component at each frequency and, therefore, no need to determine relative positions. The masers are located in an area devoid of strong infrared sources and presumably associated with a dark cloud (Peretto & Fuller, 2009, see Fig. 1 and the catalogue of). The MAGMO (Green et al., 2012b) 18-cm continuum data revealed a weak (around 30 mJy or 2) source at the northern side of Fig. 1 near the 8.0-m emission which belongs to a long filament surrounding the whole dark cloud. The continuum source could be the result of imaging with inadequate -coverage of an extended 0.1-Jy Hii region located further north (outside the field of view). The MMB survey revealed no 6.7-GHz methanol maser in this source (Green et al., 2012a). Caswell (1998) found a weak OH maser about 15 south-east of the class I masers peaking at 40.8 km s-1, which implies no emission in the immediate vicinity of the methanol masers (1 rms is 0.1 Jy) given the primary beam size. However, the class I masers are located near the edge of the field of view for the water maser observations of Breen et al. (2010a). Therefore, it only excludes associations with a strong water maser (tens of Jy). This source may be an example of a very young star-forming region prior to the appearance of other masers, most notably the class II methanol maser at 6.7 GHz.
3.1.20 G326.860.68
This compact source is located at the western edge of a dark cloud (Peretto & Fuller, 2009), the interface of which might be directly associated with class I masers at B and C. The 6.7-GHz maser is also located nearby and is red-shifted with respect to all class I masers (Caswell, 2009; Green et al., 2012a, Fig. 1;). There is an EGO (Cyganowski et al., 2008, likely outflow candidate according to) several arcsec further west, which may be associated with the class I maser at D and some of the emission represented by A (the 36-GHz emission at A corresponds to both locations A and B at 44 GHz). An additional 1.5-Jy feature near 66.68 km s-1 may also be present, but has been excluded from Table 5 due to confusion with the peak at A. No 18-cm continuum emission has been detected in the MAGMO project (rms is 0.5 mJy).
3.1.21 G327.290.58
This is a relatively well studied region with a prominent hot core, infrared dark cloud (Leurini et al., 2013a; Wyrowski et al., 2006) and an EGO (Cyganowski et al., 2008, Fig. 1; possible outflow candidate according to). There are also indications that triggered star formation is taking place in this region (Minier et al., 2009). The position of the hot core (Wyrowski et al., 2006) suggests association with the class I masers at B,C and G as well as a rather weak (a few Jy) 6.7-GHz methanol maser and an infrared source (Caswell, 2009; Green et al., 2012a, see Fig. 1 and Table 5;). The observations of Wyrowski et al. (2006) registered this hot core in thermal methanol as an elongated 267 arcsec2 source extending up to the class I maser site at A. The EGO is located approximately the same angular distance further north-east on the same line (Fig. 1). The class I masers at E show a close position association with the EGO. Detected at 36-GHz only, the maser site H is located nearby. The masers at F, I and D also form a line, which is parallel but offset about 10 arcsec to the north. It seems likely that class I masers is this source trace an outflow emanating from the hot core in the north-east direction. The EGO and the masers at H and E could trace the terminal surface of the outflow. The hot core and the EGO correspond to the 450-m sources SMM1 and SMM4, respectively (Minier et al., 2009). The dark cloud is located north of the EGO position (Peretto & Fuller, 2009). No 18-cm emission has been detected in the MAGMO project within the boundaries shown in Fig. 1 with rather high rms of 18 mJy, perhaps due to the emission of Hii regions located outside the field. Wyrowski et al. (2008) detected 3-mm continuum emission co-located with the hot core. It is worth noting that the gaussian decomposition of the 44-GHz spectral profile at A does not approximate well the small dip around 46.1 km s-1 between the peak and the red-shifted component.
3.1.22 G327.390.20
This field has two 6.7-GHz masers, 327.3920.199 and 327.3950.197, each associated with its own cluster of class I maser emission (locations B and A, respectively) and infrared source (Caswell, 2009; Green et al., 2012a, see Fig. 1;). The infrared source associated with the western 6.7-GHz maser (327.3920.199, location B) is weaker but has an exended 4.5-m halo and was classified as an EGO (Cyganowski et al., 2008, possible outflow candidate according to). This 6.7-GHz maser has a notably wider velocity spread (from 87 to 79 km s-1) than the eastern 6.7-GHz maser (Green et al., 2012a, from 90 to 88; see). Similarly, the associated class I maser emission at B spans an almost 3 times wider velocity range than the maser at A, which suggests that an outflow might indeed be present. Due to the presence of a resolved (and most likely thermal) source, the position of the broad component in B may have an uncertainty at 36 GHz exceeding the values quoted in Table 5. No 18-cm continuum emission has been detected towards this source (MAGMO project, rms is 0.3 mJy).
3.1.23 G327.620.11
The distribution of class I maser emission in this source is rather compact (Fig. 1). The strongest emission is at A located in the immediate vicinity of a rather weak 6.7-GHz maser (Caswell, 2009; Green et al., 2012a, 3 Jy;), which is associated with the dominant infrared source in the Spitzer overlay (Fig. 1). The other site of class I maser emission (B, several arcsec to the south of A) contains a marginal spike and a broad component which may be quasi-thermal. It is worth noting that Green & McClure-Griffiths (2011) attributed this source to the far kinematic distance of 8.9 kpc, although the presence of a quasi-thermal emission would favour the near kinematic distance. No 18-cm continuum emission has been detected towards this source (MAGMO project, rms is 0.4 mJy).
3.1.24 G328.210.59
This is a rather compact source of class I maser emission located in an area devoid of strong infrared (see Fig. 1) and radio continuum sources (the 1 upper limit at 18-cm is 2 mJy according to MAGMO data), and most likely associated with a dark cloud (Peretto & Fuller, 2009). All the detected emission lies near the half-power point of the primary beam at 36 GHz. Therefore, the map may be missing maser emission further away from the pointing centre. The MMB project detected no 6.7-GHz maser in this source (Green et al., 2012a) and there seems to be no OH maser either (being about 3 arcmin offset from the following target, G328.240.55, this source is well within the 18-cm primary beam of Caswell (1998) observations which implies non-detection with noise rms of 0.1 Jy). This source may be a good example of the youngest stage of star formation, before the 6.7-GHz maser appears.
3.1.25 G328.240.55
Most of the class I maser emission is located near the 6.7-GHz maser associated with a compact Hii region (Phillips et al., 1998, see Fig. 1 and). The exception is the 36-GHz maser at C, which is most likely an unrelated source located well outside the 50 per cent sensitivity region. As an independent confirmation of this detection, there is also a hint at the position and velocity of this feature in the data on the following source, G328.250.53. But it does not satisfy the formal detection criterion and is further away from the pointing centre in that dataset. Therefore, the maser at C is described only in relation to this source. This is the only pair of targets in our sample which is sufficiently close to get the same feature detectable in two separate pointings.
The 36-GHz emission is quite weak at the remaining locations A and B. Therefore, no self-calibration was done at this frequency. The mid-infrared image is dominated by the strong 8.0 m cometary-shaped PDR located several seconds of arc north of the masers at A (see Fig. 1). An association of some of these masers with the PDR interface cannot be excluded. No radio continuum emission has been detected towards this PDR (data of Phillips et al. (1998) imply a 1 limit of 0.2 mJy at 3 cm; MAGMO data yielded no 18-cm detection in the whole field shown in Fig. 1 with rms of 2 mJy). The contours in Fig. 1 represent 3-cm continuum data (Phillips et al., 1998). There are a number of sources with emission excess at 4.5 m near class I masers at both A and B. However, none of these sources have qualified as an EGO, perhaps due to their size (Cyganowski et al., 2008).
3.1.26 G328.250.53
The class I maser emission is scattered across a large area. Most of the emission is at or beyond the half-power point of the primary beam with the exception of location A near the 6.7-GHz maser (south-western corner in Fig. 1, near the pointing centre). The locations C and F are in the area with diffuse 8.0 m emission, while B, D and E are situated in the area devoid of strong infrared sources, presumably at the edge of a dark cloud. The 6.7-GHz maser is associated with a hydroxyl maser (Caswell, 1998) and a strong infrared source, but no 18-cm continuum emission has been detected in the MAGMO project (1 rms is 2 mJy). There is also an EGO to the north of the dominant infrared source (Cyganowski et al., 2008, likely outflow candidate according to).
3.1.27 G328.810.63
The class I maser emission is spread over a large area comparable to the field of view. There are two very close and strong 6.7-GHz masers in this source (Caswell, 1997; Walsh et al., 1998; Green et al., 2012a, 25 separation; in excess of 300 Jy;) seen projected onto an Hii region (Caswell, 1997; Walsh et al., 1998, 200 mJy at 3 cm;) at the northern side of a complex infrared source (see Fig. 1). The weak 36-GHz emission at J is found nearby. The infrared source has been classified as a possible outflow candidate by Cyganowski et al. (2008), although the 4.5-m excess is not immediately obvious in the image. The southern diffuse part of the infrared source looks more prominent at 8.0 m and may actually represent a PDR. The class I masers at B, C and D detected at 44 GHz only seem to be associated with the southern interface of this PDR (see Fig. 1) and the dark cloud identified by Peretto & Fuller (2009) in the area located further south. The class I masers at A and H as well as the broad line and possibly quasi-thermal 36-GHz emission at I are also likely to be associated with this dark cloud. The remaining class I maser sites E, F and G are arranged in a line towards the northern direction and may trace an outflow propagating into a less dense environment away from the dense cloud.
3.1.28 G329.030.20
This region has two 6.7-GHz methanol masers, 329.0290.205 and 329.0310.198, in the south-east and the north-west, respectively. The former is quite strong and has a flux density in excess of 100 Jy. This source, along with the two following sources (G329.070.31 and G329.180.31), are associated with a continous filamentary infrared dark cloud (Ellingsen, 2006, see Fig. 17 of) and likely to have similar ages. This association strongly favours the near kinematic distance, although the ambiguity resolution of Green & McClure-Griffiths (2011), based on the absence of Hi self-absorption, implied the far kinematic distance of 12 kpc for both 6.7-GHz masers in this region. Each 6.7-GHz maser has its own class I maser cluster. The locations AD and I correspond to the north-western 6.7-GHz maser and trace a curved structure (with B,C and D) near the northern edge of the image in Fig. 1, which resembles a bow-shock. The remaining class I maser sites EH correspond to the south-eastern 6.7-GHz maser. The locations FH trace a linear structure with the 6.7-GHz maser situated between F and G, while E lies approximately 10 arcsec to the west and forms a separate arc structure (Fig. 1). The two 6.7-GHz masers have distinct velocity ranges: from 48.5 km s-1 to 41.5 km s-1 for the north-west maser and 41.5 km s-1 to 33.5 km s-1 for the south-east maser (Green et al., 2012a). While the north-western class I masers seem to share a similar velocity range with the associated 6.7-GHz maser, the other south-eastern group tends to cover a wider velocity range (from 45 km s-1 to 38 km s-1) encompassing that of both 6.7-GHz masers. The OH masers associated with the 6.7-GHz masers show a similar behaviour (Caswell, 1998). Embedded inside a dark cloud (Peretto & Fuller, 2009), this region is devoid of strong infrared sources. There is a faint 4.5-m source (Cyganowski et al., 2008, classified as an EGO; likely outflow candidate according to), which is located a few arcsec south of the class I masers at A and the 6.7-GHz masers. The location I is seen projected onto this EGO suggesting a physical association. No 18-cm continuum has been detected towards this source (MAGMO project, rms is 0.2 mJy).
3.1.29 G329.070.31
The class I maser emission is scattered across a large area over 1 arcmin in extent. The IRAC overlay is dominated by two strong infrared sources. The western infrared source is associated with the 6.7-GHz methanol and OH masers (Caswell et al., 1995; Caswell, 1998; Green et al., 2012a). There might be some extended 4.5-m emission near both infrared sources (Cyganowski et al., 2008, possible outflow candidates according to), although imaging artefacts cannot be completely excluded. In particular, one of these suspected EGOs (near the eastern source) may be associated with the class I masers at the location C. There is also a compact 4.5-m source near the maser location D. The 36-GHz maser at D shows a large radial velocity spread and a broad wing of emission towards the higher velocities (see Fig. 1 and Table 5). An unexpectedly large number of Gaussian components was required for the profile fit (see also Table 5). However, the profile was represented within the noise. Perhaps, location D is the site of interaction with the dense molecular cloud located between D, E and A (Simon et al., 2006; Peretto & Fuller, 2009). The fit overestimates the measured profile for the maser at E at the boundaries of components at the level of 23. No 18-cm continuum has been detected towards this source in the MAGMO project (1 rms is 0.3 mJy). It is worth noting that Green & McClure-Griffiths (2011) attributed this source to the far kinematic distance of 11.8 kpc. However, a large angular spread of class I maser spots results in linear offsets up to 2 pc and favours the near kinematic distance. As commented on the previous source, this source is associated with a continuous infrared dark filament (Ellingsen, 2006, see Fig. 17 of) along with G329.030.20 and G329.180.31, which would also suggest the near kinematic distance.
3.1.30 G329.180.31
The class I methanol masers are spread around a large area comparable to the field of view. They trace an elongated dark cloud, which has a number of infrared sources embedded in it (Peretto & Fuller, 2009, Fig. 1;). The 6.7-GHz methanol maser (Caswell, 2009; Green et al., 2012a) and the associated OH maser (Caswell, 1998) are co-located with one of these sources enshrouded by a very pronounced EGO (Cyganowski et al., 2008, likely outflow candidate according to). The class I masers at E are seen projected onto this EGO and, therefore, likely to be in close physical association. The emission at this location along with C, D and F trace a regular arc, with the 6.7-GHz maser located close to its vertex. Thus the structure may represent the walls of an outflow propagating at an angle to the plane of the sky. The 6.7-GHz maser and the class I masers at G, B and H form a line along the dark cloud (Fig. 1). This line may trace the other arm of the outflow which perhaps does not have as much material to interact with and extends further from the YSO. It is worth noting that there is a knot of the 4.5-m emission near G elongated in the same direction. Located near the northern tip of this knot is a marginal high-velocity feature, G, only at 44-GHz, which is blue-shifted by 20.9 km s-1 with respect to the middle of the velocity range of the 6.7-GHz maser (Table 5). Both these facts corroborate the idea that the outflow (most likely the approaching arm) is present in the area. The remaining class I maser sites A, IK are likely to be associated with the external interface of the dark cloud. No 18-cm continuum has been detected in this region (MAGMO project, rms is 3 mJy). As discussed for the previous two sources (G329.030.20 and G329.070.31), this source is also associated with the same filamentary infrared dark cloud (Ellingsen, 2006, see Fig. 17 of). In contrast to the previous two sources, Green & McClure-Griffiths (2011) attributed this source to the near kinematic distance of 3.3 kpc (which is consistent with the spread of maser spots and association with an IRDC). It is worth noting that the assignment of the previous two sources to the far kinematic distance was based on the absence of a detectable self absorption signal, which always carries a greater uncertainty. The assignment of this source also carried uncertainty as it was complicated by the presence of a local trough in the Hi emission at the same velocity as the absorption signal.
3.1.31 G329.470.50
The bulk of class I maser emission (locations B, C, EG and I) is tightly clustered around the position of the 6.7-GHz maser (Caswell, 2009; Green et al., 2012a, Fig. 1;) associated with an EGO (Cyganowski et al., 2008, likely outflow candidate according to). The maser at I (detected at 36-GHz only) shows very broad wings detectable over the range of velocities exceeding 15 km s-1. The remaining class I masers are well separated from the 6.7-GHz maser: A, D and H in the north, K in the south and J in the south-west, which is associated with the infrared source (Fig. 1). Note, that Green & McClure-Griffiths (2011) attributed this source to the far kinematic distance of 10.8 kpc. Although this estimate is entirely consistent with the compactness of the main cluster of masers, it implies projected linear separations between 1.2 and 2 pc for the offset sites. Therefore, the offset sites may represent unrelated sources. No cm-wavelength radio continuum has been detected towards this source (Walsh et al., 1998, rms of 0.4 mJy at 18 cm according to MAGMO data and 1 mJy at 3-cm according to).
3.1.32 G331.130.24
This source has two prominent Hii regions (Phillips et al., 1998, see MAGMO data in Fig. 1 and). The 6.7-GHz methanol and OH masers are located near the edge of the north-eastern Hii region (Phillips et al., 1998; Caswell et al., 2011a; Caswell, 1998) bordering an EGO (Cyganowski et al., 2008, likely outflow candidate according to). The class I methanol masers are scattered around this Hii region, with the location A situated near its southern edge. This location has one of a few known class I methanol masers at 9.9-GHz, which requires higher temperatures and densities to form than the common masers at 44 and 36 GHz (Voronkov et al., 2010b). Its velocity (91.16 km s-1) agrees with that of the peak 36- and 44-GHz component at A if the spectral resolution and the rest frequency uncertainty of the two experiments are taken into account. None of the class I maser locations seem to be close to the EGO. De Buizer (2003) found a single knot of 2.12 m H2 emission in the area a few seconds of arc north of B. There is an outflow in the source traced by the SiO emission (De Buizer et al., 2009) which is likely to be the cause of the class I maser emission at least in B and C. However, the tight geometry of the region does not allow us to draw reliable associations given the spatial resolution of the available data. The distribution of the class I maser emission suggests that the outflow axis may be close to the line of sight (this has also been considered by De Buizer et al. (2009) as a possible explanation for significant spatial overlap of the blue-shifted and red-shifted SiO emission) with perhaps some inclination in the north-eastern direction.
3.1.33 G331.340.35
This is a very compact class I maser, which is associated with an EGO (Cyganowski et al., 2008, possible outflow candidate according to) and located at the southern edge of a strong infrared source associated with the 6.7-GHz and OH masers (Caswell, 1996; Caswell, 1998; Caswell et al., 2011a, see Fig. 1;). There is a pronounced 8.0-m filament, thinner to the south-east of the infrared source (Fig. 1). At least some of this emission may trace the interface region of the dark cloud located just over 10 arcsec south of the masers (Peretto & Fuller, 2009). No 18-cm continuum emission has been detected within the boundaries shown in Fig. 1 (MAGMO project, rms is 3 mJy). Note, the profile fit systematically overestimates the peak at 44 GHz at the level of 23.
3.1.34 G331.440.19
Most of the class I maser emission (locations AC and E) lies in a straight line extending south-west from the position of a continuum source, presumably an ultra-compact Hii region (see Fig. 1, contours show 18-cm MAGMO data). The 6.7-GHz methanol (Caswell, 1996; Caswell et al., 2011a), OH (Caswell, 1998) and class I masers at D are seen projected onto the edge of the Hii region, a few arcsec north of the line traced by AC and E and may also be associated with a stronger infrared source located a few arcsec west of the Hii region. The maser at F is situated about 20 arcsec north of the 6.7-GHz maser and may be an unrelated source.
3.1.35 G332.300.09
This region has two 6.7-GHz masers, 332.2950.094 and 332.2960.094 which are only 3 arcsec apart (Caswell, 2009; Caswell et al., 2011a). The eastern 6.7-GHz maser (332.2960.094), newly discovered in the MMB project, is weak (a few Jy) and variable. It is associated with the northern edge of a well developed Hii region with a pronounced PDR traced by the 8.0-m emission (Fig. 1, contours show MAGMO 18-cm data). The majority of class I masers at A trace the same edge of the Hii region. The western 6.7-GHz maser (332.2950.094) is located at the south-eastern tip of an EGO (Cyganowski et al., 2008, possible outflow candidate according to). The class I masers at B as well as the 46.74 km s-1 44-GHz feature of A are associated with this EGO and located at the opposite sides. The remaining class I maser site C is located near the edge of another Hii region located about 10 arcsec west of the 6.7-GHz masers. There is also an infrared source with 4.5-m excess at C although it is not listed as an EGO by Cyganowski et al. (2008).
3.1.36 G332.600.17
The class I masers at A (see Fig. 1) and the 6.7-GHz maser (Caswell, 1996; Caswell et al., 2011a) are associated with a faint EGO (Cyganowski et al., 2008, likely outflow candidate according to). The location B, offset by about 10 arcsec to the north from the EGO position, corresponds to broad and possibly quasi-thermal lines at both 36 and 44 GHz. The source is located in a darker area on the Spitzer image surrounded by the 8.0-m emission, but not formally associated with any dark cloud identified by Peretto & Fuller (2009). No 18-cm continuum has been detected towards this source (MAGMO data, rms is 0.9 mJy).
3.1.37 G332.940.69
This region has an EGO (Cyganowski et al., 2008, likely outflow candidate according to) extending to the south-eastern direction from an infrared source associated with a weak (2 Jy) 6.7-GHz maser discovered in the MMB project (Caswell et al., 2011a). The class I masers at A are associated with the EGO. The other class I maser sites are offset (a few arcsec offset for B and over 15 arcsec for C) from the EGO and seen at the edge of a darker area in the Spitzer image enclosed by the 8.0-m emission and the EGO. Although this area is not listed as a dark cloud by Peretto & Fuller (2009), it probably harbours a molecular cloud. No 18-cm continuum emission has been detected in this source (MAGMO data, rms is 2 mJy).
3.1.38 G332.960.68
Most of the class I masers in this source are associated with a pronounced EGO (Cyganowski et al., 2008, likely outflow candidate according to). Associated with the 6.7-GHz maser (Caswell, 2009; Caswell et al., 2011a) is an infrared point source embedded in this arc-shaped EGO (see Fig. 1). Location B corresponds to the southern arm of this EGO, while location A corresponds to the northern arm and the edge of the source, and has a noticeably blue-shifted component at 36 GHz. Peretto & Fuller (2009) identified two dark clouds, located towards the western and the south-east direction from the EGO. Perhaps these clouds are a part of a common structure where this star-forming region is embedded. No 18-cm continuum has been detected within the boundaries shown in Fig. 1 (MAGMO data, rms is 3 mJy).
3.1.39 G333.030.06
This very compact source is located between a strong infrared source and a more extended region with 4.5-m excess (Fig. 1). However, the latter is not listed as an EGO by Cyganowski et al. (2008), perhaps due to the presence of the strong source. A rather weak (2 Jy) 6.7-GHz maser is co-located with the majority of the class I masers within the measurement uncertainty and shares a similar velocity range. No 18-cm continuum emission has been detected towards this source (MAGMO data, rms is 1 mJy).
3.1.40 G333.130.44
This is the only target in our sample which contains four 6.7-GHz methanol masers: a close pair of weak masers (333.1260.440 and 333.1280.440, separated by 7 arcsec, both weaker than several Jy) near the centre of the image shown in Fig. 1, 333.1210.434 in the west and another weak maser, 333.1350.431, in the north (Caswell et al., 2011a; Caswell, 1997). The distribution of class I maser emission suggests rather straightforward identification of each class I maser site with a particular 6.7-GHz maser. However, it must be noted that ambiguity cannot be completely excluded for class I masers corresponding to the close pair of the 6.7-GHz masers. The dominant infrared source in Fig. 1 is associated with the south-western 6.7-GHz maser of the pair, 333.1260.440. The class I masers at A are at the position of the 6.7-GHz maser within the measurement uncertainty and scattered within several arcsec of it. Note, decomposition of the spectral profile into the Gaussian components leaves systematic residuals near minima between individual peaks. The effect is seen at both frequencies, but is much more pronounced at 44 GHz. The class I maser at C is located 20 arcsec south of A and may be an unrelated source. The profile looks very similar to the peak of A, but is too strong to be an artefact. The north-eastern 6.7-GHz maser of the pair, 333.1280.440, is located near an infrared source (showing 3.6-m excess), but in an area devoid of extended infrared emission in the Spitzer overlay (Fig. 1). The associated class I masers (locations DF and H) are spread around 1010 arcsec2 area to the north-east, further away from the pair of 6.7-GHz masers. All this class I maser emission is blue-shifted with respect to the associated 6.7-GHz maser. The northern 6.7-GHz maser, 333.1350.431 is associated with the continuum source and an extended infrared source which appears green in the three-colour map (Fig. 1) suggesting an excess at 4.5m. However, this source is not listed as an EGO by Cyganowski et al. (2008). Unlike the other three sites, this one harbours an OH maser (Caswell, 1998). The class I methanol maser at G (only 44-GHz masers are detected) are located nearby, but appear not to be directly associated with the infrared source (about 10 arcsec offset from the 6.7-GHz maser). The 44-GHz maser is blue-shifted with respect to the northern 6.7-GHz maser. This location is beyond the half-power point of the primary beam at 44-GHz. Therefore, additional class I masers related to the same YSO could have been missed. The western 6.7-GHz maser, 333.1210.434, is related to the class I masers at B located within a few arcsec from it towards a north-western direction. At a comparable offset in the south-eastern direction lies a weak continuum source which may represent a working surface of an outflow. This site (B) is located near the edge of a dark cloud (Peretto & Fuller, 2009) with the rim traced by a long 8.0-m filament. Mottram et al. (2007) also reported a radio continuum emission extending from a prominent Hii region at the northern edge of Fig. 1 along the filament towards B (Urquhart et al., 2007, see also). Although we cannot exclude that the class I masers at B are directly associated with the 8.0-m filament, most likely they are related to an outflow in a separate high-mass star-forming region whose formation has been triggered by interaction of the dark cloud with its surroundings.
3.1.41 G333.130.56
This region has two close (separated by 6 arcsec) 6.7-GHz masers, 333.1280.560 at the south-west and 333.1300.560 at the north-east (Caswell, 2009; Caswell et al., 2011a). The latter is located a few arcsec from the infrared source which has been classified as an EGO and a possible outflow candidate by Cyganowski et al. (2008) despite being rather compact (see Fig. 1). Due to the close proximity of the 6.7-GHz masers, identification with the class I maser emission may be ambiguous, especially for location D which is equidistant. The class I masers at B are clustered around the EGO with some components seen projected onto it. Some of this emission forms a curved structure with the north-east 6.7-GHz maser (333.1300.560) and class I masers at D located along the line of symmetry suggesting a possible association. Note, the decomposition into Gaussian components of the 36-GHz emission at this location (Table 5) may have underestimated uncertainties, although it represents the profile (Fig. 1) within the noise. Most of the class I maser emission in this region is located at or near the edge (E and some emission at B) of extended 8.0m emission (Fig. 1). The masers at C are well separated (about 30 arcsec) from both 6.7-GHz masers and may be an unrelated source. Garay et al. (2004) found a massive dense core in the area using 1.2-mm emission. Despite the low spatial resolution, this core seems to be located between C and the other class I masers, perhaps centred in the region with a darker 8.0m background (see Fig. 1). The majority of class I maser emission in this source may be associated with the interface of this core. No 18-cm continuum has been found towards this source (MAGMO data, rms is 6 mJy).
3.1.42 G333.160.10
The infrared Spitzer image of this region is dominated by a strong source associated with an Hii region (18-cm peak is about 30 mJy according to MAGMO data; Fig. 1). The stronger class I masers at B and the 6.7-GHz maser (Caswell, 1996; Caswell et al., 2011a) are located near the edge of the Hii region, the weaker masers at A are a few arcsec south of it. The only reported limit on the water maser emission in this region is a relatively weak one imposed by the HOPS survey (Walsh et al., 2011, complete at 10 Jy;).
3.1.43 G333.180.09
This source has a pronounced EGO (Cyganowski et al., 2008, likely outflow candidate according to) with embedded infrared source associated with the 6.7-GHz methanol maser (Caswell, 1996; Caswell et al., 2011a, Fig. 1;). The class I maser emission at B and the 85.89-km s-1 44-GHz feature of A trace the edge of the EGO, which is presumably the interface with a dark cloud located towards the north-east (Peretto & Fuller, 2009). Note, the emission at B seems to be slightly extended suggesting a second component at a very close velocity and position. However, our present data do not allow us to separate these components. The remaining masers at the location A are situated near the 6.7-GHz maser and most likely associated with the EGO. No 18-cm continuum has been detected towards this source (MAGMO data, rms is 2 mJy). The only reported limit on the water maser emission in this region is a relatively weak one imposed by the HOPS survey (Walsh et al., 2011, complete at 10 Jy;).
3.1.44 G333.230.06
This source has two weak (both 2 Jy) 6.7-GHz masers separated by just over 5 arcsec (Caswell, 1996; Caswell et al., 2011a), 333.2340.060 in the north-west and 333.2340.062 in the south-east. The former is associated with an OH maser and a strong infrared source in the Spitzer overlay (Caswell, 1998, Fig. 1;). The whole complex is located in a darker area on the infrared overlay surrounded by the 8.0m emission suggesting the region is most likely embedded in a molecular cloud. The class I maser emission is scattered around the 6.7-GHz masers making the association with a particular 6.7-GHz maser ambiguous. We attribute emission at B and C to the south-eastern 6.7-GHz maser (333.2340.062) based purely on the smallest angular separation. Some emission at B traces an arc-like structure, suggesting a possible association with an outflow cavity. The remaining sites of the class I maser are attributed to the north-western 6.7-GHz maser (333.2340.060). The locations D and F are near the edge of the infrared source and the remaining locations A and E are separated from other class I maser emission by more than 10 arcsec. The class I masers at A include the strongest component (almost 300 Jy at 44 GHz) and have a very compact spatial distribution. Another noteworthy feature is a marginal high-velocity component at 106.4 km s-1 detected at 36 GHz only. It is blue-shifted by about 20 km s-1 with respect to the middle of the velocity range of the north-western 6.7-GHz maser. No 18-cm continuum has been detected towards this source (MAGMO data, rms is 2 mJy).
3.1.45 G333.320.11
The Spitzer infrared image of this region (see Fig. 1) is dominated by a strong source with an EGO at the north-western end (Cyganowski et al., 2008, possible outflow candidate according to). The 6.7-GHz maser (Caswell, 1996; Caswell et al., 2011a) and the 44-GHz masers at A are associated with the infrared source. The class I masers represented by location B include components seen projected at the EGO and near its edge. The rest of the class I maser emission lies several seconds of arc offset from the infrared source. No 18-cm continuum has been detected towards this source (MAGMO data, rms is 1 mJy).
3.1.46 G333.470.16
The striking feature of this source is a curved distribution of the class I maser masers at A, B, D and F mimicking a bow-shock. The 6.7-GHz methanol and OH masers are located near the apex of this structure (Caswell, 1998; Caswell et al., 2011a). This is also the location of an 18-cm continuum source with the peak flux density of about 30 mJy (see Fig. 1). Note, that the MAGMO data have rather high rms of 11 mJy for this source. From comparison with the 4-cm observation of Walsh et al. (1998), one may speculate that at least some of this emission corresponds to a working surface of a jet. However, given the quality of the available data, more sensitive continuum observations are required to establish the true nature of this source. The mid-infrared image reveals a pronounced EGO in this source (Cyganowski et al., 2008, likely outflow candidate according to) elongated roughly in the north-south direction. The class I masers at C, G, E and H as well as some spectral features represented by A trace this EGO. This source is a good demonstration of the mutual complementarity of the two class I methanol maser transitions at 36 and 44 GHz: the southern end of bow-shock structure is mainly traced by the 36-GHz masers while the southern end of the EGO is only traced by the 44-GHz masers. If only the 44-GHz data were available, this source would most likely be interpreted as an outflow along the EGO axis. The full data suggest that the outflow is most likely inclined towards the north-eastern direction and the EGO traces a side wall of this outflow.
3.1.47 G333.560.02
This is a very compact class I methanol maser source associated with the 6.7-GHz methanol maser (Caswell et al., 2011a) and located at the edge of the dark cloud (Peretto & Fuller, 2009) surrounded by the 8.0-m PDR emission (Fig. 1). The MAGMO data revealed no 18-cm continuum emission within the field of view shown in Fig. 1 with the rms of 7 mJy. The only reported limit on the water maser emission in this region is a relatively weak one imposed by the HOPS survey (Walsh et al., 2011, complete at 10 Jy;). This source may be at the earliest stage of its evolution.
3.1.48 G333.590.21
This source was found by Slysh et al. (1994) towards an IRAS source associated with the prominent Hii region G333.60.2 enclosed by a strong PDR ring traced by the 8.0-m emission (seen in the north-eastern corner of the field in Fig. 1). However, our interferometric observations revealed that all class I maser emission is located 45 arcsec away which explains only marginal 95-GHz detection by Val’tts et al. (2000). The MMB project revealed no 6.7-GHz methanol maser in the area (Caswell et al., 2011a). Also this location is within the primary beam of the OH measurement of Caswell (1998) which targeted masers near the Hii region. This implies the flux density limit of 0.1 Jy for OH masers (1) in the vicinity of the class I masers. No H2O maser emission has been reported by Breen et al. (2010a) at this location (the offset corresponds roughly to the half power point of their measurement implying an rms of 0.3 Jy). The class I masers are located at the edge of the dark cloud (Peretto & Fuller, 2009) and may represent the earliest stage of the evolution. The separation from the ionization front traced by the 8.0-m suggests that the maser emission is unlikely to be directly related to this front. However, the interaction of this front with the molecular gas seen as a dark cloud could have induced star formation which in turn gave rise to class I masers.
3.1.49 G335.060.43
This source has an EGO (Cyganowski et al., 2008, likely outflow candidate according to) distributed symmetrically about the position of the 6.7-GHz and OH masers (Caswell, 1998; Caswell, 2009; Caswell et al., 2011a, see Fig. 1;). The class I methanol masers at A, B and D appear to trace this EGO, and two other locations C and E are 20 arcsec offset to the west and east, respectively. The masers at A appear to form a curved structure which resembles the morphology of the 4.5-m emission in the northern side of the EGO. Most likely masers at A, B and D are tracing an outflow. No 18-cm continuum emission has been detected in the MAGMO project (rms is 0.5 mJy).
3.1.50 G335.590.29
This is a complex with 3 nearby 6.7-GHz maser sites, a close pair comprising 335.5850.290 and 335.5850.289, and the third source 335.5850.285, about 15 arcsec away. The close pair and the third source are both associated with the OH and H2O masers (Caswell, 1998; Breen et al., 2010a). Garay et al. (2002b) found no 6-cm continuum within the field shown in Fig. 1 (3 limit is 0.2 mJy). The mid-infrared overlay is dominated by a single strong source near the close pair of 6.7-GHz masers. The area surrounding the mid-infrared source and the 6.7-GHz masers has a number of sites with diffuse 4.5-m emisison which qualify as an EGO (Cyganowski et al., 2008, likely outflow candidate according to). Most class I methanol masers are scattered around the EGO and 6.7-GHz masers over the area approximately 30 arcsec in extent. The exception is the 44-GHz maser at C, which is located well outside the 50 per cent sensitivity region and may be a separate source (assuming the distance of 3.3 kpc, the projected linear separation from the nearest 6.7-GHz maser is about 0.9 pc). This source has recently been the object of a detailed investigation by Peretto et al. (2013). The 6.7-GHz methanol masers in this source are associated with a 550 M⊙ dust clump and lie towards the centre of an infared dark cloud from which a number of filaments appear to emanate (Peretto & Fuller, 2009, in particular, class I masers at G and D may be associated with the edge of this cloud, see also). Mopra HCO (10) observations show blue-shifted self-absorption features within both the filaments and the body of the cloud and this has been interpreted as evidence for large-scale infall towards the central high-mass core. The morphology of the class I maser distribution seems to have a preferential direction from south-east to north-west, roughly along the line traced by the 6.7-GHz masers and the axis of the EGO, which likely indicates the presence of an outflow in this source. It is worth noting that the SiO (21) data corroborate the presence of a bipolar outflow (Garay et al., 2002b).
3.1.51 G335.790.17
The Spitzer infrared image (Fig. 1) reveals a very pronounced EGO (Cyganowski et al., 2008, likely outflow candidate according to) and an 8.0-m filament. A rather strong 6.7-GHz maser (100 Jy) is located at the southern tip of the EGO (Caswell, 1996; Caswell et al., 2011a) and coincides with the mainline OH maser (Caswell, 1998). The class I maser emission at C, D and G is seen projected at the EGO or located near its edge. Note, the uncertainties of all parameters of the 48.933-km s-1 44-GHz Gaussian component of C (Table 5) are underestimated due to confusion with the peak. The masers at A, B, E and F are likely to be related to the 8.0-m filament. The 44-GHz emission represented by F contains a broad component which is most likely a compact part of a resolved thermal source. Therefore, the corresponding fit parameters have large systematic uncertainties. The remaining maser at H, which has been detected only at 36 GHz, is slightly (5 arcsec) offset from the EGO. There is no 18-cm measurement for this source in the MAGMO data.
3.1.52 G336.410.26
The class I maser emission in this source is confined to two sites located about 10 arcsec apart. Both sites are near the edges of infrared sources surrounded by extended 8.0-m structure (Fig. 1), perhaps an embedded cluster of young sources. The 6.7-GHz maser is located within this structure at a clearly distinct position (Caswell, 2009; Caswell et al., 2011a). The infrared source at A is associated with a weak (9 mJy at 3 cm) Hii region (Phillips et al., 1998, Fig. 1; see also). The contours in Fig. 1 represent 3-cm continuum based on archival data (project code C379, observations made on the 5th of July 1995). Peretto & Fuller (2009) identified a compact dark cloud to the south of the 8.0-m source. However, no class I maser emission appears to be associated with it. Phillips et al. (1998) indicated that additional weaker continuum emission may be present in the area, including the location of the 6.7-GHz maser. They also suspected that an additional weak 6.7-GHz maser might be present near the strong infrared source about 20 arcsec south-west of class I masers. The only reported limit on the water maser emission in this region is a relatively weak one imposed by the HOPS survey (Walsh et al., 2011, complete at 10 Jy;).
3.1.53 G337.400.40
Most of the class I maser emission is located in the vicinity of the strong radio continuum and mid-infrared source (see Fig. 1), including a tight cluster near the continuum peak, which lies a few seconds of arc south of the 6.7-GHz methanol (Walsh et al., 1998; Caswell, 2009; Caswell et al., 2011a) and ground-state OH masers (Caswell, 1998) but coincident with 6035-MHz OH masers (Caswell, 2001). There is extended infrared emission with a 4.5-m excess around this source. However this site is not listed as an EGO by Cyganowski et al. (2008), perhaps due to the effects of the strong source. The radio-continuum emission was interpreted by Guzmán et al. (2012) as an ionized jet which is driving a high-velocity molecular outflow detected between 85 and 41 km s-1. The location A is most likely associated with this outflow. It has multiple 44-GHz spectral features and a weak continuous 36-GHz emission across the velocity interval over 10 km s-1, roughly symmetric with respect to the 6.7-GHz maser (Walsh et al., 1998; Caswell, 2009; Caswell et al., 2011a, c.f. spectra of) and the ambient gas velocity (Guzmán et al., 2012, assumed to be 40.7 km s-1;). The 36-GHz feature at 36.53 km s-1 is located at a spatially distinct position but overlaps in velocity with the 36-GHz emission emanating from the location A. Therefore, its spectrum is presented separately (location E in Fig. 1). The 44-GHz spectrum can be adequately repesented by a single plot (location A) despite the spatial spread covering both locations A and E at 36 GHz. A weaker extended radio-continuum source, presumably an evolved Hii region, is associated with the PDR located in south-east corner of the image (Fig. 1) and traced by the strong 8.0 m emission. Its relation to the jet is unknown at present. Two sites of weak 36-GHz masers (at C and B) are offset by over 30 arcsec, and may be unrelated.
3.1.54 G337.920.46
The class I maser emission is spread over a large area exceeding the nominal field of view of our experiment. The Spitzer image reveals a long curved 8.0-m filament spanning across the whole area shown in Fig. 1 and a pronounced EGO in the south-eastern corner (Cyganowski et al., 2008, likely outflow candidate according to). The filament contains a strong infrared source at the northern edge of the field which is associated with an Hii region (Walsh et al., 1998, Fig. 1;). Some weaker and probably partially resolved 18-cm emission has also been detected at other parts of the filament (MAGMO data, see Fig. 1). Peretto & Fuller (2009) identified a large dark cloud north-east of the filament. Perhaps, this filament traces a PDR at the interface of the molecular cloud. The class I masers at A and E (note, the 44-GHz maser at A is quite strong exceeding 300 Jy) are located near the edge of the EGO and are presumably associated with it. The masers at BD are in the same general area, but clearly separated from the EGO. The remaining class I masers (at FI) are all located outside the 50 per cent sensitivity region at 44 GHz and trace the western edge of the 8.0-m filament being several arcsec further west. A 6.7-GHz maser is located close to G and associated with a weak 4.5-m source (Walsh et al., 1998; Caswell, 2009; Caswell et al., 2011a, Fig. 1;) which is not listed as an EGO by Cyganowski et al. (2008). Caswell (1998) reported two OH masers in the area, the weaker one is associated with the 6.7-GHz maser and the stronger one is located near the EGO and the class I methanol masers at E. Therefore, the class I masers clustered around the EGO (locations AE) may correspond to a separate star forming region which happens to have no 6.7-GHz methanol maser.
3.1.55 G338.920.55
This is a complex source with class I maser emission scattered over a large area about 1 arcmin in extent and two 6.7-GHz methanol masers, 338.9200.550 in the south and 338.9250.557 in the north (Fig. 1). The southern 6.7-GHz maser has an order of magnitude higher flux density and is associated with a strong infrared source (Caswell, 2009; Caswell et al., 2011a). The northern 6.7-GHz maser has an associated OH maser (Caswell, 1998). Cyganowski et al. (2008) identified two EGOs in the region (both are classified as possible outflow candidates), one extending to the south from the position of the southern 6.7-GHz maser (338.9200.550) and the other a few seconds of arc south of the northern 6.7-GHz maser (338.9250.557). Note, there is also a 4.5-m source exactly at the position of the northern 6.7-GHz maser which is not classified as an EGO by Cyganowski et al. (2008). The class I methanol masers at BD are situated near the southern EGO and the infrared source associated with the 6.7-GHz maser. The northern EGO appears to be related to the class I masers at H and the location I is only a few seconds of arc north-west of the norhtern 6.7-GHz maser and the 4.5-m source. The other class I maser sites do not show obvious associations and those at G and J could even be unrelated sources. Peretto & Fuller (2009) identified two rather extended dark clouds to the east of the region. The class I masers at G and J, and potentially also masers at E and F, could be associated with the interface of the corresponding molecular cloud. It is worth noting that both 36 and 44 GHz masers are quite strong at a number of locations in this source (the peak flux density at G is about 400 and 200 Jy at 44 and 36 GHz, respectively). Despite the strength, the 44-GHz spectral profile of G is fitted very well with a single Gaussian (see Table 5) with only marginal systematic error in the tail (the actual profile seems a bit narrower than the fit). In contrast, it was found to be difficult to fit the slightly weaker double-peaked 44-GHz profile of A within the noise. The actual profile is a bit narrower than the fit and there is a couple of Jy systematic error in the peak fluxes. Another noteworthy feature of this source is a large velocity spread (about 20 km s-1) of both 36- and 44-GHz masers at F (blue-shifted with respect to the middle of the 6.7-GHz maser velocity range by about 15 km s-1). The water maser associated with the nothern 6.7-GHz methanol maser (located about 12 arcsec away from F) has a high velocity emission extending to 86 km s-1 (Breen et al., 2010a). No radio continuum emission has been detected towards this source (Urquhart et al., 2007, MAGMO rms is 2 mJy; 3- and 6-cm rms is about 0.2 mJy according to).
3.1.56 G339.881.26
This region is outside the GLIMPSE coverage, but was studied in the near infrared by Walsh et al. (1999). It harbours one of the strongest known 6.7-GHz masers (Caswell, 2009; Caswell et al., 2011a, 1000 Jy; see e.g.) which is located roughly on the line joining two sites of the class I maser emission separated by about 40 arcsec (Fig. 1). The direction of this line roughly corresponds to the direction of the dark lane at 2 m pointed out by Walsh et al. (1999). The 6.7-GHz maser is seen projected onto an Hii region (Ellingsen et al., 1996) associated with the near-infrared source (Walsh et al., 1999), and has nearby OH and H2O masers (Caswell, 1998; Breen et al., 2010a). Contours in Fig. 1 represent the 3-cm continuum measurement of Ellingsen et al. (1996).
3.1.57 G341.190.23
The spatial distribution of class I maser emission is very compact in this source (only a few seconds of arc across), but it has an extremely wide velocity spread at 36 GHz, with almost continuous emission covering over 50 km s-1 (Fig. 1). This spectrum looks ordinary at 44 GHz, although the extreme 36-GHz velocity components are outside the velocity coverage at 44 GHz. The class I maser emission forms an arc-like structure with the lower velocities tending to be at the southern end. It is seen projected onto an infrared dark cloud (Peretto & Fuller, 2009, see the catalogue of) and is located approximately 05 from the edge of a bubble seen in IRAC images (Churchwell et al., 2006, labelled S24 in). No 6.7-GHz maser was detected in the MMB project at the location of class I masers (Caswell et al., 2011a). Observations of the OH maser towards another source, G341.220.21, by Caswell (1998) included this source in the field of view implying no hydroxyl maser emission stronger than 0.1 Jy (1). However, this source is at the edge of the field of view for the 22-GHz measurement of Breen et al. (2010a), so the only reported limit on the water maser emission in this region is a relatively weak one imposed by the HOPS survey (Walsh et al., 2011, complete at 10 Jy;). The MAGMO data yielded no 18-cm continuum within the field of view shown in Fig. 1 with rms noise level of 2 mJy. This source appears to be a good example of a very young star-forming region prior to the phase when the 6.7-GHz methanol maser is switched on. Perhaps an outflow has just turned on in this source and has not yet had time to propagate into the surrounding cloud.
3.1.58 G341.220.21
Most of the class I maser emission is scattered around the strongest infrared source projected onto the edge of a small bubble about 10 arcsec in diameter which is traced by the 8.0-m emission (shown in red in Fig. 1). This complex is located 05 north from the much larger bubble discussed in relation to G341.190.23 (Churchwell et al., 2006, labelled S24 in). No 18-cm radio continuum emission has been detected in the MAGMO project (rms noise level is 2 mJy) within the shown boundaries of the image, including the area inside the small bubble. The MMB project detected a strong (100 Jy) 6.7-GHz methanol maser near the peak of the dominant infrared source with the emission spanning the velocity range from 50 to 35 km s-1 (Caswell et al., 2011a). There are both hydroxyl (Caswell, 1998) and water (Breen et al., 2010a) masers near this location with similar velocities.
3.1.59 G343.120.06
Also known as IRAS 16547-4247, this region comprises a triple cm-wavelength continuum source interpreted as a thermal jet with two internal working surfaces and a jet-driven molecular outflow (Garay et al., 2003; Brooks et al., 2003). The 2.12-m molecular hydrogen emission mapped by Brooks et al. (2003) is shown in Fig. 1 by magenta contours. The triple continuum source is shown by red contours (Voronkov et al., 2006, 12-mm data from). We did not have a convincing detection of this source in the MAGMO data given the 1 rms noise level of about 2 mJy, which is comparable to the peak flux density expected from the measurement of Garay et al. (2003). No 6.7-GHz methanol maser has been detected towards this source in the MMB survey (Caswell et al., 2011a), but an OH maser coincides with the continuum core (Caswell, 1998).
This is a well known site of class I methanol maser emission, which can perhaps be called an archetypal class I maser source with outflow association (Voronkov et al., 2006). In this paper we present the first interferometric observation of this region at 36 and 44 GHz. The previous study of Voronkov et al. (2006) mapped the region at 84 and 95-GHz, which are high excitation energy counterparts of the 36- and 44-GHz methanol transitions, respectively, and are expected to show similar observational properties. Voronkov et al. (2006) found these common class I methanol masers to be scattered over a large area tracing well the southern part of the molecular outflow (locations A-C in Fig. 1). A number of rare masers found in this source were shown to be confined to a single location B associated with the strongest knot of the 2.12-m molecular hydrogen emission (see Fig. 1). In general, there is a good agreement between this study and the results of Voronkov et al. (2006) for the common locations A to F despite different transitions, as expected. However, there is a mismatch between radial velocities of corresponding Gaussian components of up to 0.4 km s-1 (but typically about 0.1 km s-1), which notably exceeds the formal fit uncertainty in most cases. At the same time, the position fit usually agrees well even within the formal 3 fit uncertainty (there are additional systematics affecting the absolute position which strictly speaking should be taken into account to compare separate measurements at different frequencies). Although in some cases the velocity mismatch could be explained by the rest frequency uncertainty (1 uncertainty is 0.04 and 0.03 km s-1 for 84 and 95-GHz transitions, respectively), it most likely suggests that a finer structure with different trends on the excitation energy is present. A higher spatial resolution observation is required to confirm this. Having a wider field of view and observing transitions which are easier to excite, the present study has revealed class I maser emission in a few additional locations in the region, labelled G to J, as well as additional weaker components for the known locations A to F.
The new class I masers at H and J are located only a few seconds of arc from the northern part of the molecular outflow (Fig. 1). Sensitive observations along the whole span of the outflow (Brooks et al., 2003, about 2 arcmin;) are likely to reveal further sites of the class I masers in this source. The infrared image reveals an EGO (Cyganowski et al., 2008, called likely outflow candidate by) covering the area around the southern lobe of the triple continuum source and towards the central source (Fig. 1). There is also a region with an excess of 4.5-m emission between the central source and the northern lobe which is not very pronounced due to the presence of a strong nearby infrared source. The area of shocked gas traced by the 4.5-m emission is largely devoid of class I masers (location D is the exception).
3.1.60 G344.230.57
The class I masers in this source are scattered over a large area exceeding 15 across. The distribution hints at two linear structures formed by class I maser emission, which intersect near H (Fig. 1). The north-east to south-west line comprises class I masers at B, C, H, I and L. Masers at A, D and G are loosely associated with the same direction without a perfect alignment. The other line lies approximately at 70° angle connecting class I masers at E, F, H and K. The masers at G may also be loosely associated with this direction. The morphology suggests that either one or two outflows originating near G, H or I are likely to be present in this source. The 6.7-GHz maser is located near I and has a velocity spread exceeding 20 km s-1 (Caswell et al., 1995; Walsh et al., 1998; Caswell et al., 2011a). Interestingly, the spectral profiles for both 36- and 44-GHz masers at I show a pronounced blue wing covering the whole velocity range spanned by class I masers in this source which exceeds 10 km s-1. The same general area hosts the mainline OH maser emission which tends to be blue-shifted with respect to the class I maser emission (Caswell, 1998; Argon et al., 2000) and a weak (a few Jy) water maser spanning a large velocity range over 60 km s-1 (Breen et al., 2010a). Breen et al. (2010a) also reported an additional weak (1 Jy) H2O maser located between E and K, on the line traced by class I masers. It is worth noting that Cyganowski et al. (2008) identified two EGOs in this source, one likely outflow candidate is in this exact region, near class I masers at G and H, and the other EGO is listed in the possible outflow category and located at B. Located near the northern edge of the image shown in Fig. 1, the class I masers at J are not part of the linear structures described above and may be an unrelated site. No 18-cm radio continuum emission has been detected towards this source (MAGMO project, rms is 3 mJy). Note, the 44-GHz profile of C is fitted with a systematic residual in the wings of the main peak, comparable to the noise level. The fit also does not represent well the dip between the main peak and the blue-shifted satellite, overestimating the flux density at these velocities by up to 0.5 Jy. Although fitted within the noise, the Gaussian decomposition for the 36-GHz profile corresponding to the location I (Table 5) is unlikely to represent well the blue wing due to artefacts caused by confusion with G.
3.1.61 G345.000.22
The region has two 6.7-GHz masers, 345.0030.223 and 345.0030.224, which are separated by only 3 arcsec and do not overlap in velocity (Caswell, 2009; Caswell et al., 2010). Both masers are quite strong, with the western maser (345.0030.223) being the strongest, exceeding 200 Jy (Phillips et al., 1998, see also). The class I methanol masers are scattered around them and cannot be unambiguously attributed to a particular 6.7-GHz maser (see Fig. 1), neither using the offset in position, nor the velocity. The Spitzer overlay is dominated by two strong infrared sources (note, the 8.0-m image suggests the presence of a third source in this cluster), the stronger of which is associated with the 6.7-GHz masers (Fig. 1). The infrared sources are enshrouded by diffuse 4.5-m emission presented by Cyganowski et al. (2008) as two EGOs, both in the possible outflow category. The class I masers at C, and possibly the strongest site A as well, may be associated with these EGOs. The masers at B are likely to be associated with an elongated filamentary dark cloud which is located immediately to the east of the infrared sources (Peretto & Fuller, 2009). The remaining sites D and E have unclear associations. However, it is worth mentioning that they are located in the region with the overall darker 8.0-m background although not formally listed as a dark cloud. There is no 18-cm measurement for this source in the MAGMO data, but Phillips et al. (1998) reports the detection of the 3-cm continuum with the peak flux density of about 0.18 Jy associated with the weaker eastern 6.7-GHz maser (345.0030.224). The same site also has an OH maser (Caswell, 1998; Argon et al., 2000) and a nearby water maser (Breen et al., 2010a) detected. The latter exhibited highly variable high-velocity features with about 100 km s-1 velocity span (Breen et al., 2010a) suggesting outflow activity.
3.1.62 G345.011.79
This source is renowned for a large number of detected methanol masers of both classes along with thermal molecular emission of other species (see Salii & Sobolev, 2006; Ellingsen et al., 2012; Val’tts, 1998, and references therein). There are two 6.7-GHz masers in the region separated by 19 arcsec, 345.0101.792 in the south and 345.0121.797 in the north (Caswell, 2009; Caswell et al., 2010, see Fig. 1;). The southern 6.7-GHz maser is associated with an ultra-compact Hii region (Fig. 1), OH maser (Caswell, 1998), and is quite strong (Caswell et al., 2010, 200 Jy;). It is this site which harbours the rare class II masers (Cragg et al., 2001). This 6.7-GHz maser has largely more negative velocities than the class I maser emission in the region with the notable exception of the 44-GHz maser at F peaking at 17.34 km s-1. The class I masers have velocities similar to that of the thermal gas (Cragg et al., 2001; Salii & Sobolev, 2006, compare Fig. 1 with). The Spitzer mid-infrared overlay shown in Fig. 1 is dominated by two infrared sources associated with each of the 6.7-GHz masers and an extended feature to the west of the southern 6.7-GHz maser which is more prominent at 8.0m. The latter may be part of a shell-like PDR structure with diffuse edges. The MAGMO data indicate the presence of resolved 18-cm continuum emission inside the shell (Fig. 1), which corroborates the idea that the 8.0-m feature corresponds to a PDR around an old Hii region. The two infrared sources associated with the 6.7-GHz masers are both seen embedded in extended 4.5-m emission sources, neither of which qualified as an EGO according to Cyganowski et al. (2008) perhaps due to rather regular shape and confusion effects. Contrary to the conclusions of Val’tts (1998), most of the class I maser emission is found offset from the position of the southern 6.7-GHz maser. The exception is the 44-GHz maser at F which can be associated with either the southern possible EGO or the PDR emission. The class I masers at A and B are located in the vicinity of the northern 6.7-GHz maser and the 4.5-m emission source. The maser site C, which is the strongest in this source with peak flux density of almost 100 Jy at 44-GHz (note, the fit presented in Table 5 systematically underestimates the red wing of this profile for a number of consecutive spectral channels at the level of 1), and E might both be associated with the diffuse 8.0-m PDR emission (the extension to E is too weak to see in Fig. 1). The remaining class I masers at D and G are located in the vicinity of a chain of weak deeply embedded infrared sources (too faint to see in Fig, 1) and may be related to the stars forming in this part of the molecular cloud. It is worth noting that Breen et al. (2010a) found a water maser (additional to two water masers near each of the 6.7-GHz masers) located approximately half way between D and G and the northern 6.7-GHz maser. This region of the image is outside the 50 per cent sensitivity area and therefore additional class I methanol masers may be missing.
3.1.63 G345.420.95
The class I masers in this source were first detected by Slysh et al. (1994) towards the water maser position quoted by Batchelor et al. (1980), which had only an arcmin accuracy. Therefore, this was essentially a serendipitous detection given the actual distribution of the class I masers shown in Fig. 1 which are all located at or beyond the half-power point of the primary beam at 36 GHz. The regon has two well-separated 6.7-GHz masers, 345.4240.951 in the north-east corner of Fig. 1 and 345.4070.952 in the south (Caswell, 2009; Caswell et al., 2010). The latter has an associated OH maser (Caswell, 1998) and an Hii region (Fig. 1). The contours in Fig. 1 show 3-cm data from the ATCA archive (observations done in 1994, on July, 30th; project code C380). The peak is about 240 mJy, but these continuum data do not have adequate -coverage to capture extended structures which are likely to be present in this region, in particular in the area towards the strong infrared cluster located to the west of the southern 6.7-GHz methanol maser and a shell-like feature seen at 8.0m (Rodgers et al., 1960, Fig. 1; this region is also known as RCW 117, see). Breen et al. (2010a) detected a number of water masers in the area, which included counterparts of both 6.7-GHz methanol masers, another location about 15 arcsec to the north-east of the southern 6.7-GHz methanol maser (in the vicinity of A and a compact 4.5-m source), and a number of masers associated with the infrared cluster and the shell. The class I maser emission is found in three well-separated locations. With only modest offsets, the masers at A and C are likely to be related to the southern and northern 6.7-GHz masers, respectively. The strongest site B is seen projected onto the 8.0-m shell. It is worth noting that there is also a weaker (about 20 mJy at 3-cm) continuum source in the vicinity of class I masers at C. Peretto & Fuller (2009) identified an extended dark cloud north-west of the infrared cluster which does not seem to be directly related to any of the detected class I maser sites. However, the water maser referred to as G345.4060.942 by Breen et al. (2010a), which, with the caution about variability, could be the original water maser observed by Batchelor et al. (1980), is likely to be associated with an interface of this cloud.
3.1.64 G345.500.35
The Spitzer overlay is dominated by a strong infrared source (Fig. 1) which is associated with an OH (Caswell, 1998) and a strong (about 300 Jy) 6.7-GHz methanol maser (Caswell, 2009; Caswell et al., 2010). No radio continuum emission has been detected towards the infrared source (Garay et al., 2006, rms is about 0.50.7 mJy;). There is however a nearby extended Hii region located just outside the region shown in Fig. 1. The strong infrared emission in the south-western corner of Fig. 1 originates in the associated PDR of this Hii region. The region has a prominent 4.5-m filament extending from the dominant infrared source associated with the 6.7-GHz maser towards C (Cyganowski et al., 2008, "outflow-only" EGO according to). Extended 4.5-m emission is also found in other parts of the field, particularly in the vicinity of the infrared source. There is also a hint at a second 4.5-m filament in the direction towards E (see Fig. 1). No class I maser emission was found directly associated with either of these filaments. However, the masers at A and B may be associated with the other sources of 4.5-m emission mentioned above. It is worth noting that the class I masers at B may also be related to the ionization front of the Hii region and its associated PDR. Peretto & Fuller (2009) identified a large dark cloud south-west of this target. The class I masers at A and E may be associated with the interfaces of this cloud. The weak 44-GHz maser at D has a small angular separation from the 6.7-GHz methanol maser and is seen projected onto the dominant infrared source. Green & McClure-Griffiths (2011) remark that, kinematically, a distance allocation of 10.8 kpc seemed likely. However this location would make the 6.7-GHz maser the most luminous in the far portion of the 3 kpc arm, and evidence from Hi self-absorption (and previous literature) favoured a near distance (close to 1 kpc, in the Carina-Sagittarius arm ). We, too, suggest that the near distance is more likely, based on the class I emission: sites C and E and the 6.7-GHz maser appear to be physically associated (linked by 4.5-m filaments) and their separation of 0.2 pc (at the near distance) seems far more likely than the improbably large value of 2 pc that would be implied by a distance exceeding 10 kpc.
3.1.65 G348.180.48
The 44-GHz emission was first reported in this source by Slysh et al. (1994), who named it 348.180.49, with the sign error in latitude. They observed this source at the single dish position of the H2O maser found by Braz & Scalise (1982). Due to the absence of better data, the same position was used as the pointing centre in our observations. Braz & Scalise (1982) found this source targetting the OH maser reported by Turner (1970). However, as discussed by Caswell et al. (1983), the latter might have been a spurious detection, although an absorption feature centred at 8 km s-1 (similar to velocities of class I masers) was definitely present at both 1665 and 1667 MHz. The MMB survey found no 6.7-GHz methanol maser towards this source and, therefore, there was no 18-cm measurement for this source in the MAGMO project. The class I methanol masers are located near the Hii region RCW 120, a perfect bubble with a well defined ionization front traced by the 8.0 m emission (Deharveng et al., 2009, red stripe in Fig. 1; c.f. condensation 1 of). The maser emission at AC and F seems to trace the ionization front, while other locations are situated further away, on the opposite side of a massive 140250 M⊙ core (Deharveng et al., 2009). As discussed by Deharveng et al. (2009), the area is the site of ongoing induced star-formation (Thompson et al., 2012, see also). Therefore, the latter locations of maser emission may be caused by the second generation stars. The infrared map reveals a number of sources with the excess of 4.5-m emission, but most of them are compact (see Fig. 1). Cyganowski et al. (2008) found an EGO which is a possible outflow candidate located just over a minute of arc to the south-east from the most eastern class I maser locations A to C.
3.1.66 G349.090.11
This source has two 6.7-GHz masers, 349.0920.105 and 349.0920.106, separated by just 2 arcsec (Caswell, 2009; Caswell et al., 2010). The north-western 6.7-GHz maser (349.0920.106) is weaker and has an associated OH maser (Caswell, 1998). Both 6.7-GHz masers are seen projected onto an infrared source with 4.5-m excess (see Fig. 1) which did not qualify as an EGO according to Cyganowski et al. (2008), perhaps due to its small size and regular shape. The class I maser emission is found in two sites within several arcseconds of the likely EGO. The weaker maser at B may be directly associated with the edge of the 4.5-m source. Due to the close separation of the 6.7-GHz masers it is not possible to attribute each class I maser site to either particular 6.7-GHz maser. No 18-cm continuum emission has been detected towards this source (MAGMO project; rms is 6 mJy).
3.1.67 G351.160.70
This source belongs to the NGC 6334 complex (Hashimoto et al., 2008; Russeil et al., 2013, source V; see, e.g.,). The Spitzer overlay reveals a nebulosity with a bipolar appearance (Hashimoto et al., 2008, Fig. 1; see also) which would normally be interpreted as an outflow given the strong 4.5-m emission in the lobes (Cyganowski et al., 2008, note, the source is outside the region inspected by). Hashimoto et al. (2007) argued that there are at least two high-mass YSOs near the centre of the symmetry of this outflow, and the western and eastern nebulae may actually be powered by different sources. It is worth noting that the 6.7-GHz maser is offset by a few seconds of arc from the strongest infrared source (Caswell, 2009; Caswell et al., 2010, Fig. 1;). An associated OH maser (offset by 18 from the position of the 6.7-GHz methanol maser) is located closer to the strongest infrared core and has a wide velocity range of 17 km s-1 (Caswell, 1998). Breen et al. (2010a) found two water masers in the area, one near the OH and the 6.7-GHz methanol masers and the other located a few seconds of arc offset, at the northern edge of the infrared nebulosity. Most of the class I masers (sites AC and F) are concentrated towards the western edge of Fig. 1, near the half-power point of the primary beam at 44-GHz. The masers at B and C are located in the general direction of the western outflow lobe (and some faint 4.5-m emission is present in the immediate vicinity of B). All these sites, including A and F, are likely to be associated with the outflow propagating in the westward direction. Note, the parameters of Gaussian components representing the peak of A and its blue wing at both 36 and 44 GHz are likely to be more uncertain than the formal errors shown in Table 5 due to complexity of the spectra. There are also systematic residuals at both frequencies in the profile fits for the masers at B (systematic offsets below 2 at the velocities corresponding to the blue wing at 44 GHz and underestimation of the peak flux density at a 6 level at 36 GHz). The site D detected only at 44 GHz is located at the edge of the eastern lobe. The remaining site E, also detected only at 44-GHz, is located several seconds of arc to the south of the centre of the bipolar structure. The infrared maps (Hashimoto et al., 2008, Fig. 1 and, e.g.,) suggest somewhat higher levels of extinction towards the south, south-west and north-west of the outflow. The class I masers appear to reside in the corresponding molecular clouds. No 18-cm continuum emission has been detected within the boundaries of the field shown in Fig. 1 in the MAGMO project (with a rather high rms of 39 mJy due to confusing sources). However, the whole region is known to have diffuse radio-continuum emission (Muñoz et al., 2007, see, e.g.,) which has been either resolved or otherwise not imaged adequately with the -coverage of the MAGMO experiment tailored for the maser observations.
3.1.68 G351.240.67
This is another source from the NGC 6334 complex (Hashimoto et al., 2008; Muñoz et al., 2007, source IV, which is also known as source A; see, e.g.,). The class I methanol masers are clustered around the 6.7-GHz maser, which does not appear to be associated with any mid-infrared source (Caswell et al., 2010, Fig. 1;). The class II maser site 351.2420.670 (or 351.2430.671) is discussed extensively by Caswell & Phillips (2008). It is notable for its strong water maser which is dominated by a blue-shifted outflow extending more than 100 km s-1 from the systemic velocity. Caswell & Phillips (2008) noted the non-detection of OH, with upper limit 0.4 Jy. Breen et al. (2010a) summarise additional data on nearby water masers, one associated with the infrared source located to the south of the 6.7-GHz maser, and another associated with an extended Hii region located in the eastern part of Fig. 1. It is worth noting that the class I masers at C are seen projected onto the edge of this Hii region and may be associated with the ionization shock and, therefore, unrelated to the YSO traced by the 6.7-GHz maser. Although the strongest 44-GHz emission feature of B was fitted within the noise (by the sum of Gaussian components shown in Table 5), the red wing is systematically underestimated at the velocities greater than 3.2 km s-1.
3.1.69 G351.420.65
This is perhaps one of the most famous class II masers, also known as NGC 6334F, with the 6.7-GHz flux density in excess of 3000 Jy and a number of rare class II masers detected (Ellingsen et al., 1996; Caswell, 1997; Cragg et al., 2001; Cragg et al., 2004, see, e.g.,). It belongs to the southern source (labelled I) of the twin cores I/I(N) in the NGC 6334 complex (McCutcheon et al., 2000, see, e.g.,). The northern core I(N), which is renowned for the class I maser emission, is almost 2 arcmin offset from this site. Described in detail elsewhere (Kogan & Slysh, 1998; Brogan et al., 2009, see, e.g.,), the northern core has not been studied in our survey. The MMB project presented the 6.7-GHz masers in this source as two distinct sites, 351.4170.645 and 351.4170.646, only a few arcseconds apart (Caswell, 2009; Caswell et al., 2010, Fig. 1;). The south-eastern maser (351.4170.645), which is the stronger of the two, is seen projected onto a cometary Hii region associated with the dominant infrared source on the Spitzer overlay (Fig. 1). It also has associated OH masers in the ground state (Caswell, 1998) and excited state (Caswell et al., 2011b). The water maser reported by Breen et al. (2010a) is located closer to the north-western 6.7-GHz maser (351.4170.646) and shows a large velocity spread of components exceeding 100 km s-1. The class I masers at A and the broad-line 36-GHz emission at E, which likely corresponds to a partially resolved quasi-thermal source, are located in the vicinity of the strongest infrared source. Due to their spatial position, it seems unlikely that the masers at A are caused directly by expansion of the Hii region, however the emission at E may have such an origin (although shocks related to the outflow traced by the water maser seem more likely). The class I masers at C are located near a weaker infrared source about 20 arcsec north-east from the 6.7-GHz masers. There is also faint extended 4.5-m emission in the area (Cyganowski et al., 2008, note, this source is outside the region inspected for EGOs by). The two strongest class I maser sites, B and D, are located outside the half-power point of the 36-GHz primary beam and, therefore, potentially have a high flux density uncertainty. Note, the sum of the Gaussian components listed in Table 5 for the site B at 36 GHz systematically underestimates both peaks at the level of 23. The contours in Fig. 1 represent the 3-cm continuum measurement of Ellingsen et al. (1996).
It is worth noting that this source was observed at 44 GHz with the Very Large Array (VLA) by Gómez et al. (2010) about 1.5 years prior to our observations. Although their data were not analysed to the same level of detail (in particular, no spectra were published), the comparison of their map with the map shown in Fig. 1 reveals that the 44-GHz masers at A and C are found in both datasets. The strongest masers at B and D were not registered by Gómez et al. (2010), perhaps due to large offsets from the pointing centre. Instead, Gómez et al. (2010) reported three additional 44-GHz maser sites, the two most nothern locations as well as the most southern site in their Fig. 1. The latter seems to be present in our data as a 0.8-Jy maser (Gómez et al., 2010, which is in agreement with the results of), but it did not qualify as a detection due to confusion with dynamic range artefacts. However, there is no indication of any kind in our data that the 44-GHz emission could be present at the location of the two most northern maser sites of Gómez et al. (2010). The peak radial velocities and velocity ranges reported by Gómez et al. (2010) for these masers suggests that they might be artefacts caused by the 80-Jy maser at B, which is located just outside the field presented by Gómez et al. (2010).
3.1.70 G351.631.26
This region has not been studied well and, in particular, there are neither Spitzer IRAC data, nor MAGMO 18-cm measurement available for this source. This region does not seem to be searched for the H2O maser emission. The MMB survey detected no 6.7-GHz maser (Caswell et al., 2010), and likewise no mainline OH maser was found (Caswell & Robinson, 1974). Therefore, the class I methanol maser at 44 GHz reported by Slysh et al. (1994) was the first maser species found in this source. The contours shown in Fig. 1 correspond to the 3-cm data of Walsh et al. (1998). Reanalysing the data of Walsh et al. (1998) extracted from the ATCA archive we noticed deficiencies in the adopted calibration procedure which are inconsistent with the current best practices of ATCA observing. Therefore, the fine-scale structure of the continuum shown in Fig. 1 is not to be trusted, although the absolute position seems to be accurate to within a few arcsec. The Hii region has also been observed by Caswell (1972) with arcmin resolution (labelled 351.61.3). These observations suggest that the Hii region is quite extended and most likely very evolved. There are two sites of class I maser emission separated by just over 15 arcsec, both of which seem to be well separated from the Hii region. Without a more accurate continuum measurement showing the diffuse component it is hard to argue whether the shocks associated with the expansion of the Hii region are directly responsible for the masers. However, with the caution about limited information available on the source, it is likely to represent a very evolved stage of high-mass star formation where the OH and the 6.7-GHz methanol masers have already disappeared. Note, there is a hint at position shift across the blue wing of the 44-GHz profile of B (at 2 level) suggesting that an additional component is likely to be present.
3.1.71 G351.770.54
Also known as IRAS 172333606, this is a well studied region of high-mass star formation, which harbours multiple distinct outflow systems (e.g., Zapata et al., 2008; Leurini et al., 2009; Leurini et al., 2013b, and references therein). The infrared map reveals a tight cluster of sources along with three remarkable 4.5-m features: an EGO, a faint jet in the south-east to north-west direction, and a bow-shock about 10 arcsec north of the EGO (Leurini et al., 2009, Fig. 1; see also Fig. 3 of). Note, this region is outside the area of the Galactic plane inspected for EGOs by Cyganowski et al. (2008). The thinner eastern part of the 4.5-m bow-shock feature and the thicker western part, which has not been detected in the 2.12-m molecular hydrogen emission, trace working surfaces of two different outflows (Leurini et al., 2009, labelled OF2 and OF3 by) propagating approximately in the north-south direction. The other outflow investigated by Leurini et al. (2009) and labelled OF1 is propagating in the similar direction to that of the 4.5-m jet, but lies about 10 arcsec to the south. However, inspection of the 2.12-m H2 image of Leurini et al. (2009) suggests that these are most likely two independent outflows. The radio continuum image at low frequencies is dominated by a well known Hii region (Fig. 1) of large angular size (10 arcsec) which is associated with one of the infrared sources (Zapata et al., 2008, labelled IRAC 9 by). Note, Zapata et al. (2008) presented much more sensitive continuum data with a higher spatial resolution than that attained in both the MAGMO data shown in Fig. 1 and the observations of Walsh et al. (1998). This fact allowed them to detect additional more compact continuum sources in the field, an Hii region associated with the infrared source near the southern boundary of Fig. 1 (Zapata et al., 2008, labelled IRAC 3 by) and a number of weaker sources near the southern rim of the EGO, including the source previously reported by Hughes & MacLeod (1993). When considering the angular sizes and separations, it is important to emphasize that the site is likely to be very near, with a distnace of 1 kpc adopted by Zapata et al. (2008).
This region also has remarkable maser properties revealed by high angular resolution observations, particularly that of hydroxyl (Argon et al., 2000; Fish et al., 2005) and water masers (Forster, 1990; Zapata et al., 2008). The former are found to trace the OF2 outflow with a clear separation between the blue-shifted and red-shifted components (Fish et al., 2005; Leurini et al., 2009), while the latter form a ring centred approximately 4 arcsec to the west of the presumed location of the outflow source (Zapata et al., 2008), which seems to be related to the OF1 outflow (Leurini et al., 2009). Located somewhat in the middle is the 6.7-GHz methanol maser (Caswell, 2009; Caswell et al., 2010, it is quite strong, 200 Jy;). Note, although the separations between positions of various maser species is the same magnitude as the typical uncertainty of the absolute position measurement, it is most likely real (especially the separation between the OH and H2O masers, which is well above 5). On the larger scale, all these masers are located near the southern edge of the EGO, in the same area where the weak continuum sources mentioned above are located (Zapata et al., 2008; Caswell et al., 2010, Fig. 1;).
The class I methanol masers are spread across a large area up to the half-power point of the primary beam (Fig. 1). The remarkable feature of this distribution is an approximately 10 arcsec-long elliptical arc (only a couple of arcsec along the minor axis) formed by class I masers at B and D near the southern and western edges of the EGO. The masers at B are tightly clustered around the position of the 6.7-GHz maser and have a large spread of radial velocities (about 10 km s-1; Fig. 1) which seem to correspond to the blue-shifted OH emission. Even taking the uncertainty of the absolute position into account, these class I masers tend to be located towards the western part of the OH outflow (but near the central region) and the eastern part of the H2O maser ring. They can be associated with any of the three outflows (OF1OF3), but given the velocity trend, at least some of these class I masers seem to be related to the OF2 outflow. Note, the 36-GHz spectrum of B has an abrupt dip of the flux density near 6.76 km s-1, which is not represented well by the sum of the fitted Gaussians listed in Table 5. A similar drop of flux density, which has also left a systematic residual, is present in the 44-GHz spectrum of D near 2.88 km s-1. The fit underestimates the flux density around this velocity by about 0.8 Jy (or 6). The class I masers at D form the bulk of the structure discernible as an elliptical arc. There is a clear velocity gradient along the structure (4.3 km s-1 over 7 arcsec), with more negative velocities being in the northern part. The northern end of the structure is just a few arcsec south of the 4.5-m jet (Fig. 1). The arc extends well outside the maser zone populated with the OH and H2O masers (Zapata et al., 2008, compare Fig. 1 with Fig. 3 of). The curvature would suggest an association with the OF1 outflow (the arc runs across the flow direction), although association with the OF3 outflow (the arc is along the flow direction) cannot be excluded. The class I masers at A are located at the northern side of the EGO (Fig. 1) and seem to be associated with the OF1 outflow. It is worth noting that Leurini et al. (2009) detected a knot of 2.12-m H2 emission in the vicinity of A which suggests the presence of shocked gas. The profile decomposition into Gaussian components left systematic residual at the level of 23 around 8.0 km s-1, the local minimum in the spectrum at the blue side of the peak. The other class I masers are well offset from the EGO (C, E and H are at the east and north-east, and G and F are in the south-west), not in a general direction of any of the considered outflows (Fig. 1).
4 Discussion
The Gaussian components presented in Table 5 are not directly suitable for detailed comparison of 36- and 44-GHz masers. The complexity of the spectra means that the number of Gaussians used in the fit may vary from one transition to another. To circumvent this, we grouped the Gaussian components co-located in both position and velocity within 3. For each group we calculated the peak velocity, the peak flux density and the effective full width at half maximum of the appropriate sum of Gaussians and propagated individual uncertainties of the fit to these cumulative figures. These group figures were used in the statistical analysis presented in this section. It is worth noting that more than 85 per cent of the groups appeared to be simple and contained just one Gaussian component. For these simple groups the parameters used for statistical analysis (e.g. peak flux density) and their uncertainties are equivalent to that of a single Gaussian component. In total, across all 71 targets, we extracted 817 groups at 44 GHz and 740 groups at 36 GHz, with only 292 (or about 23 per cent of the total number) groups having emission in both transitions. The matching criterion between two frequencies included the systematic shift, which is discussed in the following section, as well as the alignment of both position and velocity (with the shift) to within 3.
4.1 Rest frequency uncertainty

The velocity alignment of spectra corresponding to the two different transitions requires accurate rest frequencies. In contrast to the 44-GHz transition, the laboratory measurement of the rest frequency for the 36-GHz transition has a large uncertainty equivalent to 0.24 km s-1 (Müller, Menten & Mäder, Müller et al.2004), which exceeds the spectral resolution of this experiment. Indeed, there appears to be a clear systematic red shift of the 36-GHz Gaussian components with respect to the associated 44-GHz components in Table 5 and Fig. 1. We have previously used high spectral resolution maser data to refine the rest frequencies of other methanol transitions (Voronkov et al., 2006; Voronkov et al., 2011). However, identification of the same physical component at 36 and 44 GHz is a more difficult task due to the complexity of the spectral profiles and the lack of clear one to one correspondence between the fitted Gaussian components. We adopted an iterative approach progressively refining the systematic offset between the radial velocities corresponding to two different molecular transitions used in the match criterion. During each iteration we compared the velocity distributions at 36 and 44 GHz and updated the systematic offset to bring them into line. As a starting point we used the average velocity offset calculated over all single component groups matching in position (within 3) regardless of their velocity. Such iterations quickly converged, with the final velocity difference distribution being shown in Fig. 2. Only those component groups which had sufficiently accurate peak velocities (an uncertainty below 0.035 km s-1 which is approximately half the spectral resolution) were considered for this analysis. In particular, this cutoff excluded broad spectral features which might have some contribution from partially resolved thermal emission and, therefore, would be very sensitive to the actual -coverage which was different at 36 and 44 GHz. In total, 204 component groups contributed to the histogram shown in Fig. 2. For comparison, we also show the histogram made using a subset containing 163 simple groups with just one Gaussian component for each molecular transition. The results were similar in both cases corroborating the approach to deal with complex spectral profiles represented by a number of Gaussian components. Therefore, we used the full sample of 204 groups to refine the rest frequency. The weighted (by the reciprocal of the square of uncertainties) mean velocity difference between 36- and 44-GHz masers was found to be 0.220.03 km s-1, equivalent to 26.53.6 kHz for the 36-GHz transition. Taking into account the rest frequency uncertainty for the 44-GHz transition (it is used as a reference), this weighted mean corresponds to a refined rest frequency value of 36169.2380.011 MHz. The new value agrees with the laboratory measurement from the catalogue of Müller, Menten & Mäder (Müller et al.2004) within their 1 uncertainty. It is worth noting that velocity alignment of different methanol transitions observed with high spectral resolution has previously been used to constrain variations of fundamental constants (for details see Levshakov et al., 2011; Ellingsen et al., 2011, and references therein). However, the lack of clear one to one correspondence between individual components and general complexity of the spatial distribution suggests that the 36- and 44-GHz transitions are not very well suited for this purpose.
4.2 Separation from YSOs
As mentioned earlier, all but nine of our targets have at least one class II methanol maser at 6.7-GHz within 1 arcmin according to the MMB survey (see Table 3). The 1 arcmin cutoff used throughout this study was based on the distribution of the measured angular offsets between the class I maser emission and the 6.7-GHz masers computed using a sample of sufficiently simple sources which have just one 6.7-GHz maser within a wider area of 2 arcmin in size (which exceeds the field of view of this experiment). We do not show this distribution here as its shape is qualitiatively similar to the shape of the linear offset distribution discussed below. The numbers fall off quickly as the angular distance increases. Over 70 per cent of the class I maser emission components appear to be within 30 arcsec of the 6.7-GHz maser position (note, the fraction is even larger if the associations are limited to 1 arcmin). There is a secondary maximum around 15 which is entirely attributed to false associations from the analysis of individual sources contributing to this part of the distribution. The 1 arcmin cutoff separates these two populations and is conservative enough to keep all components which may be associated with the corresponding 6.7-GHz maser. At 3.5 kpc, which is roughly the distance where the majority of known class I methanol masers are located (the median is 3.2 kpc for our target sample), this cutoff corresponds to the spread of 1 pc usually quoted for the class I methanol masers (Kurtz et al., 2004, e.g.,). It is worth noting that the distribution does not change qualitatively if a minimum flux density selection is imposed on class I maser components. In addition, we rarely pointed directly at the 6.7-GHz maser positions. Therefore, the limited field of view of our experiment and the sensitivity tapering away from the pointing centre seem unlikely to cause any significant selection effect.

Pumped by infrared radition, the class II methanol masers at 6.7-GHz reside in the immediate vicinity of high-mass YSOs, so their positions can be regarded as the exact YSO location at the spatial resolution of ATCA experiments. In contrast, the 36- and 44-GHz masers belong to class I and are pumped by collisions with molecular hydrogen. They trace shocks, perhaps caused by a range of phenomena. Therefore, the projected linear separation between these maser classes is indicative of how far the shocks have propagated into the parent molecular cloud and, ultimately, is a measure of the region of influence for such high-mass YSOs. The resulting distribution over projected linear separations is shown in the top panel of Fig. 3. The histogram was obtained using all groups of Gaussian components representing class I maser emission which had a 6.7-GHz maser within 1 arcmin. If more than one such 6.7-GHz masers existed (15 targets in our list have two 6.7-GHz masers within 1 arcmin and two targets, G335.590.29 and G333.130.44, have three and four 6.7-GHz masers, respectively), the nearest maser was deemed to be the association for this particular group. It is worth noting that constraining the analysis to targets with just one 6.7-GHz maser in the vicinity yielded qualitatively the same distributon. The distances to the associated 6.7-GHz maser were used to convert the angular offsets into linear separations. We assumed the same distances as in a number of recent studies based on the MMB sample of the 6.7-GHz masers (Ellingsen et al., 2013, e.g.,), i.e. mainly near kinematic distances unless a better estimate was available for a particular source (see Green & McClure-Griffiths (2011) for the ambiguity resolution details and the published list of distances).
The distribution is consistent with an exponential decay in the numbers of the class I maser sites which is best illustrated by the bottom panel of Fig. 3 where the fraction of the total number of the maser component groups in each transition is shown in the logarithmic scale. The error bars correspond to the number of component groups in each bin of the histogram. Interestingly, the distribution is the same for the 36- and 44-GHz masers within the uncertainties imposed by the current size of the sample (note, the normalisation excluded component groups corresponding to the offsets over 1 pc, which are largely considered to be false associations). The best linear fit to the combined data on both transitions corresponds to the decay scale of 26315 mpc (the solid line in Fig. 3). The second bin of the histogram manifests a single significant (more than 3) deviation from the exponential decay trend for the 36-GHz masers (the 44-GHz masers show the same tendency, but the numbers are formally within 3). This implies a slight excess of the numbers of class I masers in the immediate vicinity of the 6.7-GHz masers but not exactly at their location. Zooming into this distribution at finer resolution in linear separations (the numbers allow a meaningful study at small offsets) suggests the excess of class I masers takes place at 0.030.1 pc. Perhaps, there is a second population responsible for this excess, for example masers associated with outflows aligned roughly with the line of sight. Although we cannot completely exclude the possibility of bias caused by the preference towards the near kinematic distance during the ambiguity resolution (distant sources are expected to have smaller angular extent and would cause a bias if assigned to the near kinematic distance), it seems unlikely due to the number of sources included and the steep fall off of the distribution. It is worth noting that Kurtz et al. (2004) studied the distribution of the projected linear offsets between the 44-GHz methanol masers and geometric centres of compact Hii regions. Despite smaller statistics, their distribution (Kurtz et al., 2004, see Fig. 29 in) shows similar characteristics to the distribution found in our study, including the presence of a peak at small but non-zero offset.
The distribution in Fig. 3 is obtained in terms of projected linear separations and, therefore, corresponds to the actual spatial distribution integrated along the cylindrical annuli. In order to achieve typical observed brightnesses, the modelling of class I methanol masers usually assumes methanol column densities of about 31016 cm-2, hydrogen number densities of cm-3 and an abundance of methanol as high as 10-5 relative to hydrogen due to the effects of weak shocks (Cragg et al., 1992; Voronkov et al., 2006, e.g.,). This range of parameters implies the size of the maser clump (or a region with effective velocity coherence) of the order of a milliparsec. Therefore, when dealing with large-scale projected offsets of the order of 1 pc, it seems more appropriate to consider a three-dimensional distribution of individual masers rather than a two-dimensional distribution in the plane of the sky where each maser site corresponds to the combined effect of the whole column of gas. Note, in the unlikely case that the latter is realised, the histogram shown in Fig. 3 would be a direct measurement of this two-dimensional distribution. Otherwise, one has to convert the measured projected distribution into a three-dimensional one implying some symmetry considerations to regularise the problem. Assuming a spherically symmetrical distribution of methanol masers with a spatial density of up to a radius of (i.e. ), one can compute the distribution with respect to the projected separation as
| (1) |
To analyse Fig. 3, we consider three special cases with analytical solutions: case one, a uniform distribution on a thin shell of radius ; case two, a uniform spatial distribution (); and case three, an inverse square law (). Note, normalisation can only be achieved in the third case by assuming a cutoff at some minimal radius. Substituting , where is the Dirac delta function, into (1), it follows immediately that case one implies rising at , contrary to the observed distribution (see Fig. 3, this case is represented by the dotted curve). The statistics represented by Fig. 3 are built across all sources in our sample. Therefore, we would like to emphasize that the simplistic considerations of the thin shell in case one imply a standard radius of the shell for all sources, which is unlikely to be the case. Incorporating some distribution across a range of shell radii into equation (1) would mimic to some extent the other two cases considered below. In addition, one could speculate that detectability of the maser depends on its position in the shell due to different orientations with respect to the observer. However, we will not consider these options in the current study keeping the number of degrees of freedom to a minimum. It is worth noting that we did not find any systematic trend in the maser flux density with offset from the associated 6.7-GHz maser (and also no relationship between the luminosity of the class I maser and the linear separation from the 6.7-GHz maser).
For the case two of a uniform spatial distribution, (1) transforms to
| (2) |
Its logarithm is shown by the blue dashed curve in the lower panel of Fig. 3 for pc. Although it matches the fitted slope at distances below 0.2 pc, flattens significantly at larger projected linear separations. The inverse square law, case three, results in
| (3) |
where is an arbitrary normalisation constant which is a function of the inner cutoff radius. The logarithm of (3) is shown in the bottom panel of Fig. 3 by the red dash-dotted curve (for pc). The resulting slope matches well the observed slope at the projected offsets beyond 0.3 pc. However, this model is unable to explain the exponential decay across the whole range of offsets. Most likely a combination of cases two and three is realised with the spatial distribution being close to uniform up to 0.20.3 pc offsets from the YSO with an inverse square law fall off afterwards. This might reflect the large-scale distribution of molecular gas around the driving YSO. In its immediate vicinity, we expect excess residual material of the parent molecular cloud from which the YSO formed. On the other hand, the gas might be too dense for the shock to propagate far beyond a certain distance without disocciating methanol or there could be a smaller chance to hit a sufficiently dense clump.
4.3 Velocity distribution

Previous studies have suggested that class I methanol masers have radial velocities close (within a few km s-1) to that of the quiescent gas (Voronkov et al., 2006; Voronkov et al., 2010b, e.g.). This is consistent with the expectation that only a small fraction of molecular gas is accelerated to shock velocities while most of the gas is only mildly disturbed (Garay et al., 2002a, e.g.). A proxy for the quiescent gas velocity is the middle of the velocity range of the 6.7-GHz methanol maser. It is often used for estimates of kinematic distance and has proven to be much better than the velocities of individual maser peaks (e.g. Ellingsen et al., 2013, and the MMB project). Our data allow detailed comparison of the class I and class II maser velocities. Using the same identification criterion between individual groups of Gaussian components describing class I maser emission and the 6.7-GHz maser as in the previous section, we have constructed a histogram of the relative velocities (Fig. 4). Apart from a small number of blue-shifted high-velocity components (with offsets below 15 km s-1), the distribution is well approximated by a Gaussian with the same mean of 0.57 km s-1 for both 36- and 44-GHz masers (uncertainties are 0.06 and 0.07 km s-1, respectively), and the standard deviations are 3.650.05 km s-1 and 3.320.07 km s-1, respectively. Note, the mean for the distribution of the 36-GHz masers and its uncertainty have been corrected for the systematic shift due to the rest frequency uncertainty (see section 4.1). The agreement between the means of the 36- and 44-GHz velocity distributions is an independent check of the rest frequency correction without a need to make any assumptions about the individual associations of the 36- and 44-GHz features, and has the advantage of a five times larger sample. Both histograms for the 36- and 44-GHz masers peak around zero (and are symmetric) confirming that the middle of the 6.7-GHz maser velocity interval is a good estimate for the quiescent molecular gas velocity. However, there is a small but statistically significant blue-shift asymmetry. Perhaps, the chance of detecting a class I methanol maser on the observer’s side of the cloud (associated with the approaching portion of the outflow, and therefore blue-shifted) is higher. Assuming that high-mass star formation typically occurs towards the edges of molecular clouds or filaments, it is reasonable to expect that a shock would encounter different density gradients depending on the direction of propagation causing systematic differences in appearance (e.g. the strength or the number of maser spots distinguishable at a given resolution).
4.4 High-velocity features
The velocity histogram shown in Fig. 4 suggests the presence of a small number of high-velocity components, which are largely blue-shifted and detected more easily at 36 GHz. The largest velocity offsets (over 30 km s-1) correspond to G309.380.13, a source described in detail by Voronkov et al. (2010a) based on the preliminary 36- and 44-GHz data. In this paper we present an independent dataset obtained with a different receiver tuning, which allowed us to register the 36-GHz high-velocity feature better and also to detect it at 44 GHz (see section 3.1). In addition, the new data revealed a marginal 44-GHz component corresponding to the location I (see the map of G309.380.13 in Fig. 1), which is several arcsec offset from the location of other blue-shifted emission (Voronkov et al., 2010a, labelled E following the notation introduced by), but has a similar radial velocity. This lateral offset suggests that the two locations are probably related to the opposite sidewalls of the same outflow cavity. With a velocity offset of about 38 km s-1 with respect to the middle of the 6.7-GHz maser velocity range, this marginal component corresponds to the most extreme non-zero bin of the histogram (Fig. 4).
Including G309.380.13, there are seven sources in our sample which contain emission at either 36 or 44 GHz beyond 15 km s-1 (just over 4 of the velocity distribution shown in Fig. 4) from the middle of the 6.7-GHz maser velocity range. Only two of them, G270.260.84 and G329.070.31, show red-shifted emission (by just over 15 km s-1) and the rest have blue-shifted emission. Among the sources with blue-shifted high-velocity components, three sources, G326.640.61, G329.180.31 and G333.230.06, have a marginal detection only. The blue-shifted emission in the remaining source, G338.920.55, is just over 15 km s-1 from the estimated systemic velocity, but along with the other maser emission in the immediate vicinity (see location F in G338.920.55) spans a wide velocity range of about 20 km s-1. This is also the only source in addition to G309.380.13 where the high-velocity emission was detected in both transitions (and in this particular source the high-velocity emission is stronger at 44 GHz). With the exception of G329.180.31 and the new marginal component in G309.380.13 (location I), which were detected at 44 GHz only, and two sources with high-velocity emission detected in both transitions, all other sources were detected only at 36 GHz. With the caution about low number statistics, there seems to be a tendency for high-velocity components to be stronger (and more easily detectable) at 36 GHz. This might be related to this transition being inverted in a broader range of conditions (Yusef-Zadeh et al., 2013, also suggested by its widespread distribution in the Galactic Centre, see). Note, in the case of G326.640.61, the source of the high-velocity emission is located at a significant spatial offset from the pointing centre, and therefore corresponds to a larger primary beam attenuation factor at 44 GHz. It is also worth noting that the widest velocity spread (over 50 km s-1) was found in the 36-GHz maser in G341.190.23. There is no 6.7-GHz maser in this source and therefore it did not contribute to the histogram in Fig. 4. This source has a very compact arc-shaped distribution of the maser emission suggesting association with a sidewall of an outflow cavity. A similar arc-shaped morphology was found at the location of the high-velocity features in G329.070.31 and G338.920.55.
As discussed by Voronkov et al. (2010a), the detection of high-velocity features was somewhat unexpected for methanol masers (Bachiller et al., 1990; Kalenskii et al., 2010, see also). Although shocks are considered essential to achieve high methanol abundance in the gas phase as the efficiency of pure gas phase reactions is quite low (Hartquist et al., 1995, e.g.,), methanol is expected to survive sputtering and desorption of grain mantles only if such shocks are relatively mild (Garay et al., 2002a, i.e. shock velocities not greatly exceeding 10 km s-1;). Therefore, the velocity offsets in excess of 30 km s-1 led Voronkov et al. (2010a) to suggest that interaction with a moving parcel of gas must have been taking place. The exact mechanism causing this prior acceleration is still unknown. However, the presence of emission at a wide range of velocities at nearby spatial locations (e.g. see G341.190.23 in Fig. 1) and the morphology of G309.380.13 (the new marginal high-velocity feature at I, which is spatially offset from the high-velocity feature at E) suggest that this velocity gradient could arise in a cascade of wakes accompanying a complex shock interface between an outflow and entrained ambient material.
It is worth noting that G309.380.13 is the only source where the high-velocity feature was found at a nearby location to the 6.7-GHz methanol maser (a few seconds of arc offset). For all other sources with a 6.7-GHz maser, the angular offset is typically in the range of 1020 arcsec with the exception of G326.640.61 where this offset is about 1 arcmin (and so the high-velocity feature may actually be unrelated to the YSO traced by the 6.7-GHz maser in this source). These sources have smaller relative velocities of the high-velocity features than in G309.380.13 and may either contain more inclined outflows or outflows unrelated to the YSO traced by the 6.7-GHz maser.
4.5 Evolutionary stages
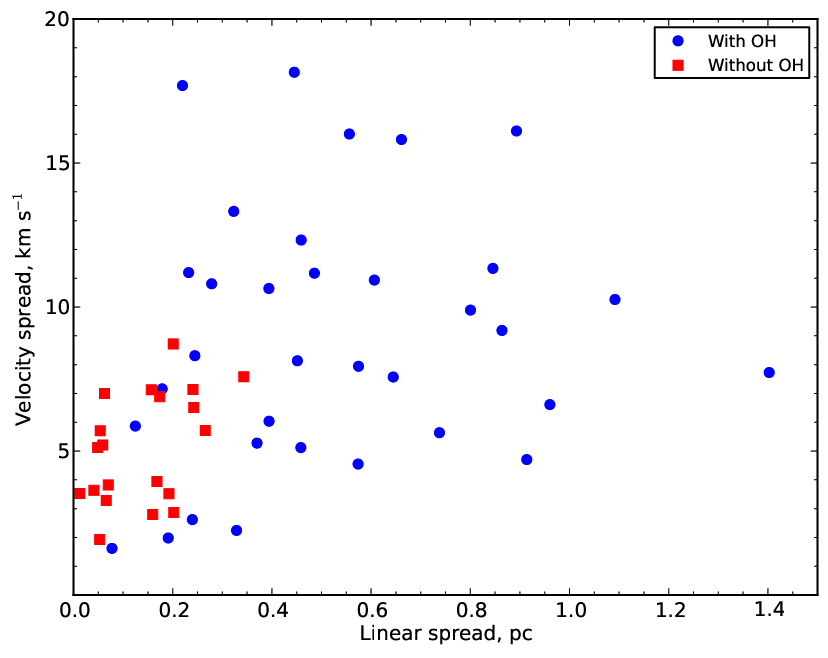
The question whether different maser species trace distinct evolutionary stages has recently gained much attention (see, e.g., Breen et al., 2010b, and references therein). However, the place of class I masers in this picture is poorly understood. Initially, these masers were thought to appear prior to the onset of the 6.7-GHz (and other class II) masers (Ellingsen et al., 2007). This conclusion was based on the analysis of the infrared colours of GLIMPSE point sources associated with the 6.7-GHz masers (Ellingsen, 2006), where sources with the class I methanol masers appeared to have redder colours, and the expectation that the outflows, which were thought to be largely responsible for the class I maser emission, occurred at the earliest stages of evolution. Focusing on other maser species, Breen et al. (2010b) further refined the evolutionary timeline for them, but, in the absence of new observational data, inherited the same conclusions regarding the class I methanol masers.
The controversy emerged from detailed studies of selected sources (Voronkov et al., 2006; Voronkov et al., 2010b, e.g.,) and notable overlap between the class I methanol and OH masers (Voronkov et al., 2012, e.g.,), which are usually considered a signature of somewhat evolved stages (Forster & Caswell, 1989, e.g.,). Voronkov et al. (2010b) also suggested that the class I masers may be caused by other phenomena, which are not limited to the outflow scenario, e.g. by expanding Hii regions (this conclusion is further reinforced by the present study). This finding undermines another implicit assumption of the maser-based evolutionary sequence that each maser species occur only once during the course of evolution. Therefore, there could be both populations of young and evolved sources which have class I masers.
High angular resolution data allow us to study the spatial spread of class I maser emission, which could be another metric indicative of the evolutionary stage. The YSOs are likely to expand their zone of influence with age as shocks have time to propagate further into the parent molecular cloud. Therefore, one might expect a larger spatial spread of the class I maser emission for more evolved sources, particularly those where the YSO is associated with an OH maser. The main difficulty arises again from the complex morphology as multiple YSOs and unrelated class I maser emission may be present in the same field. We used the same approach as in sections 4.2 and 4.3 to identify a group of Gaussian components aligned in position and velocity within 3 with a particular 6.7-GHz maser. Then, we estimated the largest linear separation from the 6.7-GHz maser (calculated as in section 4.2) and the velocity spread across all groups attributed to the same 6.7-GHz maser. These linear and velocity spreads are shown in Fig. 5 with different symbols depending on the OH association status of the corresponding 6.7-GHz maser. In total, the sample includes 37 6.7-GHz masers with OH association and 20 without (we did not have OH data available for the remaining sources). We have also explicitly excluded from the analysis four sources with potentially ambigous associations. Three of them, G345.000.22, G328.810.63 and G351.420.65, have very close 6.7-GHz masers, which have different OH association cases. The fourth source, G337.920.46, has an OH maser in the field which is not associated with any 6.7-GHz maser and may represent a separate YSO at a later stage of evolution. The high-velocity features (defined as offset by more than 15 km s-1 from the middle of the velocity range of the associated 6.7-GHz maser) were excluded from the velocity spread calculation. Fig. 5 suggests that when the YSO has an associated hydroxyl maser (Forster & Caswell, 1989, and therefore expected to be more evolved, see), the corresponding class I masers indeed have larger spread of emission both spatially and in the velocity domain. The latter probably reflects the increase of the velocity dispersion in the zone of influence as it expands with age. The difference in spatial spreads of sources with and without associated OH masers also stands out in the distribution of linear separations of individual groups of Gaussian components (i.e. if these two populations of sources are shown separately in Fig. 3). However, the analysis described in this section allows us to avoid potential biases due to different number of maser sites (i.e. different number of groups of components contributing to the distribution) which might be present in these two cases. It is worth noting that we found no relationship between either of these spread figures and the luminosities of either the class II or the class I masers (both the peak and the mean flux densities calculated across all corresponding groups of the Gaussian components were also inspected).
For younger sources, it still remains unclear whether there is a population of class I methanol masers pre-dating the stage with class II maser acitivity (see Voronkov et al. (2010b) and Chen et al. (2011) for detailed discussion of these issues). A positive identification of class I maser emission with a dark cloud, especially if it is devoid of other masers, would be a good example that such a population exists. It is worth noting that Bayandina et al. (2012) investigated association of the whole population of class I methanol masers with dark clouds using published low spatial resolution data. Despite the high association rate (over 70%) reported by Bayandina et al. (2012), this result only means that such an association cannot be excluded, a stronger conclusion is precluded by the complexity of high-mass star forming regions and a weak association tolerance of 2 arcmin in their study. Our data provide the means to search for associations at the arcsec scale. In total, among 64 sources in our sample where comparison data exist, we found some class I emission to be associated with a dark cloud identified by Peretto & Fuller (2009) in 19 sources (30 per cent).
4.6 Class I masers without nearby 6.7-GHz masers
The current knowledge of sources which have class I maser emission but no 6.7-GHz (or other class II) masers is quite limited due to selection biases in most surveys conducted to date. These surveys (Slysh et al., 1994, e.g.,) largely targeted known 6.7-GHz masers directly or regions of high-mass star formation selected by other means (e.g. by presence of other maser species), where the 6.7-GHz masers are also often found. More recent searches with different selection criteria (Chen et al., 2011; Voronkov et al., 2012; Gan et al., 2013, e.g.,) and, especially, an untargeted survey described by Jordan et al. (2013) have significantly increased the number of sources where class I maser emission is known to be present in the absence of class II masers. The sources without 6.7-GHz masers are likely to correspond to both extremes of the evolutionary stage spectrum (i.e. both the sources too young and too old to have a 6.7-GHz maser), and, therefore, are particularly important for understanding what evolutionary stages the class I methanol masers can correspond to.
The sample of sources investigated in this work includes nine targets which do not have a 6.7-GHz maser within 1 arcmin (see Table 3). Three such sources, G305.370.21, G343.120.06 and G348.180.48, show signatures of an evolved stage of star formation (see section 3.1). In the case of G348.180.48 there is also evidence of triggered star formation. Therefore, it is hard to attribute this source to a particular evolutionary stage as some of the class I maser emission may correspond to a new generation of stars. Having an OH maser (Caswell, 1998) and quite large spread class I maser emission, G316.760.01 most likely also belongs to the same category of evolved sources, although it is not entirely clear. Associated with a quite extended Hii region, G351.631.26 is probably the most evolved source in our sample which already lacks not only the 6.7-GHz methanol maser, but also the OH maser (see section 3.1).
Among the remaining sources, at least three, G326.660.57, G328.210.59 and G341.190.23, clearly fit the profile of young sources: they all have class I masers embedded in a dark cloud and no other maser species detected (see section 3.1). Note, the latter source is also remarkable for its high velocity spread of 36-GHz maser emission and a very compact spatial distribution (see section 3.1). The class I masers in G333.590.21 are located near the edge of a dark cloud (see section 3.1) and probably also correspond to a very early stage of star formation. However, the morphology of this source resembles that of W33-Met (Voronkov et al., 2010b, G12.800.19; see discussion in) and shows indications for triggered star-formation. Therefore, the case for this source is not as clear cut as the other three examples given above. An additional complication arises because, unlike the class II methanol masers, the class I masers are not exclusively associated with high-mass star formation and may be related to low- and intermediate-mass YSOs (Kalenskii et al., 2010; Kalenskii et al., 2013; Gan et al., 2013). In particular, G326.660.57 has quite weak masers and may be the site of low- or intermediate-mass star formation. However, both 36- and 44-GHz masers in G341.190.23 are quite strong (peaking at about 100 Jy; see Fig. 1 and Table 5), well in excess of the typical flux densities observed in low- and intermediate-mass star forming regions (Kalenskii et al., 2010; Kalenskii et al., 2013). Therefore, neither of these issues seem to undermine the general conclusion that there is a population of the class I methanol masers pre-dating the onset of the class II masers at 6.7 GHz.
4.7 Relative flux densities of 36- and 44-GHz methanol masers

It is clear from the analysis of individual sources (see, e.g., G333.470.16 in Fig. 1 and section 3.1) that the two studied transitions can be quite complementary, filling the gaps in morphology when tracing common structures. In support of this idea, the basic analysis of individual Gaussian components (listed in Table 5) concluded that only 23 per cent of the total number of component groups (collection of components matching in position and velocity within 3) have emission simultaneously in both transitions (see the beginning of section 4). In this section we investigate the properties of the component groups detected at both 36 and 44 GHz.
In the majority of cases, the emission at 44 GHz was found to be stronger than the matching 36-GHz emission. Out of 292 component groups, only 40 appeared to be stronger at 36-GHz. However, inspection of individual spectra suggests that in virtually all cases correct cross-matching between the 36- and 44-GHz emission components may be questioned due to the complexity of spectral profiles which cannot be resolved with the current data. Noteworthy exceptions are the strong (200 Jy) 36-GHz emission at location B in G335.590.29 and the 15 km s-1 spike at location A in G345.011.79 (see Fig. 1). The distribution of the 44- to 36-GHz flux density ratio has a long tail at , which cannot be simply attributed to incorrect cross-identification of components in the complex spectral profiles (see Fig. 6). In several cases contributing to the tail, the spectra contain quite broad 36-GHz emission spanning the velocity range of the 44-GHz profile with maser spikes (see, e.g., the spectrum of B in G270.260.84 shown in Fig. 1). Such broad 36-GHz profiles may be related entirely to the quasi-thermal emission or could contain a significant quasi-thermal contribution. About 62 per cent of the sample (180 out of 292 component groups) have . This fraction rises to about 94 per cent (274 out of 292 component groups) for (the median of this flux density ratio is 3.21). It is worth noting that for the reciprocal 36- to 44-GHz flux density ratio, about 78 per cent of the sample (230 out of 292 component groups) have (the median of this ratio is 0.31).
We found no reliable relationship between the flux densities of the two transitions. The sources without a 6.7-GHz methanol maser within 1 arcmin of any class I maser emission (see section 4.6) do not stand out in any way from the general population in terms of the individual flux densities or their ratios. We also did not find any dependence between the flux density of the associated 6.7-GHz maser and the flux densities at either 36 or 44 GHz individually or their ratio.
The maser pumping is a result of a delicate balance between a number of excitation and de-excitation transitions, which has been shown to be significantly affected by any elongated geometry of a maser region (Sobolev & Deguchi, 1994, or, more general, the beaming factor describing directional variations of the optical depth; see, e.g.,). The numerical models of Sobolev et al. (2005) suggest that the maser region elongated along the line of sight is preferred for the 44-GHz masers. Therefore, one might expect that the ratio could be a good probe of the orientation of individual maser regions, which are almost certainly anisotropic to some extent, with respect to the observer. As proposed by Voronkov et al. (2010a), this might be manifested by a dependence in a large statistical ensemble between the ratio and the distance from the associated 6.7-GHz maser. This is because in an idealised case of a single regularly-shaped outflow interacting with the ambient gas of the parent molecular cloud, both the orientation of the interface regions and the projected distance from the associated 6.7-GHz maser tracing the YSO are related to the outflow orientation. However, we did not find any such reliable dependence in our data. Inspection of individual sources like G333.47-0.16, where the class I methanol masers trace a regular arc (see Fig. 1), reveals that the 36- and 44-GHz masers are often intermixed along this structure. This suggests that the orientation of the maser region is more likely to be related to the turbulence (and the wakes of the shock) at small scales, rather than to the large-scale structure of the interface.
4.8 Width distribution
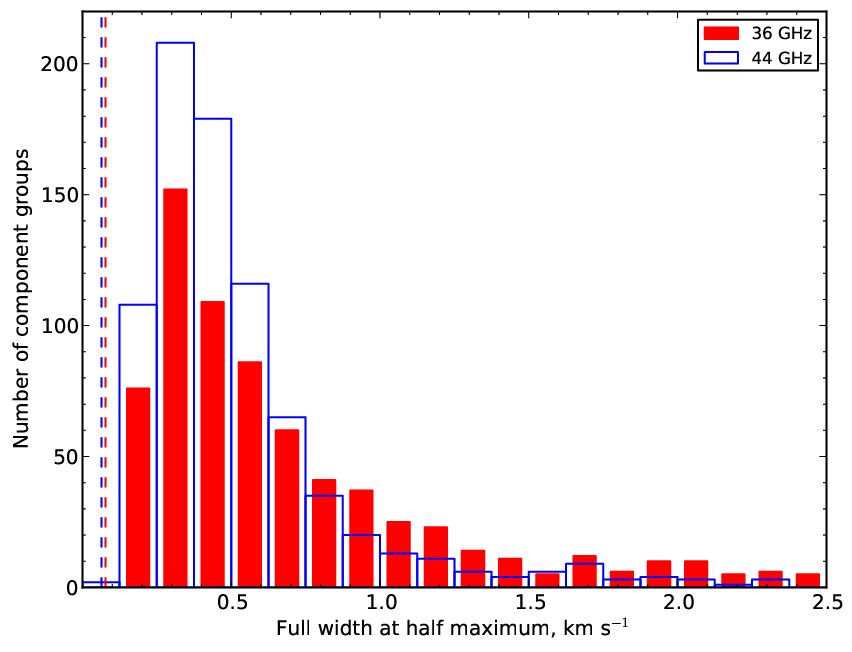
High spectral resolution data allow us to investigate the distribution of line widths. As before, we analysed groups of Gaussian components that match within 3 in position and velocity in order to avoid biases caused by the fitting of individual components. For each group, we estimated the effective (scaled to the Gaussian profile) full width at half maximum using the profile integral (i.e. the area under the spectral line) and the peak as
| (4) |
where is the spectral profile computed via the sum of individual Gaussian components constituting the group. Defined this way, the effective FWHM matches that of a single Gaussian component catalogued in Table 5 for simple groups containing just one Gaussian component. The resulting histogram for 36- and 44-GHz masers is shown in Fig. 7. The individual widths range from 0.15 to 9.3 km s-1 and from 0.12 to 8.0 km s-1, for the 36- and 44-GHz masers, respectively. In all cases, the narrowest components, which are about two spectral channels wide, were found as a result of the decomposition of a complex non-Gaussian profile (see for example 44.887 km s-1 component at C in G341.220.21), rather than as stand alone spectral features. Therefore, the extreme narrowness could be a result of the fit systematics. The large (1.5 km s-1) widths in Fig. 7 mainly correspond to weak wings (see for example location I in G344.230.57), although some contribution from quasi-thermal emission cannot be excluded. The histogram suggests that large FWHM values are more common at 36 than at 44 GHz. This is reflected by the median of 0.53 and 0.43 km s-1 for the 36- and 44-GHz groups, respectively. The underlying physics is most likely the same as that which causes the high-velocity components to appear predominantly at 36 GHz (see section 4.4), i.e. this transition is inverted under a broader range of conditions. For both transitions the distribution peaks at FWHM of 0.3 km s-1 and resembles either a Rayleigh or log-normal distribution. Regardless of the actual shape of the distribution, the fact that the measured width follows a well defined distribution up to at least 1.5 km s-1 suggests that many wide features are indeed masers similar to their narrow counterparts but blended in the spectral domain, and are not quasi-thermal features.
4.9 General associations
High angular resolution observations allow us to probe associations at arcsec scale with other phenomena commonly observed in star forming regions (see also Table 3). As pointed out in the introduction, the direct observational evidence of associations with outflows at arcsec level have only been demonstrated for a few sources (Kurtz et al., 2004; Voronkov et al., 2006; Cyganowski et al., 2012), mainly due to lack of appropriate comparison datasets rather than the maser positions. The maps obtained in the current project reveal regular structures such as arcs and lines in 17 out of 71 sources (24 per cent). Except G305.370.21 where masers trace a circle around Hii region (see below), the remaining 16 cases are likely to be outflow associations with sufficiently favourable geometry which allows this association to be confirmed with future observations of some outflow tracer (Voronkov et al., 2006, e.g. as with the H2 outflow in G343.120.06;).
As mentioned in section 4.5, we found that some class I methanol maser emission is associated with Spitzer dark clouds identified by Peretto & Fuller (2009) in 19 sources out of 64 targets for which comparison data are available (30 per cent). In addition to dark clouds, Spitzer images reveal 4.5-m sources (Cyganowski et al., 2008, some of which qualify as EGOs and could trace shocked gas, see) as well as 8.0-m emission features caused by PAH emission, which includes 8.0-m filaments and PDRs around Hii regions. In 61 targets which fall into the region of the Galactic plane searched for EGOs by Cyganowski et al. (2008), we found close spatial association (within a few arcsec) between EGOs and some class I maser emission in 33 sources (54 per cent). Interestingly, in 24 sources out of these 61 (or 27 out of the full sample of 64 sources with GLIMPSE data available), some class I masers are associated with 4.5-m sources not claimed by Cyganowski et al. (2008) to be EGOs. If both EGOs and these additional 4.5-m sources are considered, the association rate increases to 82 per cent (50 out of 61; note seven targets have both EGOs and additional 4.5-m sources and are only counted once). It is worth noting that Cyganowski et al. (2009) reported a converse detection statistic of 90 per cent (note, the sample size was only 19 sources) in their search for the class I methanol masers towards EGOs. We note that their statistic does not guide us on the question of whether most class I sites are associated with EGOs, but this question can be addressed with our data. Although both this work and that of Cyganowski et al. (2009) suggests that EGOs (or 4.5-m sources in general) proved to be good targets for class I maser searches, there are maser sources which do not show this association. We also note that our sample of class I masers does not come from a blind survey, and the fraction of all class I masers with EGOs might be substantially lower.
Close spatial alignment between some class I maser emission and 8.0-m emission features was found in 28 sources out of 65 which have Spitzer data available (43 per cent). In many cases, interpretation of this 8.0-m emission is not straightforward. In some cases, it could even be caused by diffuse PAH emission in the field which is aligned by chance with the methanol masers (e.g. in G329.180.31 and G333.130.56). However, in some cases there are regular filaments (see G335.790.17 in Fig. 1) and bubbles (see G341.220.21 in Fig. 1) which may constitute PDRs of evolved Hii regions that we did not detect due to lack of brightness sensitivity in the radio continuum data. This is a new type of association for the class I methanol masers which has not been reported before. However, it is not entirely unexpected given that the association with expanding Hii regions has been previously suggested (Voronkov et al., 2010b; Cyganowski et al., 2011; Cyganowski et al., 2012). Among 71 sources observed in the present survey, we found associations at arcsec scale between class I maser emission and radio continuum emission in 17 sources (24 per cent). The ring of masers around an infrared source and an Hii region in G305.370.21 is currently the best available example of such an association. Strictly speaking, quite sensitive radio continuum observations with good -coverage (Hindson et al., 2012, similar to that of) are required for this analysis. Such data are not available at the moment for the majority of our targets. In addition, the continuum data used in our study are very inhomogeneous. Therefore the association rate given above should be treated as the lower limit. It is also worth noting that the continuum emission associated with the class I masers in G337.400.40 and G343.120.06 was interpreted as an ionized jet and as internal working surface of the jet, respectively (Guzmán et al., 2012; Garay et al., 2003, see also section 3.1), rather than free-free emission from an Hii region.
5 Conclusions
- 1.
We imaged 71 southern class I methanol maser sources at arcsecond resolution at both 36 and 44 GHz quasi-simultaneously (no more than one day apart). Many sources show complex morphology with the maser emission tracing ordered structures resembling lines or arcs, which may represent outflows. In addition to the outflow scenario suggested by such geometry or confirmed by 2.12-m molecular hydrogen observations, we demonstrate associations with shocks caused by expanding Hii regions, PDRs traced by 8.0-m emission, and interfaces of cold molecular clouds or shocks represented by the 4.5-m emission (EGOs).
- 2.
Association of the class I methanol masers with different phenomena in star forming regions means that these masers are unlikely to trace a unique evolutionary stage and more likely will be present multiple times during the evolution of a high-mass star forming region. In particular, the sample of sources devoid of a 6.7-GHz maser is likely to include both evolved sources, which are too old to have a 6.7-GHz maser and sources which are too young and potentially trace the earliest stages of star formation.
- 3.
The two maser transitions at 36 and 44 GHz were found to be highly complementary and sometimes crucial for the correct interpretation of morphology. Only 23 per cent of emission components were detected in both transitions matching within 3 in both position and velocity.
- 4.
The high-velocity maser features are a phenomenon largely selected against by the existing maser surveys (including this one), which typically lack either the velocity coverage or the spectral resolution (or both). With a caution about low number statistics, the high-velocity features have a tendency to be blue-shifted and stronger at 36 GHz.
- 5.
We suggest a refined rest frequency value of 36169.2380.011 MHz for the 430 E methanol transition.
- 6.
With the exception of high-velocity features, the velocity distribution with respect to the systemic velocity (estimated as the middle of the velocity interval of the associated class II methanol maser at 6.7 GHz) was found to be Gaussian with a mean of 0.570.06 and 0.570.07 km s-1 for the 36- and 44-GHz masers, respectively, and a standard deviation of 3.650.05 and 3.320.07 km s-1, respectively.
- 7.
We investigated the zone of influence around each YSO location (inferred from a class II methanol maser at 6.7 GHz). The probability density function for finding a class I methanol maser at the given projected linear separation from the 6.7-GHz methanol maser was found to be well approximated by an exponential drop off with a scale of 26315 milliparsec for both 36 and 44 GHz transition. This observed distribution can be explained by a uniform spatial density of the class I masers in the near vicinity of the YSOs (within 0.20.3 pc) with a square-law drop off of the spatial density at larger distances. We consider 1 pc to be a good estimate of the typical size of the zone of influence.
- 8.
The class I maser emission shows a tendency to have larger spatial and velocity spreads when the YSO traced by the class II methanol maser at 6.7 GHz has an associated hydroxyl maser and therefore is considered to be more evolved.
- 9.
The distribution of FWHMs for groups of Gaussian components range from 0.12 to 9.3 km s-1, and peaks at FWHM of 0.3 km s-1, clearly characteristic of masers; the weak wings extend to large widths which overlap with expectations for thermal lines.
Acknowledgments
The authors would like to thank Luke Hindson and Luis Zapata for providing their published continuum images in machine-readable form. The Australia Telescope is funded by the Commonwealth of Australia for operation as a National Facility managed by CSIRO. This research would not be possible without NASA’s Astrophysics Data System Abstract Service. This research has made use of data products from the GLIMPSE survey, which is a legacy science program of the Spitzer Space Telescope, funded by the National Aeronautics and Space Administration, and the NASA/IPAC Infrared Science Archive, which is operated by the Jet Propulsion Laboratory, California Institute of Technology, under contract with the National Aeronautics and Space Administration. This research made use of APLpy, an open-source plotting package for Python hosted at http://aplpy.github.com.
References
- Argon et al. (2000) Argon A.L., Reid M.J., Menten K.M., 2000, ApJS, 129, 159
- Bachiller et al. (1990) Bachiller R., Menten K.M., Gómez-González J., Barcia A., 1990, A&A, 240, 116
- Batchelor et al. (1980) Batchelor R.A., Caswell J.L., Goss W.M., Haynes R.F., Knowles S.H., Wellington K.J., 1980, Aust. J. Phys., 33, 139
- Batrla et al. (1987) Batrla W., Matthews H.E., Menten K.M., Walmsley C.M., 1987, Nat, 326, 49
- Bayandina et al. (2012) Bayandina O.S., Val’tts I.E., Larionov G.M., 2012, Astron. Rep., 56, 553
- Braz & Scalise (1982) Braz M.A., Scalise E., 1982, A&A, 107, 272
- Breen et al. (2013) Breen S.L., Ellingsen S.P., Contreras Y., Green J.A., Caswell J.L., Stevens J.B., Dawson J.R., Voronkov M.A., 2013, MNRAS, 435, 524
- Breen & Ellingsen (2011) Breen S.L., Ellingsen S.P., 2011, MNRAS, 416, 178
- Breen et al. (2010a) Breen S.L., Caswell J.L., Ellingsen S.P., Phillips C.J., 2010a, MNRAS, 406, 1487
- Breen et al. (2010b) Breen S.L., Ellingsen S.P., Caswell J.L., Lewis B.E., 2010b, MNRAS, 401, 2219
- Brogan et al. (2009) Brogan C.L., Hunter T.R., Cyganowski C.J., Indebetouw R., Beuther H., Menten K.M., Thorwirth S., 2009, ApJ, 707, 1
- Brooks et al. (2003) Brooks K.J., Garay G., Mardones D., Bronfman L., 2003, ApJ, 594, 131
- Caswell et al. (2011a) Caswell J.L., et al., 2011a, MNRAS, 417, 1964
- Caswell et al. (2011b) Caswell J.L., Hutawarakorn Kramer B., Reynolds J.E., 2011b, MNRAS, 414, 1914
- Caswell et al. (2010) Caswell J.L., et al., 2010, MNRAS, 404, 1029
- Caswell (2009) Caswell J.L., 2009, Publ. Astron. Soc. Australia, 26, 454
- Caswell & Phillips (2008) Caswell J.L., Phillips C.J., 2008, MNRAS, 386, 1521
- Caswell (2001) Caswell J.L., 2001, MNRAS, 326, 805
- Caswell (1998) Caswell J.L., 1998, MNRAS, 297, 215
- Caswell (1997) Caswell J.L., 1997, MNRAS, 289, 203
- Caswell (1996) Caswell J.L., 1996, MNRAS, 279, 79
- Caswell et al. (1995) Caswell J.L., Vaile R.A., Forster J.R., 1995, MNRAS, 277, 210
- Caswell et al. (1989) Caswell J.L., Batchelor R.A., Forster J.R., Wellington K.J., 1989, Aust. J. Phys., 42, 331
- Caswell & Haynes (1987a) Caswell J.L., Haynes R.F., 1987a, A&A, 171, 261
- Caswell & Haynes (1987b) Caswell J.L., Haynes R.F., 1987b, Aust. J. Phys., 40, 215
- Caswell et al. (1983) Caswell J.L., Batchelor A., Forster J.R., Wellington K.J., 1983, Aust. J. Phys., 36, 401
- Caswell & Robinson (1974) Caswell J.L., Robinson B.J., 1974, Aust. J. Phys., 27, 597
- Caswell (1972) Caswell J.L., 1972, Aust. J. Phys., 25, 443
- Chambers et al. (2009) Chambers E.T., Jackson J.M., Rathborne J.M., Simon R., 2009, ApJS, 181, 360
- Chen et al. (2013) Chen X., Gan C.-G., Ellingsen S.P., He J.-H., Shen Z.-Q., Titmarsh A., 2013, ApJS, 206, 9
- Chen et al. (2011) Chen X., Ellingsen S.P., Shen Z.-Q., Titmarsh A., Gan C.-G., 2011, ApJS, 196, 9
- Churchwell et al. (2006) Churchwell E., et al., 2006, ApJ, 649, 759
- Cragg et al. (2004) Cragg D.M., Sobolev A.M., Caswell J.L., Ellingsen S.P., Godfrey P.D., 2004, MNRAS, 351, 1327
- Cragg et al. (2001) Cragg D.M., Sobolev A.M., Ellingsen S.P., Caswell J.L., Godfrey P.D., Salii S.V., Dodson R.G., 2001, MNRAS, 323, 939
- Cragg et al. (1992) Cragg D.M., Johns K.P., Godfrey P.D., Brown R.D., 1992, MNRAS, 259, 203
- Cyganowski et al. (2012) Cyganowski C.J., Brogan C.L., Hunter T.R., Zhang Q., Friesen R.K., Indebetouw R., Chandler C.J., 2012, ApJ, 760, L20
- Cyganowski et al. (2011) Cyganowski C.J., Brogan C.L., Hunter T.R., Churchwell E., 2011, ApJ, 743, 56
- Cyganowski et al. (2009) Cyganowski C.J., Brogan C.L., Hunter T.R., Churchwell E., 2009, ApJ, 702, 1615
- Cyganowski et al. (2008) Cyganowski C.J., et al., 2008, AJ, 136
- De Buizer & Vacca (2010) De Buizer J.M., Vacca W.D., 2010, AJ, 140, 196
- De Buizer et al. (2009) De Buizer J.M., Redman R.O., Longmore S.N., Caswell J., Feldman P.A., 2009, A&A, 493, 127
- De Buizer (2003) De Buizer J.M., 2003, MNRAS, 341, 277
- Deharveng et al. (2009) Deharveng L., Zavagno A., Schuller F., Caplan J., Pomarès M., De Breuck C., 2009, A&A, 496, 177
- Ellingsen et al. (2013) Ellingsen S.P., Breen S.L., Voronkov M.A., Dawson J.R., 2013, MNRAS, 429, 3501
- Ellingsen et al. (2012) Ellingsen S.P., Sobolev A.M., Cragg D.M., Godfrey P.D., 2012, ApJ, 759, L5
- Ellingsen et al. (2011) Ellingsen S., Voronkov M., Breen S., 2011, Phys. Rev. Lett., 107, 270801
- Ellingsen et al. (2007) Ellingsen S.P., Voronkov M.A., Cragg D.M., Sobolev A.M., Breen S.L., Godfrey P.D., 2007, proceedings of IAU Symposium 242, Astrophysical Masers and their Environments (eds. J. M. Chapman, W. A. Baan), 213 (arXiv:0705.2906)
- Ellingsen (2006) Ellingsen S.P., 2006, ApJ, 638, 241
- Ellingsen (2005) Ellingsen S.P., 2005, MNRAS, 359, 1498
- Ellingsen et al. (1996) Ellingsen S.P., Norris R.P., McCulloch P.M., 1996, MNRAS, 279, 101
- Fish et al. (2011) Fish V.L., Muehlbrad T.C., Pratap P., Sjouwerman L.O., Strelnitski V., Pihlström Y.M., Bourke T.L., 2011, ApJ, 729, 14
- Fish et al. (2005) Fish V.L., Reid M.J., Argon A.L., Zheng X.-W., 2005, ApJS, 160, 220
- Forster (1990) Forster J.R., 1990, 1990, A&A, 227, L37
- Forster & Caswell (1989) Forster J.R., Caswell J.L., 1989, A&A, 213, 339
- Gan et al. (2013) Gan C.-G., Chen X., Shen Z.-Q., Xu Y., Ju B.-G., 2013, ApJ, 763, 2
- Garay et al. (2006) Garay G., Brooks K.J., Mardones D., Norris R.P., 2006, ApJ, 651, 914
- Garay et al. (2004) Garay G., Faúndez S., Mardones D., Bronfman L., Chini R., Nyman, L.-Å., 2004, ApJ, 610, 313
- Garay et al. (2003) Garay G., Brooks K.J., Mardones D., Norris R.P., 2003, ApJ, 587, 739
- Garay et al. (2002a) Garay G., Mardones D., Rodríguez L.F., Caselli P., Bourke T.L., 2002a, ApJ, 567, 980
- Garay et al. (2002b) Garay G., Brooks K.J., Mardones D., Norris R.P., Burton M.G., 2002b, ApJ, 579, 678
- Gibb & Davis (1998) Gibb A.G., Davis C.J., 1998, MNRAS, 298, 644
- Gómez et al. (2010) Gómez L., Luis L., Hernández-Curiel I., Kurtz S.E., Hofner P., Araya E.D., 2010, ApJS, 191, 207
- Green et al. (2012a) Green J.A., et al., 2012a, MNRAS, 420, 3108
- Green et al. (2012b) Green J.A., McClure-Griffiths N.M., Caswell J.L., Robishaw T., Harvey-Smith L., 2012b, MNRAS, 425, 2530
- Green & McClure-Griffiths (2011) Green J.A., McClure-Griffiths N.M., 2011, MNRAS, 417, 2500
- Green et al. (2009) Green J.A., et al., 2009, MNRAS, 392, 783
- Guzmán et al. (2012) Guzmán A.E., Garay G., Brooks K.J., Voronkov M.A., 2012, ApJ, 753
- Habart et al. (2005) Habart E., Walmsley M., Verstraete L., Cazaux S., Maiolino R., Cox P., Boulanger F., Pineau Des Forêts G., 2005, Sp. Sci. Rev., 119, 71
- Hartquist et al. (1995) Hartquist T.W., Menten K.M., Lepp S., Dalgarno A., 1995, MNRAS, 272, 184
- Hashimoto et al. (2008) Hashimoto J., et al., 2008, ApJ, 677, L39
- Hashimoto et al. (2007) Hashimoto J., Tamura M., Suto H., Abe L., Ishii M., Kudo T., Mayama S., 2007, PASJ, 59, 221
- Henning et al. (2000) Henning Th., Lapinov A., Schreyer K., Stecklum B., Zinchenko I., 2000, A&A, 364, 613
- Hindson et al. (2012) Hindson L., Thompson M.A., Urquhart J.S., Faimali A., Clark J.S., Davies B., 2012, MNRAS, 421, 3418
- Hughes & MacLeod (1993) Hughes V.A., MacLeod G.C., 1993, AJ, 105, 1495
- Jordan et al. (2013) Jordan C.H., Walsh A.J., Lowe V., Lo N., Purcell C.R., Voronkov M.A., Longmore S.N., 2013, MNRAS, 429, 469
- Kalenskii et al. (2013) Kalenskii S.V., Kurtz S., Bergman P., 2013, Astron. Rep., 57, 120
- Kalenskii et al. (2010) Kalenskii S.V., Johansson L.E.B., Bergman P., Kurtz S., Hofner P., Walmsley C.M., Slysh V.I., 2010, MNRAS, 405, 613
- Kogan & Slysh (1998) Kogan L., Slysh V., 1998, ApJ, 497, 800
- Kurtz et al. (2004) Kurtz S., Hofner P., Álvarez C.V., 2004, ApJS, 155, 149
- Longmore et al. (2007) Longmore S.N., Maercker M., Ramstedt S., Burton M.G., 2007, MNRAS, 380, 1497
- Leurini et al. (2013a) Leurini S., Wyrowski F., Herpin F., van der Tak F., Güsten R., van Dishoeck E.F., 2013a, A&A, 550, A10
- Leurini et al. (2013b) Leurini S., Codella C., Gusdorf A., Zapata L., Gómez-Ruiz A., Testi L., Pillai T., 2013b, A&A, 554, A35
- Leurini et al. (2009) Leurini S., et al., 2009, A&A, 507, 1443
- Levshakov et al. (2011) Levshakov S.A., Kozlov M.G., Reimers D., 2011, ApJ, 738, 26
- McCutcheon et al. (2000) McCutcheon W.H., Sandell G., Matthews H.E., Kuiper T.B.H., Sutton E.C., Danchi W.C., Sato T., 2000, MNRAS, 316, 152
- Minier et al. (2009) Minier V., et al., 2009, A&A, 501, L1
- Mottram et al. (2007) Mottram J.C., Hoare M.G., Lumsden S.L., Oudmaijer R.D., Urquhart J.S., Sheret T.L., Clarke A.J., Allsopp J., 2007, A&A, 476, 1019
- (Müller et al.2004) Müller H.S.P., Menten K.M., Mäder H., 2004, A&A, 428, 1019
- Muñoz et al. (2007) Muñoz D.J., Mardones D., Garay G., Rebolledo D., Brooks K., Bontemps S., 2007, ApJ, 668, 906
- Murphy & May (1991) Murphy D.C., May J., A&A, 247, 202
- Peretto et al. (2013) Peretto N., et al., 2013, A&A, 555, A112
- Peretto & Fuller (2009) Peretto N., Fuller G.A., 2009, A&A, 505, 405
- Phillips et al. (1998) Phillips C.J., Norris R.P., Ellingsen S.P., McCulloch P.M., 1998, MNRAS, 300, 1131
- Rodgers et al. (1960) Rodgers A.W., Campbell C.T., Whiteoak J.B., 1960, MNRAS, 121, 103
- Russeil et al. (2013) Russeil D., et al., 2013, A&A, 554, A42
- Salii & Sobolev (2006) Salii S.V., Sobolev A.M., 2006, Astron. Rep., 50, 965
- Simon et al. (2006) Simon R., Jackson J.M., Rathborne J.M., Chambers E.T., 2006, ApJ, 639, 227
- Sjouwerman et al. (2010) Sjouwerman L.O., Pihlström Y.M., Fish V.L., 2010, ApJ, 710, 111
- Slysh et al. (1994) Slysh V.I., Kalenskii S.V., Val’tts I.E., Otrupcek R., 1994, MNRAS, 268, 464
- Sobolev et al. (2005) Sobolev A.M., Ostrovskii A.B., Kirsanova M.S., Shelemei O.V., Voronkov M.A., Malyshev A.V., 2005, proceedings of IAU Symposium 227 (eds. E.Churchwell, P.Conti and M.Felli), 174 (astro-ph/0601260)
- Sobolev & Deguchi (1994) Sobolev A.M., Deguchi S., 1994, A&A, 291, 569
- Thompson et al. (2012) Thompson M.A., Urquhart J.S., Moore T.J.T., Morgan L.K., 2012, MNRAS, 421, 408
- Turner (1970) Turner B.E., 1970, Astrophys. Lett., 6, 99
- Urquhart et al. (2007) Urquhart J.S., Busfield A.L., Hoare M.G., Lumsden S.L., Clarke A.J., Moore T.J.T., Mottram J.C., Oudmaijer R.D., 2007, MNRAS, A&A, 461, 11
- Val’tts et al. (2000) Val’tts I.E., Ellingsen S.P., Slysh V.I., Kalenskii S.V., Otrupcek R., Larionov G.M., 2000, MNRAS, 317, 315
- Val’tts (1998) Val’tts I.E., 1998, Astron. Lett., 24, 788
- Voronkov et al. (2012) Voronkov M.A., Caswell J.L., Ellingsen S.P., Breen S.L., Britton T.R., Green J.A., Sobolev A.M., Walsh A.J., 2012, proceedings of IAU Symposium 287, Cosmic Masers - from OH to H0 (eds. R. S. Booth, E.M.L. Humphreys, W.H.T. Vlemmings), 433 (arXiv: 1203.5492)
- Voronkov et al. (2011) Voronkov M.A., Walsh A.J., Caswell J.L., Ellingsen S.P., Breen S.L., Longmore S.N., Purcell C.R., Urquhart J.S., 2011, MNRAS, 413, 2339
- Voronkov et al. (2010a) Voronkov M.A., Caswell J.L., Britton T.R., Green J.A., Sobolev A.M., Ellingsen S.P., 2010a, MNRAS, 408, 133
- Voronkov et al. (2010b) Voronkov M.A., Caswell J.L., Ellingsen S.P., Sobolev A.M., 2010b, MNRAS, 405, 2471
- Voronkov et al. (2007) Voronkov M.A., Brooks K.J., Sobolev A.M., Ellingsen S.P., Ostrovskii A.B., Caswell J.L., 2007, proceedings of IAU Symposium 242, Astrophysical Masers and their Environments (eds. J. M. Chapman, W.A. Baan), 182 (arXiv: 0705.0355)
- Voronkov et al. (2006) Voronkov M.A., Brooks K.J., Sobolev A.M., Ellingsen S.P., Ostrovskii A.B., Caswell J.L., 2006, MNRAS, 373, 411
- Voronkov et al. (2005a) Voronkov M.A., Sobolev A.M., Ellingsen S.P., Ostrovskii A.B., 2005a, MNRAS, 362, 995
- Voronkov et al. (2005b) Voronkov M.A., Sobolev A.M., Ellingsen S.P., Ostrovskii A.B., Alakoz A.V., 2005b, Ap&SS, 295, 217
- Walsh et al. (2011) Walsh A.J., et al., 2011, MNRAS, 416, 1764
- Walsh et al. (2007) Walsh A.J., Chapman J.F., Burton M.G., Wardle M., Millar T.J., 2007, MNRAS, 380, 1703
- Walsh & Burton (2006) Walsh A.J., Burton M.G., 2006, MNRAS, 365, 321
- Walsh et al. (2001) Walsh A.J., Bertoldi F., Burton M.G., Nikola T., 2001, MNRAS, 326, 36
- Walsh et al. (1999) Walsh A.J., Burton M.G., Hyland A.R., Robinson G., 1999, MNRAS, 309, 905
- Walsh et al. (1998) Walsh A.J., Burton M.G., Hyland A.R., Robinson G., 1998, MNRAS, 301, 640
- Watson et al. (1998) Watson C., et al., 2008, ApJ, 681, 1341
- Wyrowski et al. (2008) Wyrowski F., Bergman P., Menten K., Ott J., Schilke P., Thorwirth S., 2008, Ap&SS, 313, 69
- Wyrowski et al. (2006) Wyrowski F., Menten K.M., Schilke P., Thorwirth S., Güsten R., Bergman P., 2006, A&A, 454, L91
- Yusef-Zadeh et al. (2013) Yusef-Zadeh F., Cotton W., Viti S., Wardle M., Royster M., 2013, ApJ, 764, L19
- Zapata et al. (2008) Zapata L. A., Leurini S., Menten K.M., Schilke P., Rolffs R., Hieret C., 2008, AJ, 136, 1455