Through the looking GLASS: HST spectroscopy of faint galaxies lensed by the Frontier Fields cluster MACSJ0717.5+3745
Abstract
The Grism Lens-Amplified Survey from Space (GLASS) is a Hubble Space Telescope (HST) Large Program, which will obtain 140 orbits of grism spectroscopy of the core and infall regions of 10 galaxy clusters, selected to be among the very best cosmic telescopes. Extensive HST imaging is available from many sources including the CLASH and Frontier Fields programs. We introduce the survey by analyzing spectra of faint multiply-imaged galaxies and galaxy candidates obtained from the first seven orbits out of fourteen targeting the core of the Frontier Fields cluster MACSJ0717.5+3745. Using the G102 and G141 grisms to cover the wavelength range 0.8–1.7m, we confirm 4 strongly lensed systems by detecting emission lines in each of the images. For the 9 galaxy candidates clear from contamination, we do not detect any emission lines down to a seven-orbit 1 noise level of 510-18erg s-1cm-2. Taking lensing magnification into account, our flux sensitivity reaches 0.2–510-18erg s-1cm-2. These limits over an uninterrupted wavelength range rule out the possibility that the high- galaxy candidates are instead strong line emitters at lower redshift. These results show that by means of careful modeling of the background — and with the assistance of lensing magnification — interesting flux limits can be reached for large numbers of objects, avoiding pre-selection and the wavelength restrictions inherent to ground-based multi-slit spectroscopy. These observations confirm the power of slitless HST spectroscopy even in fields as crowded as a cluster core.
Subject headings
galaxies: evolution — galaxies: high-redshift — galaxies: clusters: individual (MACSJ0717.5+3745)I. Introduction
The emergence of the first galaxies from the mist of cosmic dawn is one of the major outstanding questions in current astrophysics. Measurements of the cosmic microwave background anisotropy indicate that the universe was reionized during the redshift range 7–12 [31, 3, 20, e.g.]. The first galaxies were most likely the source of reionizing photons, although this has not been conclusively proven given the observational and theoretical uncertainties [33, 35].
Finding and spectroscopically confirming the first galaxies is essential not only to identify the sources of reionization but also to understand the physical mechanisms at work in the early starforming regions, the interstellar and circumgalactic media. Much progress has been achieved with photometric studies. Large samples of candidate galaxies at have been identified in blank fields or behind clusters using the Lyman break technique or spectral energy distribution fitting techniques [5, 17, 28, 15, 35].
In contrast, spectroscopic confirmation has been much harder to achieve. In spite of numerous attempts on modern and sensitive ground-based spectrographs only very few Ly detections have been reported at [30, 8, 29, 34, 13, 14, 39, e.g.,] and only one at [18, at ]. The decrease in Ly flux coming from Lyman Break Galaxies (LBGs) at has been interpreted as evidence for an increased hydrogen neutral fraction corresponding to a long ending tail of cosmic reionization [19, 21, 37, e.g.,]. Alternative explanations for the decrease in Ly emission include changes in the local circumgalactic medium [16, 22, e.g.,] or perhaps a dramatic increase in the fraction of interlopers amongst Lyman break galaxies. Sensitive and complete spectroscopic surveys sensitive to Ly at are needed to make progress.
A powerful alternative to ground based spectroscopy is slitless spectroscopy with HST. Basic advantages over the ground are the absence of night sky emission lines and of atmospheric absorption. Furthermore, slitless spectroscopy does not require preselection of targets for inclusion in masks and it is therefore straightforward to obtain complete samples. These two advantages make Hubble competitive for the spectroscopic study of galaxies at the epoch of cosmic reionization provided that long enough exposures are obtained, assisted by lensing magnification [40].
Studying the very high-redshift universe with the combination of the HST grism spectroscopy and gravitational lensing magnification is one of the key goals of the Grism Lens-Amplified Survey from Space (GLASS), which we introduce in this letter. We briefly present the Survey, its goals and observational strategy and Wide Field Camera 3 (WFC3) infrared observations of the first targeted cluster MACSJ0717.5+3745. In order to demonstrate the performance of the HST grism in a crowded field, we concentrate on spectroscopy of faint targets, including multiply-imaged emission-line galaxies and photometrically-selected galaxy candidates at . We also present additional ground based spectroscopy obtained with the MOSFIRE spectrograph on the W.M. Keck-I 10m Telescope.
We adopt a standard cosmology with , , .
II. The Grism Lens-Amplified Survey from Space
GLASS11 1 http://glass.physics.ucsb.edu (GO-13459; PI: Treu) is a 140 orbit spectroscopic survey with HST. Using WFC3’s G102 and G141 infrared grisms GLASS will obtain slitless spectroscopy of the cores of 10 galaxy clusters, with uninterrupted wavelength coverage in the wavelength range 0.8–1.7 m. Pre-imaging through filters F105W and F140W is obtained before each spectral exposure to assist in the extraction of the spectra and modeling the contamination from neighboring sources. The total exposure time per cluster is 10 orbits in F105W+G102 and 4 in F140W+G141. Each cluster is observed at two orientations, differing by approximately 90 degrees, in order to facilitate deblending and extraction of the spectra. Parallel observations with the Advanced Camera for Surveys (ACS) through filter F814W and grism G800L are carried out for each cluster in order to map the cluster infall regions. The three key goals of GLASS are i) the study of galaxies at the epoch of reionization through the detection of Ly at ; ii) the study of the cycling of gas and metals in and out of galaxies at ; and iii) the study of star formation and metallicity as a function of environment in the foreground clusters and infall regions. Magnification by the foreground clusters greatly assists the first two science goals as well as a number of other ancillary science goals (e.g. lensed supernovae, red quiescent galaxies, etc.).
III. Observations and Data Reduction
The GLASS data presented provide the first orientation (i.e., half of the final data) of the cluster MACSJ0717.5+3745 and were carried out on December 24 and 30 2013. The total exposure times are 10029 and 3812 seconds with the WFC3 G102 and G141 grisms, after removal of a few reads affected by significantly elevated backgrounds (Brammer et al. 2014, in prep.). In addition, we obtain 1979 and 712 seconds of direct imaging in the WFC3 F105W and F140W filters, aiding the alignment of the grism exposures.
MACSJ0717.5+3745 is part of the Frontier Fields initiative22 2 http://www.stsci.edu/hst/campaigns/frontier-fields/ and has been observed extensively by CLASH [32]. We take advantage of the CLASH photometry when selecting our LBG samples as described in Section V. In the top panel of Figure 1 we show a false-color image using the CLASH imaging of MACSJ0717.5+3745 with the position of the GLASS MACSJ0717.5+3745 field-of-view (FOV) presented here marked by the magenta square.


The GLASS observations were designed to follow the 3D-HST observing strategy [12], and were processed with the 3D-HST reduction pipeline33 3 http://code.google.com/p/threedhst/. In the following we summarize the main reduction steps but refer to [12] for further details.
The data were taken in a 4-point dither pattern identical to the one shown in Figure 3 of [12]. At each individual dither position a F105W-G102 or F141W-G141 pair of exposures was taken, in order to optimize rejection of bad pixels and cosmic rays and improve sampling of the WFC3 point spread function.
The individual exposures were turned into a mosaic using MultiDrizzle
[23] adjusting the alignments using the PyRAF
routine, tweakshifts. The background was subtracted from the
direct images fitting a 2nd order polynomial to each of the
source-subtracted exposures. For the G102 background subtraction we
used the master background presented by [24],
whereas for the G141 grism we used the master backgrounds developed by
[12] for 3D-HST.
The individual background-subtracted exposures were then combined to produce a mosaic with a final pixel scale of roughly per pixel as described by Brammer et al. [11] (half a native pixel). This corresponds to 12(22)Å per pixel for the G102(G141) dispersion. In the bottom panels of Figure 1 we show the resulting interlaced full FOV G102 (left) and G141 (right) grism images.
From these interlaced images the position of each individual spectrum
can be predicted by dispersing each pixel of each individual object in
the SExtractor [4] segmentation maps
created from the direct F105W and F140W images. In this way,
individual spectra can be extracted and spectral contamination, i.e.,
flux from overlapping spectra from neighboring objects, can be
accounted for.
III.1. Additional ground based spectroscopy
MACSJ0717.5+3745 was observed at Keck on 2013 December 15(17) in Y(H) band using the MOSFIRE near-infrared spectrograph [26, Keck Proposal U004M; PI Bradač]. Conditions on December 15(17) were good(poor) with () seeing. Exposure time was 3960s in Y and 3360s in H band. The data reduction was performed using the publicly available MOSFIRE data reduction pipeline (DRP44 4 http://code.google.com/p/mosfire/).
IV. Faint multiply-imaged galaxies
We extracted spectra for all the sets of multiple images identified by Limousin et al. [25] [see also 43, 27, for additional models of the cluster] that lie within the GLASS FOV and do not have complete sets of redshifts from the literature. For sets 3, 4, 12, 14 as defined by Limousin et al. [25], we detect the same emission lines from each image (see Table 1), thus confirming the lensing hypothesis. The postage stamp images and two-dimensional spectra of the four systems are shown in Figures 2 and 3. Contaminating spectra from nearby objects have been modeled and subtracted from these spectra. MOSFIRE spectra are shown together with GLASS HST spectra when available. We also detect with MOSFIRE the [O III]4959,5007 doublet in emission from image 6.1, which falls outside of the GLASS FOV, placing it at . The redshifts of image sets 3 and 14 agree with the value for 3.2 and 14.1 () previously measured by Limousin et al. [25].
Note the spatial extent of the emission lines, e.g. for 4.1. In such cases the combination of HST’s angular resolution and lensing magnification will allow us to measure spatially resolved metallicity and star formation gradients with sub-kpc resolution (Jones et al. 2014, in prep.).
The confirmation of the lensing hypothesis and the spectroscopic redshifts being close to the photometric redshift estimates ( , respectively for sets 4, 6, and 12) further validates the lens models published and available as part of the Frontier Fields initiative. When the GLASS dataset of MACSJ0717.5+3745 is complete we will carry out a systematic search for new sets of multiple image systems based on spectroscopic data. The use of spectroscopic data greatly reduces the space of possible counterimages and therefore should enable the unambiguous identification of faint multiple images. In combination with upcoming deep imaging from the Frontier Fields initiative, the additional data will allow us to further refine the lens models, the magnification maps, and study the distribution of luminous and dark matter in the cluster itself.
| ID | F814W mag | F850LP mag | F105W mag | F110W mag | F125W mag | F140W mag | F160W mag | Line; C | ; Sel. | ; | |||
|---|---|---|---|---|---|---|---|---|---|---|---|---|---|
| 3.1 | 0.398545 | 0.741498 | 24.990.04 | 24.880.09 | 25.050.07 | 25.020.05 | 24.930.06 | 24.610.04 | 24.500.04 | 4.6[5.1-20.0] | [OIII] | 1.855 | 4.971.25 |
| 3.2 | 0.394459 | 0.739172 | 25.130.04 | 24.950.11 | 25.020.06 | 25.030.05 | 24.990.07 | 24.610.04 | 24.480.03 | 15.1[5.9-15.6] | [OIII] | 1.855 | 11.891.19 |
| 3.3 | 0.407156 | 0.753831 | 25.770.07 | 25.990.23 | 25.690.10 | 25.510.07 | 25.340.08 | 25.230.06 | 25.050.05 | 3.1[3.1-6.2] | [OIII] | 1.855 | 2.391.24 |
| 4.1 | 0.381093 | 0.750440 | 22.990.01 | 22.880.03 | 22.570.01 | 22.450.01 | 22.320.01 | 22.130.01 | 22.040.01 | 4.0[5.1-14.6] | [OIII] | 1.855 | 46.122.42 |
| 4.2 | 0.376338 | 0.744602 | 23.840.02 | 23.680.05 | 23.450.02 | 23.300.01 | 23.200.02 | 23.020.01 | 22.940.01 | 9.5[3.1-9.5] | [OIII] | 1.855 | 22.101.61 |
| 4.3 | 0.391097 | 0.763077 | 21.560.00 | 21.360.01 | 21.280.01 | 21.220.00 | 21.160.01 | 21.020.00 | 20.970.00 | 3.0[2.6-3.2] | [OIII] | 1.855 | 21.611.38 |
| 12.1 | 0.385131 | 0.751820 | 24.770.04 | 24.790.13 | 24.310.05 | 24.180.03 | 24.010.04 | 24.090.03 | 24.190.04 | 15.8[3.9-7.3] | [OIII] | 1.699 | 4.151.04 |
| 12.2 | 0.377607 | 0.742896 | 25.700.07 | 26.180.31 | 25.390.09 | 25.310.06 | 24.940.07 | 25.110.06 | 25.090.06 | 7.6[2.7-7.6] | [OIII] | 1.699 | 4.401.13 |
| 12.3 | 0.391226 | 0.760674 | 25.140.05 | 25.080.15 | 24.780.06 | 24.530.04 | 24.390.05 | 24.500.04 | 24.620.05 | 3.3[3.3-6.4] | [OIII] | 1.699 | 8.981.35 |
| 14.1 | 0.388806 | 0.752160 | 23.260.02 | 23.140.05 | 22.790.02 | 22.630.01 | 22.500.02 | 22.340.01 | 22.270.01 | 16.8[5.7-12.2] | [OIII] | 1.855 | 5.321.76 |
| 14.2 | 0.379659 | 0.739712 | 25.280.05 | 24.930.11 | 24.730.05 | 24.650.04 | 24.480.05 | 24.310.03 | 24.220.03 | 6.4[2.6-5.3] | [OIII] | 1.855 | 4.611.24 |
| 14.3 | 0.396192 | 0.760425 | 24.150.52 | 24.000.07 | 23.620.03 | 23.480.02 | 23.250.02 | 23.160.02 | 23.040.01 | 3.0[4.2-5.4] | [OIII] | 1.855 | 2.181.67 |
| 145 | 0.382022 | 0.767622 | 27.620.20 | 26.280.18 | 26.930.20 | 26.770.10 | – | 26.910.20 | 27.090.22 | 13.8[2.8-13.8] | o | SB | – |
| 166 | 0.391443 | 0.767048 | 27.860.25 | 26.940.33 | 27.100.21 | 26.790.12 | 27.000.21 | 27.000.17 | 27.390.24 | 4.2[2.4-4.2] | o | SB | – |
| 174 | 0.396578 | 0.766722 | 32.452.59 | 28.63 | 27.700.19 | 28.330.24 | 27.620.21 | 29.220.57 | 28.620.38 | 4.2[2.2-3.8] | o | zB | – |
| 234 | 0.399120 | 0.764958 | 28.060.39 | 26.330.25 | 26.450.15 | 26.110.08 | 26.490.18 | 26.110.10 | 26.340.13 | 4.2[2.8-4.2] | g | iB,SB | 43 |
| 247 | 0.379770 | 0.764690 | 26.700.13 | 25.870.16 | 25.580.06 | 25.580.05 | 25.460.07 | 25.420.05 | 25.430.05 | 9.5[4.0-22.8] | o | SB | – |
| 390 | 0.373082 | 0.761676 | 28.430.29 | 27.880.51 | 27.260.17 | 27.420.14 | 27.470.22 | 27.540.19 | 27.390.17 | 3.9[3.1-8.9] | o | SB | – |
| 844 | 0.404579 | 0.754928 | 27.200.15 | 26.630.28 | 26.470.14 | 26.530.11 | 26.630.17 | 26.690.14 | 26.780.16 | 7.4[7.4-28.1] | c | SB | – |
| 858 | 0.372670 | 0.754728 | 27.850.21 | 27.110.32 | 27.160.18 | 27.480.17 | 27.250.21 | 27.200.16 | 27.610.23 | 28.5[3.9-28.5] | g | iV,iB | 117 |
| 859 | 0.409065 | 0.754686 | 28.040.26 | 26.240.16 | 26.420.11 | 26.310.08 | 26.400.12 | 26.520.11 | 26.890.15 | 5.4[5.4-12.0] | g | iV,SB | 50 |
| 1077 | 0.386225 | 0.751928 | 28.360.36 | 27.010.31 | 26.920.17 | 27.000.14 | 27.130.22 | 26.980.16 | 27.020.17 | 2.5[2.4-3.1] | g | SB | 84 |
| 1230 | 0.373824 | 0.749445 | 26.690.12 | 25.870.16 | 25.630.07 | 25.540.05 | 25.680.08 | 25.480.05 | 25.560.06 | 34.4[9.7-34.4] | g | SB | 21 |
| 1373 | 0.366140 | 0.747541 | 28.370.28 | 29.181.16 | 27.940.30 | 27.330.14 | 27.540.24 | 27.750.23 | 27.430.18 | 1.8[1.4-1.8] | o | SB | – |
| 1492 | 0.368709 | 0.746143 | 27.590.18 | 27.000.32 | 27.660.31 | 27.080.14 | 27.070.21 | 27.160.18 | 27.150.18 | 13.1[3.1-13.1] | c | iB | – |
| 1656 | 0.377434 | 0.743617 | 28.970.53 | 28.23 | 27.380.24 | 27.780.25 | 27.250.24 | 27.250.19 | 27.150.18 | 36.5[5.2-36.5] | g | zB | 74 |
| 1730 | 0.407728 | 0.742741 | 28.430.32 | 25.930.11 | 26.350.16 | – | 26.790.16 | 26.710.16 | 26.780.18 | 2.8[4.7-18.3] | c | iV,SB | – |
| 1749 | 0.390730 | 0.742226 | 26.280.11 | 25.710.21 | 25.300.08 | 25.290.06 | 25.440.10 | 25.460.09 | 25.410.08 | 4.6[12.9-39.0] | c | SB | – |
| 1764 | 0.365558 | 0.742210 | 28.530.34 | 27.240.31 | 27.370.21 | 27.640.19 | 27.040.19 | 27.610.23 | 27.630.23 | 5.6[1.9-5.6] | o | iB | – |
| 1825 | 0.408768 | 0.740805 | 25.490.03 | 24.690.04 | 24.820.04 | – | 24.860.03 | 24.870.03 | 24.820.03 | 5.0[5.0-32.7] | c | SB | – |
| 1841 | 0.375517 | 0.741206 | 28.060.19 | 27.210.26 | 28.170.33 | 28.010.22 | 27.670.25 | 28.020.26 | 28.220.31 | 6.3[2.7-6.3] | g | iB | 197 |
| 1944 | 0.378288 | 0.739163 | 27.720.21 | 26.410.20 | 27.500.28 | 27.310.18 | 27.010.21 | 26.990.16 | 27.210.19 | 6.4[2.9-6.4] | g | iB,SB | 92 |
| 1991 | 0.392335 | 0.738083 | 26.050.09 | 25.550.24 | 25.470.09 | 25.660.08 | 25.540.11 | 25.500.08 | 25.590.09 | 36.5[8.7-36.5] | g | iV,iB,SB | 23 |
Note. — Multiply-imaged (Section IV) and (Section V) galaxy samples. Right ascension is relative to 109.000000 and declination is relative to 37.000000. Magnitudes are observed CLASH (lensed) isophotal magnitudes (ISOMAG). The column gives the best fit magnification estimate at the object position from the Frontier Fields magnification map of Bradac et al. (see http://archive.stsci.edu/prepds/frontier/lensmodels/). The range after each value shows the minimum an maximum estimate of seven different Frontier Fields magnification estimates after removing the largest and smallest values. For seven models this approximates the 16th and 84th percentile of the distribution, and thus provides an estimate of the modeling error. The remaining three columns have different meaning for the two samples. For the multiple imaged sources they indicate the main emission line found in the grism spectra (line), the corresponding redshift (), and the estimated line flux (). For the dropouts C indicates whether an object fell outside the GLASS FOV shown in Figure 1 (o), was heavily contaminated (c), or is considered good enough for EW limit estimates (g). The Sel. column indicates what selection criteria each object satisfies as described in Section V.1, and lists the 1 noise level for each target expressed in rest frame equivalent width. In order to compute and we adopt fiducial redshifts for SB, iV, iB, for zB, and for the two spectroscopically confirmed sources (859, 1730). Unresolved object with FWHM in the image plane [10, see]


V. Galaxy candidates at
V.1. Photometric Selection
We have assembled an extensive list of candidate galaxies at using multiple selection criteria applied to the CLASH catalog as summarized below. After the initial color/SED criteria, all candidates were visually inspected to remove hot pixels, diffraction spikes, and edge defects. The candidates passing the color selection and visual inspection are listed in Table 1.
- iV
i775-band dropout selection from [41], requiring that all bands bluewards of the F775W band have S/N2, iz1.3 and S/N. This selection yields 4 candidates with .
- iB
i775-band dropout selection from [7]. Similar to iV except that zJ0.9 instead of S/N. This selection yields 7 candidates with .
- zB
z850-band dropout selection from [7]. Bands bluewards of F850LP were required to have S/N and
(1) This returns 2 candidates with .
- SB
The 15 CLASH SED-selected LBGs behind MACSJ0717.5+3745 from [10].
Column ‘Sel.’ of Table 1 indicates the selection criteria that yielded each candidate. Note that some candidates are identified by multiple criteria. We also searched for YJ, J125, and JH140 dropouts as described by [28], Y dropouts following [6], and a slightly modified (using F105W instead of F098M) version of the BoRG Y-band dropouts selection [38, 9, 35]. None of these methods returned any candidates. The [10] photometric-redshift selection agrees with this as they did not find any candidates either. In summary, we have assembled a list of 21 unique candidate high- galaxies. Two of the targets (859 and 1730) have recently been spectroscopically confirmed to be at by Vanzella et al. [42].
V.2. Flux, luminosity and equivalent width limits.
Out of the 21 LBG candidates 14 fell within the FOV of the G102 and G141 GLASS pointings analyzed here. We do not detect any line emission. 9 of the GLASS spectra were free of contamination by spectra from other objects and were used to estimate the flux sensitivity.55 5 For the remaining objects the flux sensitivity depends very strongly on the wavelength range and the level of contamination. For an aperture of 5 (spatial) by 3 (spectral) native pixels (0.6″72(132)Å for G102(G141)), the 1 limiting flux is of the order 10-17erg s-1cm-2 as shown in the top panel of Figure 4. The sensitivity is comparable with what is reached in blank fields [1, e.g.,] and agrees well with the exposure time calculator.
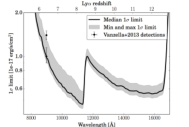

One of the goals of GLASS is to take advantage of the lensing magnification of high-redshift sources to enhance the probability of detecting otherwise unreachable flux limits. To illustrate the benefits of magnification, the bottom panel of Figure 4 shows the limiting flux for the 9 spectra corrected for the estimated magnification, assuming that they are at a redshift of 6, 6.4, 7 depending on their selection method. Note that magnification changes very little at these redshifts, owing to the flatness of the angular diameter distance-redshift relation. It is clear that a significant improvement in the effective limiting fluxes is achieved from the cluster lensing magnification. However, it is also clear that a relatively high magnification is needed to obtain several- detections of line fluxes in the 10-18erg s-1cm-2 regime, which is the deepest practical limit for ground based optical and near-infrared studies of field galaxies [36, 39, e.g.,]. Naturally, owing to the low and smooth background from space, the sensitivity of GLASS is more or less independent of wavelength except at the edges of the spectral coverage where the grisms throughput drop.
Assuming the spectral energy distribution of the sources to be approximately flat in over the G102 and G141 wavelength range we can estimate the continuum flux for each source as a function of wavelength from a weighted average of the CLASH F125W, F140W and F160W magnitudes. In combination with the limiting flux the continuum flux gives the limiting equivalent width for each of the 9 objects with suitable spectra. The rest-frame equivalent width limits at the fiducial redshift for each candidate are given in Table 1.
Given the intrinsic faintness of the candidates, the equivalent width limits are rather high and it is thus not surprising that we do not detect any Ly emission for this sample. Even at only of Lyman Break Galaxies would be expected to have emission larger than 100Å and thus be significantly detected in our exposures. However, the equivalent width limits are sufficient to rule out pure line emitters at lower redshift as contaminants [2].
VI. Conclusions
We have introduced GLASS, an HST Large Program devoted to the study of the high-redshift universe by means of deep grism spectroscopy. Using the first WFC3 pointing in the center of the rich cluster MACSJ0717.5+3745, we have demonstrated the power of grism spectroscopy even in very crowded fields. We have shown that by carefully modeling the background contamination one can obtain deep spectra of large numbers of sources at once, without the limitations due to preselection for inclusion in masks or wavelength gaps typical of ground based studies. In practice we have considerered two sets of faint targets and obtained the following results:
- 1.
We have confirmed 4 sets (3,4,12,14) of candidate strong gravitational lens systems by identifying the same emission lines in each of the multiple images. Redshift for one additional system (6.1) was obtained from ground based MOSFIRE spectroscopy. These 5 redshifts are close to the photometric redshift estimates used to construct the lens models provided by the Frontier Fields initiative. The confirmation of the strong lensing hypothesis and redshift thus provides additional validation of the models.
- 2.
We have compiled a list of 14 photometrically selected candidate galaxies at that fall in the GLASS field of view. No Ly emission is detected.
- 3.
We have used the spectra of the 9 candidates with no significant contamination from neighbouring objects to measure the line flux sensitivity of GLASS and found it to be 0.5-110-17erg s-1cm-2. This is consistent with the limits obtained in blank fields. The completeness and sensitivity are going to improve with the second set of visits, which will deliver the same exposure time with a dispersion direction that is approximately orthogonal to that of the data presented here.
Even with just a fraction of the total observing time allocated for GLASS, the observations illustrate the power of HST grism spectroscopy combined with strong gravitational lensing. The complete dataset will provide a treasure trove of spectroscopic information, which will be useful to many in addressing several outstanding scientific questions.
References
- [1] Atek, H., Malkan, M., McCarthy, P., et al. 2010, The Astrophysical Journal, 723, 104
- [2] Atek, H., Siana, B., Scarlata, C., et al. 2011, eprint arXiv, 1109, 639
- [3] Bennett, C. L., Larson, D., Weiland, J. L., et al. 2013, The Astrophysical Journal Supplement, 208, 20
- [4] Bertin, E., & Arnouts, S. 1996, Astronomy and Astrophysics Supplement, 117, 393
- [5] Bouwens, R. J., Illingworth, G. D., Oesch, P. A., et al. 2010, The Astrophysical Journal Letters, 709, L133
- [6] —. 2011, The Astrophysical Journal, 737, 90
- [7] —. 2012, The Astrophysical Journal, 754, 83, 33 pages, 24 figures, 7 tables, submitted to ApJ
- [8] Bradač, M., Vanzella, E., Hall, N., et al. 2012, ApJ, 755, L7
- [9] Bradley, L. D., Trenti, M., Oesch, P. A., et al. 2012, The Astrophysical Journal, 760, 108
- [10] Bradley, L. D., Zitrin, A., Coe, D., et al. 2013, eprint arXiv, 1308, 1692
- [11] Brammer, G. B., van Dokkum, P. G., Illingworth, G. D., et al. 2013, The Astrophysical Journal Letters, 765, L2
- [12] Brammer, G. B., van Dokkum, P. G., Franx, M., et al. 2012, The Astrophysical Journal Supplement, 200, 13
- [13] Capak, P. L., Faisst, A., Vieira, J. D., et al. 2013, eprint arXiv, 1307, 4089, accepted to ApJL, 5 Pages, 4 Figures, 1 Table
- [14] Caruana, J., Bunker, A. J., Wilkins, S. M., et al. 2013, eprint arXiv, 1311, 57, submitted to MNRAS
- [15] Coe, D., Zitrin, A., Carrasco, M., et al. 2013, The Astrophysical Journal, 762, 32
- [16] Dijkstra, M., Lidz, A., & Wyithe, J. S. B. 2007, MNRAS, 377, 1175
- [17] Ellis, R. S., McLure, R. J., Dunlop, J. S., et al. 2012, eprint arXiv, 1211, 6804
- [18] Finkelstein, S. L., Papovich, C., Dickinson, M., et al. 2013, eprint arXiv, 1310, 6031
- [19] Fontana, A., Vanzella, E., Pentericci, L., et al. 2010, The Astrophysical Journal Letters, 725, L205
- [20] Hinshaw, G., Larson, D., Komatsu, E., et al. 2013, The Astrophysical Journal Supplement, 208, 19
- [21] Jensen, H., Laursen, P., Mellema, G., et al. 2013, MNRAS, 428, 1366
- [22] Jones, T., Stark, D. P., & Ellis, R. S. 2012, ApJ, 751, 51
- [23] Koekemoer, A. M., Fruchter, A. S., Hook, R. N., & Hack, W. 2003, The 2002 HST Calibration Workshop : Hubble after the Installation of the ACS and the NICMOS Cooling System, 337
- [24] Kümmel, M., Kuntschner, H., Walsh, J. R., & Bushouse, H. 2011, ST-ECF Instrument Science Report WFC3-2011-01, 1
- [25] Limousin, M., Ebeling, H., Richard, J., et al. 2012, A&A, 544, A71
- [26] McLean, I. S., Steidel, C. C., Epps, H. W., et al. 2012, Ground-based and Airborne Instrumentation for Astronomy IV. Proceedings of the SPIE, 8446, doi:10.1117/12.924794
- [27] Medezinski, E., Umetsu, K., Nonino, M., et al. 2013, ApJ, 777, 43
- [28] Oesch, P. A., Bouwens, R. J., Illingworth, G. D., et al. 2013, The Astrophysical Journal, 773, 75, 21 pages, 13 figures, 6 tables; submitted to ApJ
- [29] Ono, Y., Ouchi, M., Mobasher, B., et al. 2012, The Astrophysical Journal, 744, 83
- [30] Pentericci, L., Fontana, A., Vanzella, E., et al. 2011, The Astrophysical Journal, 743, 132
- [31] Planck-Collaboration, Ade, P. A. R., Aghanim, N., et al. 2013, eprint arXiv, 1303, 5076
- [32] Postman, M., Coe, D., Benítez, N., et al. 2012, The Astrophysical Journal Supplement, 199, 25
- [33] Robertson, B. E., Furlanetto, S. R., Schneider, E., et al. 2013, eprint arXiv, 1301, 1228
- [34] Schenker, M. A., Stark, D. P., Ellis, R. S., et al. 2012, ApJ, 744, 179
- [35] Schmidt, K. B., Treu, T., Trenti, M., et al. 2014, submitted to ApJ
- [36] Stark, D. P., Ellis, R. S., & Ouchi, M. 2011, The Astrophysical Journal Letters, 728, L2
- [37] Taylor, J., & Lidz, A. 2013, MNRAS, arXiv:1308.6322
- [38] Trenti, M., Bradley, L. D., Stiavelli, M., et al. 2011, The Astrophysical Journal Letters, 727, L39
- [39] Treu, T., Schmidt, K. B., Trenti, M., Bradley, L. D., & Stiavelli, M. 2013, The Astrophysical Journal Letters, 775, L29
- [40] Treu, T., Trenti, M., Stiavelli, M., Auger, M. W., & Bradley, L. D. 2012, The Astrophysical Journal, 747, 27
- [41] Vanzella, E., Giavalisco, M., Dickinson, M., et al. 2009, The Astrophysical Journal, 695, 1163
- [42] Vanzella, E., Fontana, A., Zitrin, A., et al. 2013, eprint arXiv, 1312, 6299
- [43] Zitrin, A., Broadhurst, T., Rephaeli, Y., & Sadeh, S. 2009, ApJ, 707, L102