A network model of correlated growth of tissue stiffening in pulmonary fibrosis
Abstract
During the progression of pulmonary fibrosis, initially isolated regions of high stiffness form and grow in the lung tissue due to collagen deposition by fibroblast cells. We have previously shown that ongoing collagen deposition may not lead to significant increases in the bulk modulus of the lung until these local remodeled regions have become sufficiently numerous and extensive to percolate in a continuous path across the entire tissue [Bates et al. 2007 Am. J. Respir. Crit. Care Med. 176 617]. This model, however, did not include the possibility of spatially correlated deposition of collagen. In the present study, we investigate whether spatial correlations influence the bulk modulus in a two-dimensional elastic network model of lung tissue. Random collagen deposition at a single site is modeled by increasing the elastic constant of the spring at that site by a factor of 100. By contrast, correlated collagen deposition is represented by stiffening the springs encountered along a random walk starting from some initial spring, the rationale being that excess collagen deposition is more likely in the vicinity of an already stiff region. A combination of random and correlated deposition is modeled by performing random walks of length from randomly selected initial sites, the balance between the two processes being determined by . We found that the dependence of bulk modulus, , on both and the fraction of stiff springs, , can be described by a strikingly simple set of empirical equations. For , exhibits exponential growth from its initial value according to , where and . For intermediate concentrations of stiffening, , another exponential rule describes the bulk modulus as , where and are parameters that depend on . For , is linear in and independent of , such that , where . For small concentrations, the physiologically most relevant regime, the forces in the network springs are distributed according to a power law. When , the exponent of this power law increases from -4.5, when , and saturates to about -2, as increases above 40. These results suggest that the spatial correlation of collagen deposition in the fibrotic lung has a strong effect on the rate of lung function decline and on the mechanical environment in which the cells responsible for remodeling find themselves.
, ,
1 Introduction
Pulmonary fibrosis (PF) is a debilitating disease without cure that affects approximately 5 million people worldwide [1] and leads to the death of 40,000 people every year in the US alone [2]. Anti-inflammatory, antifibrotic, and immunosuppressive therapies have all been used in the treatment of PF, but unfortunately none have been shown to improve survival or quality of life [3, 4]. The only truly effective treatment for PF remains lung transplantation, but donor lungs are scarce, so being able to accurately predict the stage of the disease is critical for deciding how best to choose recipients for donor lungs among the many patients who could potentially benefit.
A key clinical indicator of PF severity is the increase it causes in the elastic stiffness of the lung, which is readily measured in patients [5]. However, we have shown that the progression of macroscopic lung stiffness may not always precisely track the microscopic progression of the underlying fibrotic disease [6, 7, 8, 9, 10], so understanding exactly how these two processes are linked is clearly of major importance for PF prognosis. Also, the progression of PF at the microscopic level influences the rate at which the local microenvironment of the tissue changes, which in turn could influence the rate of fibrotic remodeling by lung fibroblast cells. Understanding the nature of this progression may thus be crucial for the development of novel therapies.
Some cases of PF have a genetic basis, some result from known injuries to the lung tissue, and many are idiopathic [11]. Regardless of the cause, however, the evolution of PF is invariably accompanied by a progressive stiffening of the lung tissue that manifests clinically as a reduction in lung volume and an increase in the work of breathing. Microscopically, PF is inherently a remodeling process in which, at least initially, isolated local regions of the lung become fibrotic as collagen is deposited by the fibroblast cells. This increases regional tissue stiffness, but the effect on overall lung stiffness is more subtle. In particular, we have shown previously [6, 7, 8, 9, 10] that the total amount of collagen deposited in the lung during PF may be a poor indicator of abnormalities in global lung stiffness as fibrosis develops. More important is whether or not the stiffened tissue remains in isolated islands or becomes linked in continuous paths that span the entire tissue space. When such paths arise, at the percolation threshold [12, 13], the subsequent rate of increase in lung stiffness becomes dramatically enhanced as PF progresses, which represents the rapid approach of end-stage disease.
The point at which the percolation threshold is reached for a given collagen load is strongly influenced by the spatial pattern of the collagen deposition. The characteristic scarring patterns seen in PF indicate that this deposition does not manifest as a large number of lesions of all different sizes, but rather as a relatively small number of larger fibrotic patches (Figure 1). This would seem to indicate that fibrosis development in the lung is not random, but rather occurs with a significant degree of spatial correlation. One possible explanation for this spatial correlation is the existence of fixed sites of fibrogenesis that spawn radial growth of collagen deposition. Another possibility is that once collagen is deposited at a particular location, the local increase in stiffness that it engenders gives rise to a pro-fibrotic mechanical environment for the surrounding cells which themselves start to produce collagen in a positive feedback loop. Understanding the link between total collagen load and lung stiffness may thus provide a clue as to which of these two possibilities is more likely to pertain in PF.
In the present study, we build on our prior work on the percolation of random fibrotic lesions across the lung [6, 7, 8, 9, 10] to introduce a new elastic network model of the fibrotic lung that enables us to investigate how the evolution of lung tissue stiffness depends on the spatial correlation of fibrotic lesions as they develop over time. We use random placement of stiffened springs in the network to mimic the uncorrelated appearance of new fibrotic regions, and the stiffening of springs along a random walk [15] from some starting point to mimic the correlated local growth of fibrosis. Invoking both percolation and random walk simultaneously represents the intrinsic combination of both random and correlated depositions of collagen. The relative contributions of these two processes are controlled by specifying the length of the random walk. We show here that the length of the random walk significantly affects the spatial organization of fibrotic regions in the model, which in turn influences the evolution of overall model stiffness.

2 Model
Our model is a two-dimensional network of hexagonally arranged linear elastic springs, each spring representing an alveolar wall as seen in a thin slice of lung tissue. The outer borders of the network are held fixed such that each spring is pre-stressed to correspond to a given lung volume. The model is initialized to be homogeneous with all springs having identical unit stiffness. Local collagen deposition is modeled by stiffening individual springs by sequentially applying the following two growth rules:
- 1.
Rule 1 – Percolation: A spring is chosen at random and stiffened by a factor of 100 representing the initial deposition of collagen;
- 2.
Rule 2 – Random Walk: A spring is chosen at random from the neighbors of the spring stiffened in Rule 1. This spring is stiffened by a factor of 100, followed by the stiffening of a random neighbor, and so on. After springs have been visited along this random walk, the new equilibrium configuration of the network is determined. This random walk represents the local spreading of fibrosis.
This sequence of applying Rules 1 and 2 followed by finding the minimum energy configuration of the network is continued until all springs in the network have been stiffened.
Rule 1 is the same uncorrelated regular percolation that we introduced previously [6, 7, 8, 9, 10]. Rule 2 incorporates random springs from Rule 1 to seed the initial sites of spring stiffening, and for , the length of the random walk is zero. For , however, most of the spring stiffening in Rule 2 occurs along random walk trajectories starting from the initial seed locations. This gives rise to local clusters of stiffened springs that tend to have an irregular shape. Also, since a random walk is a Markovian process, a spring may be visited more than once in a given random walk, resulting in cluster sizes less than or equal to springs. Note that a spring’s stiffness is only allowed to increase once, regardless of how many times it has been visited.
The biological rationales motivating these rules are as follows. First, we chose to stiffen each spring by a factor of 100 because this eventually increases the local stiffness similar to what has been reported for fibrotic human lung tissue [16, 17]. Rule 1 assumes that fibrosis occurs purely by chance, and that its presence does not contribute to the fibrotic mechanism. Rule 2, on the other hand, assumes that the local presence of fibrosis has a significant influence on the occurrence of further fibrosis in the affected region. A possible mechanism for this influence is chemical; any mediators involved in fibrogenesis are likely to diffuse throughout the neighboring region and thus grow a fibrotic lesion outward from its starting point. However, the spread of fibrosis can also be due to mechanical mechanisms. For example, a stiff fibrotic patch is likely to increase the stress and strain experienced by neighboring normal tissue as lung volume cycles during breathing. If a fibroblast cell sitting in this neighboring tissue responds to this change in environment by depositing extra collagen as a defense mechanism against the extra strain, then a positive feedback mechanism will result that again could cause fibrosis to spread outward from the site of initiation. The value of in Rule 2 essentially controls the feedback gain.

At every step following the application of Rule 1 and Rule 2, we use a method based on simulated annealing [18] to determine the configuration of the network for which its total energy, , is minimized. The configuration of the network is defined by the positions of its nodes (the points where the springs interconnect). is given by the sum of the elastic energies in all the springs in the network, i.e.
| (1) |
where and are the extension and stiffness, respectively, of the spring. Starting from some initial configuration, we determine the equilibrium (energy minimizing) configuration in an iterative procedure as follows. At each step in the procedure, each non-fixed node is allowed to move by a small amount in the direction of the resultant force exerted on it by the three springs to which it is connected. This causes to change by a small amount . If is negative (i.e. energy is less in the new configuration) then the new configuration is accepted. If is positive then the new configuration is accepted with a small probability given by where is a control parameter. This occasional acceptance of increased energy configurations allows the system the chance to escape from local energy minima in search of the global minimum. We repeated this stochastic process until remained below for 20 consecutive iterations, at which point we considered the algorithm to have converged. We performed this energy minimization procedure only after the completion of each random walk, which assumes that any network configurations taking place during the walk did not influence the walk itself.
We simulated networks of nodes, as shown in Figure 2 which illustrates the influence of on the macroscopic appearance of the fibrotic regions. Each curve in this and the other figures presented below was obtained by first determining the bulk modulus for 30 independent network realizations for a given value of . Linear interpolation was then applied to each relationship to determine the value of the bulk modulus at a fixed set of equally spaced values of . Finally, the 30 interpolated relationships were ensemble averaged. Comparison of Figures 1 and 2 suggests that gives rise to more realistic scarring patterns than does .
3 Bulk Modulus
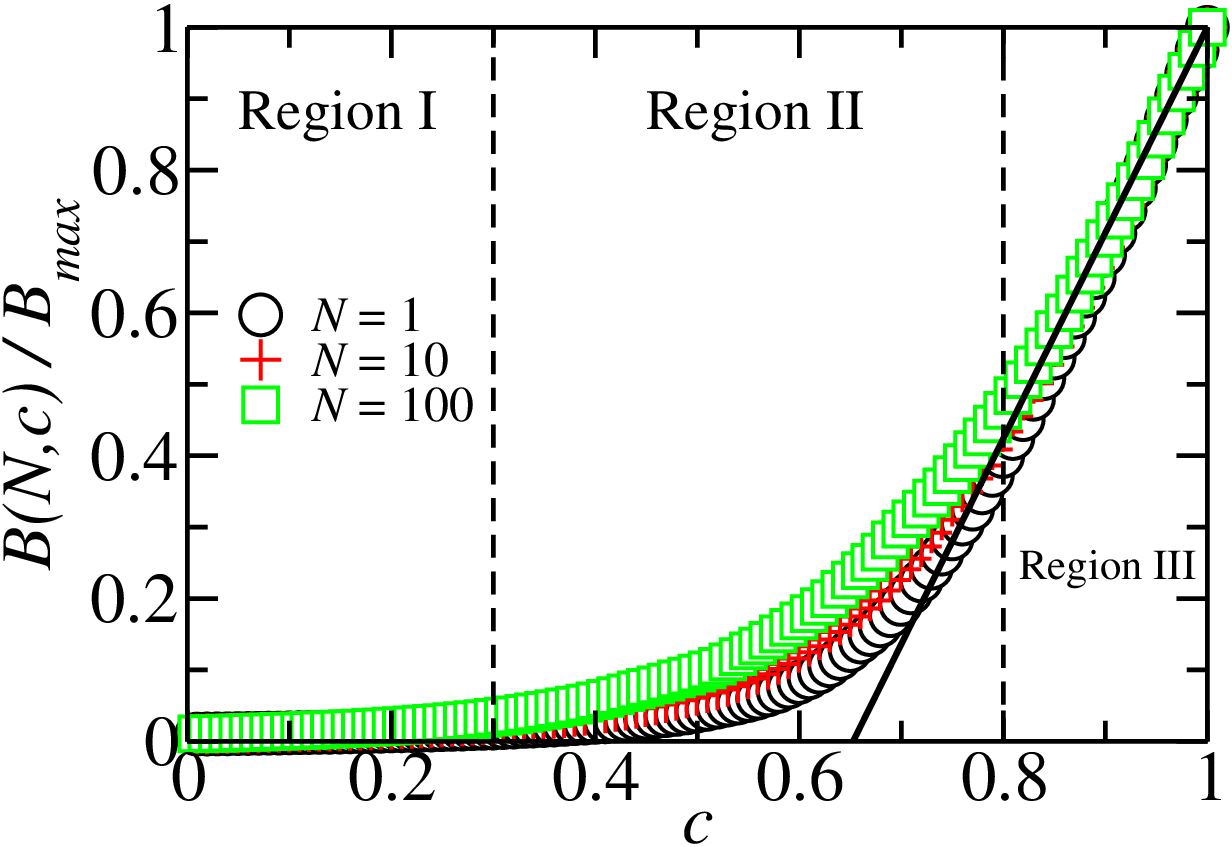
In order to quantify how spatial correlations in the growth of fibrotic regions affect the stiffness of the entire spring network, we calculated the two-dimensional averaged bulk modulus, , of the network as a function of the fraction, , of stiffened springs for different values of . The value of spans the range from 0 (completely healthy tissue) to 1 (entirely fibrotic tissue). For each realization, the bulk modulus was computed for each value of and by temporarily increasing the network boundaries in both directions by 0.001% and finding the stretched equilibrium configuration. The bulk modulus was then taken as the ratio of the change in stress11 1 Stress is defined here as the sum of perpendicular force, per unit length, in both direction in each spring. to the change in the area defined by the network boundaries following stretch. The bulk modulus is thus equivalent to the inverse of specific lung compliance used in physiological studies. Note that is determined using Rule 1 because only the initial seed spring is stiffened at each step in this rule, while for is determined using both Rule 1 and Rule 2. We also define as the minimum value of that pertains to the healthy network containing only soft springs, while is the maximum that occurs when all the springs have been stiffened. These two constants, and , apply only to fully homogeneous networks and, therefore, are independent on . Moreover, since we considered only Hookean springs, we have that . We find that segregates into three distinct regimes (see Figure 3); Region I corresponds to , Region II corresponds to , and Region III corresponds to . In Regions I and II, exhibits an exponential dependence on and also depends on . By contrast, in region III, exhibits a linear dependence on and is independent of . We chose these regions in such a way that we could provide simple empirical equations for each one of them. These relationships are then demonstrated in the following subsections.


3.1 Region I
For low concentrations of stiffened springs, when , starts from the initial minimum value at , regardless of , and increases exponentially according to the relationship
| (2) |
where and . We obtained this expression by fitting a power law to versus as shown in Figure 4(a). For , the logarithm in Equation 2 vanishes giving , which is described by (see Figure 4(b)).
Equation 2 shows that one can separate the influence of random percolation and random walk into two independent terms. That is, where is the percolation term and is the random walk term . This partitioning is possible because, when is small and stiffened springs are sparse, the probability that two fibrotic clusters will meet each other during growth is small. Interestingly, given that , the logarithmic term grows roughly with , the average diameter of the area covered by the random walk.
If we replace in Equation 2 with its expression derived from Figure 4(b), which shows that , and replace and by their approximated values 1 and 0.5, respectively, then Equation 2 becomes
| (3) |
Notice that for one obtains , as expected.


3.2 Region II
Above , changes its dependence on to a different exponential relationship. The new behavior starts at a value of that varies inversely with (see solid lines in Figure 5(a)), such that for , 10, and 100, these new exponential regimes begin at , 0.41 and 0.34, respectively, and these relations hold up to . For these exponential relations can be expressed as
| (4) |
where and decrease monotonically with as shown in Figure 5(b). The multiplicative constant 0.04 in Equation 4 arises because occurs approximately when , regardless of . Note that Equation 4 cannot be partitioned into two independent terms, such as and in the case of Region I. The reason is that in Region II, the fibrosis is extensive enough that fibrotic clusters have a high likelihood of intersecting and this produces a nonlinear coupling between percolation and random walk in the growth equation.
3.3 Region III
When exceeds 0.8, converges toward a single relationship with for all values of (Figure 3). This relationship is
| (5) |
where . Intriguingly, is approximately the location of the percolation threshold for a 2D hexagonal networks [19]. The behavior of in Region III may have less clinical relevance than that in Regions I and II because patients might not be able to survive into Region III. Nevertheless, our goal here is to understand the behavior of over its entire operating range.
4 Distribution of spring forces in the network
Next, we analyze the distribution of spring forces within the network. Figure 6(a) shows histograms of force for and 100, and for , 0.65 and 0.8. The figure also indicates with a dotted and dashed vertical line the single value of spring force in the homogeneous networks when and , respectively.
When , the force distribution follows a power law with an exponent that increases from -4.36 at toward a plateau of about -2 for , as shown in Figure 6(b). Hence, for large the force distribution develops an extended tail that leads to some regions of the network bearing more force than occurs even when the network is fully fibrotic (i.e., ). These high force regions correspond to single stiff springs that connect between clusters of fibrotic regions, similarly to the red bonds in regular percolation [12].


As increases, however, loses importance in determining how the force is distributed, as shown in Figure 6(a), and as also occurred with (Region III of Figure 3). Additionally, for , a Gaussian-like peak emerges in the force distributions to the right of the power law decay, as shown in Figure 6(a). Thus, the spring force distribution can be seen to progress through a series of stages as fibrosis develops in the network. Beginning with the single spring force of the healthy network, Region I is accompanied by a progressively flattening power law force distribution. In Region II the power law distribution starts to give way to a broad rightward peak. Eventually, in Region III, this peak narrows to converge on the single spring force of the fully fibrotic network.
5 Relevance and limitations of the model
The model of PF we have examined here is obviously based on an extremely simple representation of real lung tissue, so we must view our results accordingly. What these simplifications probably mean is that although the some of the general aspects of our results may pertain to reality, the details may not. Thus, for example, it is reasonable to think that the nonlinear relationship we found between the stiffening of springs and changes in (Figure 3) is likely to be mirrored in a nonlinear link between the development of PF and clinical symptoms. Similarly, the finding of three distinct regimes in mechanical behavior (our Regions I, II and III) may also find analogs in reality because these regions are defined by whether or not developing clusters of fibrosis start to encroach on the same regions of tissue, a rather general phenomenon. We would thus expect that at low fibrotic densities we would still find in an actual lung that the effects of seeding density and cluster size are separable in the manner of Equation 2. On the other hand, precisely where Regions I, II and III occur relative to the progression of PF, or exactly what their respective force distributions look like, are details that probably differ between our model and a real fibrotic lung.
A better representation of reality could be achieved by certain modifications to the model. For example, our network model is 2-dimensional whereas lung tissue is a 3-dimensional system in which alveolar walls are more properly considered as elastic membranes rather than line elements. Extending our analysis to 3-dimensions is possible, in principle, and might prove useful for future investigations as high-resolution 3-dimensional images of PF progression become available. Indeed, we have previously used a 3-dimensional network model to investigate how the alveolar architecture structure is destroyed in emphysema [20].
Another simplification in our model is the assumption that alveolar wall elements act as Hookean springs. This assumption of purely elastic behavior is a simplification given that real tissue is viscoelastic, although the long time scales over which PF develops probably mean that the elastic assumption is adequate. The assumption that the elasticity is linear is more questionable, given that lung tissue exhibits marked strain stiffening. Our model thus represents a low strain view “zeroth”-order approach of lung stiffness. Extending the model to include nonlinear stress-strain behavior in the spring elements would probably not affect our overall conclusions, but would certainly affect the details of predicted force distributions [21].
Finally, we simplified the process of fibrogenesis by increasing spring constants by a single factor of 100, thereby creating a binary stiffness map across the network, whereas it has been shown recently [16] that the distribution of local stiffness in the fibrotic lung is wide. While likely affecting the predicted distributions of forces within the network, this assumption was made in the interest of creating a simple model capable of yielding appropriate qualitative behavior that can be readily interpreted in terms of the interactions among its constituents.
6 Conclusions
In this study, we used a simple spring network model of the lung parenchyma to investigate how lung stiffness grows as a function of the degree to which the deposition of collagen is spatially correlated during the progression of PF. We simulated the progression of fibrosis in terms of two simple growth rules, percolation and random walk, with the degree of spatial correlation of collagen deposition being determined by the length of the random walk. Surprisingly, we found that the bulk stiffness of the elastic network as a function of the amount of collagen deposition could be described by a set of three simple empirical equations (Equations 2, 4 and 5), demonstrating an underlying simplicity to the way in which percolation and random walk affect overall system behavior.
With respect to the relation between percolation and random walk, we note the following. Creating clusters around randomly selected points should not change the universality class of critical properties, since, for infinite systems, the size of such clusters can always be reduced to single points. However, we aimed at investigating the bulk modulus behavior when stiff clusters emerge and grow until they fill the entire network, rather than focusing only on the critical behavior at the percolation threshold. Moreover, bulk modulus, far away from the criticality, depends not only on the concentration of stiff springs but is also highly dependent on how clusters of stiff springs spread through the network. Therefore, our results cannot be predicted by finite-size scaling analysis alone.
Finally, we speculate that the random walk rule may represent the homeostatic response of collagen producing cells to changes in local stiffness as a result of the stiffening of nearby regions of tissue. We also found that when is small, longer random walks lead to greater heterogeneity in force distribution throughout the network characterized by power laws. Small values of are probably the most physiologically relevant because they represent the early to moderates stage of fibrotic disease where patients might be expected to survive. These results thus suggest the possibility that fibrotic remodeling in the lung develops in part as the result of positive feedback between collagen deposition and its consequent effects on the local mechanical micro environment in the lung.
References
References
- [1] Meltzer E B and Noble P W 2008 Orphanet J. Rare Dis. 3 8
- [2] http://www.pulmonaryfibrosis.org/Prevalence, accessed on November 20 2013
- [3] Raghu G, Brown K K, Bradford W Z, Starko K, Noble P W, Schwartz D A and King T E Jr 2004 N. Engl. J. Med. 350 125
- [4] Egan J J 1999 Lancet 354 1839
- [5] Martinez F J, Safrin S, Weycker D, Starko K M, Bradford W Z, King T E Jr., Flaherty K R, Schwartz D A, Noble P W, Raghu G, and Brown K K 2005 Ann. Intern. Med. 142 963
- [6] Bates J H T, Davis G S, Majumdar A, Butnor K J and Suki B 2007 Am. J. Respir. Crit. Care Med. 176 617
- [7] Suki B, Majumdar A, Nugent M A and Bates J H T 2007 Drug Discovery Today: Disease Models 4 139
- [8] Suki B and Bates J H T 2008 Respir. Physiol. & Neurobiol. 163 33
- [9] Suki B and Bates J H T 2011 J. Appl. Physiol. 110 1111
- [10] Cavalcante F S A, Ito S, Brewer K, Sakai H, Alencar A M, Almeida M P, Andrade J S, Majumdar A, Ingenito E P and Suki B 2005 J. Appl. Physiol. 98 672
- [11] Levitzky M G 1995 Pulmonary Physiology - Fourth Edition (New York: McGraw-Hill)
- [12] Stauffer D and Aharony A 1992 Introduction to Percolation Theory (Taylor & Francis)
- [13] Andrade J S, Herrmann H J, Moreira A A and Oliveira C L N 2011 Phys. Rev. E 83 031133
- [14] Hoyle G W, Li J, Finkelstein J B, Eisenberg T, Liu J-Y, Lasky J A, Athas G, Morris G F and Brody A R 1999 Am. J. Pathol. 154 1763
- [15] ben-Avraham D and Havlin S 2000 Diffusion and Reactions in Fractals and Disordered Systems (Cambridge University Press)
- [16] Liu F and Tschumperlin D J 2011 J. Vis. Exp. 54 e2911
- [17] Discher D E, Janmey P and Wang Y L 2005 Science 310 1139
- [18] Kirkpatrick S, Gelatt C D and Vecchi M P 1983 Science 220 671
- [19] Sykes M F and Essam J W 1964 J. Math. Phys. 5 1117
- [20] Parameswaran H, Majumdar A and Suki B 2011 PLoS Comp. Biol. 7 e1001125
- [21] Ito S, Bartolak-Suki E, Shipley J M, Parameswaran H, Majumdar A and Suki B 2006 Am. J. Respir. Cell Mol. Biol. 34 688