Multiwavelength observations of the -ray emitting narrow-line Seyfert 1 PMN J09480022 in 2011
Abstract
We report on radio-to--ray observations during 2011 May–September of PMN J09480022, the first narrow-line Seyfert 1 (NLSy1) galaxy detected in -rays by Fermi-LAT. Strong variability was observed in -rays, with two flaring periods peaking on 2011 June 20 and July 28. The variability observed in optical and near-infrared seems to have no counterpart in -rays. This different behaviour could be related to a bending and inhomogeneous jet or a turbulent extreme multi-cell scenario. The radio spectra showed a variability pattern typical of relativistic jets.
The XMM spectrum shows that the emission from the jet dominates above 2 keV, while a soft X-ray excess is evident in the low-energy part of the X-ray spectrum. Models where the soft emission is partly produced by blurred reflection or Comptonisation of the thermal disc emission provide good fits to the data. The X-ray spectral slope is similar to that found in radio-quiet NLSy1, suggesting that a standard accretion disc is present, as expected from the high accretion rate. Except for the soft X-ray excess, unusual in jet-dominated AGNs, PMN J09480022 shows all characteristics of the blazar class.
Keywords:
galaxies: active – galaxies: nuclei – galaxies: Seyfert – galaxies: individual (PMN J09480022) – gamma-rays: general1 Introduction
Narrow-line Seyfert 1 (NLSy1) galaxies, first suggested as a distinct class of active galactic nuclei (AGNs) by Osterbrock & Pogge (1985), are characterized in optical by their narrow permitted emission lines (full-width at half maximum FWHM 2000 km s-1), weak [OIII]5007 emission line ([OIII]/H 3), and strong Fe ii emission lines. They also exhibit strong X-ray variability, steep X-ray spectra, substantial soft X-ray excess and relatively high luminosity (Boller et al., 1996; Zhou et al., 2006). These characteristics suggest that NLSy1s have smaller masses of the central black hole (MBH = 106–108 M⊙) and higher values (up to the Eddington limit or above) than those observed in blazars and radio galaxies. Only a small percentage (7%) of NLSy1 are radio-loud (Komossa et al., 2006) compared to 15% of the quasars. In the radio-loud NLSy1s, flat radio spectra and flux density variability suggest that several of them could host relativistic jets (Zhou et al., 2003; Doi et al., 2006; Yuan et al., 2008).
PMN J09480022 shows optical properties typical of a NLSy1 (i.e. FWHM(H) = 143287 km s-1, [OIII]/H0.1, a strong Fe ii bump), and a radio loudness of = 355 (Yuan et al., 2008). High brightness temperature and a compact structure have been observed for PMN J0948+0022 (Doi et al., 2006), in addition to a possible core-jet structure (Giroletti et al., 2011). This source was the first radio-loud NLSy1 to be detected in rays by the Large Area Telescope (LAT) on board the Fermi Gamma-ray Space Telescope (Abdo et al., 2009a). After that, other 4 radio-loud NLSy1s were detected with high significance in rays (Abdo et al., 2009b; D’Ammando et al., 2012a), suggesting the radio-loud NLSy1s as a third class of -ray emitting AGN with relativistic jets. On the contrary, no radio-quiet Seyfert galaxies have been detected in rays (Ackermann et al., 2012). Three -ray flares were observed from PMN J09480022 during 2010–2013, reaching daily peak fluxes of (1-2)10-6 photons cm-2 s-1 (Foschini et al., 2011; D’Ammando & Ciprini, 2011; D’Ammando & Orienti, 2013). This indicates that radio-loud NLSy1s also can host powerful relativistic jets such as blazars. These findings pose intriguing questions about the nature of these -ray emitting NLSy1s, the onset of production of their relativistic jets, and the cosmological evolution of radio-loud AGNs.
After the discovery of -ray emission from PMN J09480022, this source has been the target of different multifrequency campaigns with the aim of understanding its nature. The first spectral energy distributions (SEDs) collected for this object, as well as for the other three -ray NLSy1s detected in the first year of Fermi operation, showed clear similarities with blazars: a double-humped shape with a first peak in the IR/optical band due to synchrotron emission, a second peak in the MeV/GeV band likely due to inverse Compton emission, and an accretion disk component in UV. The physical parameters of these NLSy1s are blazar-like, and jet powers are in the average range of blazars (Abdo et al., 2009b). In addition, the comparison of the SED of PMN J09480022 during the 2010 July flaring activity with that of 3C 273, a typical flat spectrum radio quasar (FSRQ), showed a more extreme Compton dominance in the NLSy1. The disagreement between the two SEDs can be due to the difference in black hole (BH) masses and Doppler factor of the two jets (Foschini et al., 2011). The radio-to--ray light curves of the source collected over years showed correlated variability, with a delay of a few months of the radio emission with respect to the -ray, as usually observed in FSRQs (Abdo et al., 2009c; Foschini et al., 2012).
In this paper, we discuss the results of the analysis of the multiwavelength data of PMN J09480022 collected during 2011 May–September. Part of the data presented here has been already published in Foschini et al. (2012). XMM-Newton and Catalina Real-time Transient Survey data are presented here for the first time. Fermi–LAT, Swift, and MOJAVE data are re-analyzed. The paper is organized as follows. In Section 2, we report the LAT data analysis and results, while in Sections 3 and 4 we present the X-ray and optical/UV results of the Swift and XMM-Newton observations, respectively. Near-infrared (NIR) and optical data from ground-based observatories are presented and discussed in Section 5. Radio data collected by the Very Long Baseline Array (VLBA) interferometer, the 40 m Owens Valley Radio Observatory (OVRO), the 32 m Medicina, the 13.7 m Metsähovi, and 100 m Effelsberg single-dish telescopes are presented and discussed in Section 6. In Section 7, we discuss the properties of the source and draw our conclusions.
Throughout the paper the quoted uncertainties are given at the 1 level, unless otherwise stated, and the photon indices are parameterized as , where is the photon index. We adopt a cold dark matter (–CDM) cosmology with = 71 km s-1 Mpc-1, , and . The corresponding luminosity distance at is d Mpc, and 1 arcsec corresponds to a projected size of 6.590 kpc.
2 Fermi-LAT data: analysis and results
2.1 Observations and data reduction
The Fermi-LAT is a pair-conversion telescope operating from 20 MeV to 300 GeV. It has a large peak effective area (8000 cm2 for 1 GeV photons), an energy resolution of typically 10%, and a field of view of about 2.4 sr with an angular resolution (68% containment radius) better than 1∘ for energies above 1 GeV. Further details about the Fermi-LAT are given in Atwood et al. (2009).

The LAT data reported in this paper were collected from 2011 May 1 (MJD 55682)
to September 30 (MJD 55834). During this time, the Fermi spacecraft
operated almost entirely in survey mode. The analysis was performed with the
ScienceTools software package version v9r27p1. The LAT data
were extracted within a region of radius centred at the
location of PMN J09480022. Only events belonging to the ‘Source’ class were
used. The time intervals when the rocking angle of the LAT was greater than
52∘ were rejected. In addition, a cut on the
zenith angle () was applied to reduce contamination from
the Earth limb rays, which are produced by cosmic rays interacting with the upper atmosphere.
The spectral analysis was performed with the instrument response functions
P7SOURCE_V6 using an unbinned maximum-likelihood method implemented
in the Science tool gtlike. A Galactic diffuse emission model and isotropic component, which is the sum of
an extragalactic and residual cosmic-ray background, were used to model the background11
1
http://fermi.gsfc.nasa.gov/ssc/data/access/lat/Background
Models.html. The normalizations of both components in the background model were allowed to vary freely during the spectral fitting.
We analysed a region of interest of radius centred at the location of PMN J09480022. We evaluated the significance of the -ray signal from the sources by means of a maximum-likelihood test statistic = 2 ( – ), where is the likelihood of the data given the model with () or without () a point source at the position of PMN J09480022 (Mattox et al., 1996). Following the second Fermi LAT source catalogue (Nolan et al., 2012, 2FGL;), the spectral model used for PMN J09480022 is a log-parabola, (Landau et al., 1986; Massaro et al., 2004), where the parameter is the spectral slope at the energy and the parameter measures the curvature around the peak. We fixed the reference energy to 272 MeV as in the 2FGL catalogue. The source model used in gtlike includes all of the point sources from the 2FGL catalogue that fall within of PMN J09480022. The spectra of these sources were parametrized by power law functions, , except for 2FGL J0909.10121, for which we used a log-parabola as in the 2FGL catalogue. A first maximum-likelihood analysis was performed to remove from the model the sources having 25 and/or a predicted number of counts based on the fitted model . A second maximum-likelihood analsyis was performed on the updated source model. The fitting procedure has been performed with the sources within 10∘ of PMN J09480022 included with the normalization factors and the photon indices left as free parameters. For the sources located between 10∘ and 15∘ from our target, we kept the normalizations and the photon indices fixed to the values of the 2FGL catalogue.
2.2 Results
Integrating over the period 2011 May 1–September 30 (MJD 55682–55835) the fit yielded a = 674 in the 0.1–100 GeV energy range, with an average integral flux of (21.6 1.5) 10-8 ph cm-2 s-1, a spectral slope = 2.41 0.10, and a curvature parameter around the peak = 0.20 0.06. The corresponding apparent isotropic -ray luminosity is 1.81047 erg s-1. As a comparison during the first two years of Fermi operation (2008 August 4–2010 August 4) the average integral flux was (9.2 0.5) 10-8 ph cm-2 s-1, with a spectral slope = 2.26 0.08, and a curvature parameter around the peak = 0.26 0.06 (Nolan et al., 2012). Thus the average 0.1–100 GeV flux over 2011 May–September is about a factor of 2 higher than the 2FGL flux, but no significant spectral changes were observed.
Fig. 1 shows the -ray light curve for the period considered, using a log-parabola spectral model and 7-day time bins. For each time bin, the spectral parameters of PMN J09480022 and all sources within 10∘ of it were frozen to have the parameter values resulting from the likelihood analysis over the entire period. For the highest significance periods, we also reported as open circles the fluxes in 1-day time intervals. If 10, 2 upper limits were calculated. All uncertainties in measured -ray flux and index reported throughout the paper are statistical only. The systematic uncertainty in the effective area is energy dependent: it amounts to at 100 MeV, decreasing to at 560 MeV, and increasing to above 10 GeV (Ackermann et al., 2012).
A daily peak flux of (101 20) 10-8 ph cm-2 s-1 in the 0.1–100 GeV energy range was detected on 2011 June 20 (MJD 55732), representing an increase of a factor of 5 with respect to the 2011 May–September average flux and more than an order of magnitude above the average 2FGL flux of the source. The corresponding apparent isotropic -ray luminosity is 8.81047 erg s-1. Preliminary results about this -ray flaring activity were reported by D’Ammando & Ciprini (2011) and Lucarelli et al. (2011). A second -ray flaring activity was observed at the end of 2011 July, peaking on July 28 (MJD 55770) with a flux of (87 25) 10-8 ph cm-2 s-1 in the 0.1–100 GeV energy range. By means of the gtsrcprob tool, we estimated that the highest energy photon emitted from PMN J09480022 (with probability 80% of being associated with the source) was observed on 2011 September 13 (MJD 55807), at a distance of 0.09∘ from the source and with an energy of 3.2 GeV. This suggests that this NLSy1 emits mainly at E 10 GeV, even during flaring activity (Foschini et al., 2011, see e.g.,).
| Date | Date | Net exposure time | Photon index | Flux 0.3–10 keVa |
|---|---|---|---|---|
| (UT) | (MJD) | (sec) | () | (10-12 erg cm-2 s-1) |
| 2011-Apr-29 | 55680 | 1978 | ||
| 2011-May-15 | 55696 | 4657 | ||
| 2011-May-28 | 55709 | 3629 | ||
| 2011-June-04 | 55716 | 2020 | ||
| 2011-June-14 | 54726 | 5160 | ||
| 2011-July-02 | 54744 | 2008 |
aUnabsorbed flux
3 Swift Data: Analysis and Results
The Swift satellite (Gehrels et al., 2004) performed six observations of PMN J09480022 between 2011 April 29 and July 2. The observations were performed with all three on board instruments: the Burst Alert Telescope (BAT; Barthelmy et al., 2005, 15–150 keV), the X-ray Telescope (XRT; Burrows et al., 2005, 0.2–10.0 keV), and the Ultraviolet/Optical Telescope (UVOT; Roming et al., 2005, 170–600 nm). The hard X-ray flux of this source is below the sensitivity of the BAT instrument for the short exposures of these observations and therefore the data from this instrument were not used. Moreover, the source is not present in the Swift-BAT 70-month hard X-ray catalogue (Baumgartner et al., 2013).
3.1 Swift-XRT
The XRT data were processed with standard procedures (xrtpipeline v0.12.6), filtering, and screening criteria by using the HEASoft package (v6.12). The data were collected in photon counting mode for all of the observations. The source count rate was low ( 0.5 counts s-1); thus pile-up correction was not required. Source events were extracted from a circular region with a radius of 20 pixels (1 pixel 2.36 arcsec), while background events were extracted from a circular region with radius of 50 pixels away from the source region or other bright sources. Ancillary response files were generated with xrtmkarf and account for different extraction regions, vignetting and point spread function corrections. We used the spectral redistribution matrices in the Calibration data base maintained by HEASARC. When the number of photons collected was too low ( 200 counts), the spectra were rebinned with a minimum of 1 count per bin and the Cash statistic (Cash, 1979) was used. Since the effective area of Swift-XRT is a factor of 10 lower than that of the XMM-Newton EPIC cameras, detailed spectral modeling was not performed with the XRT observations. The spectrum was fitted with an absorbed power law using the photoelectric absorption model TBABS (Wilms et al., 2000), with a neutral hydrogen column density fixed to its Galactic value (Kalberla et al., 2005, 5.071020 cm-2;). The fit results are reported in Table 1. The relatively harder X-ray spectrum observed for PMN J09480022 with respect to the other NLSy1s (Grupe et al., 2010; Zhou & Zhang, 2010, e.g.,) could be due to the contribution of inverse Compton radiation from a relativistic jet, similarly to what is found in FSRQs. A photon index 1.4–1.5 was observed in X-rays also for another -ray NLSy1, SBS 0846513 (D’Ammando et al., 2012a; D’Ammando et al., 2013b).
3.2 Swift-UVOT
During the Swift pointings the UVOT instrument observed PMN J09480022 in its optical (, , and ) and UV (, , and ) photometric bands. The data analysis was performed using the uvotsource task included in the HEASoft package (v6.12). Source counts were extracted from a circular region of 5 arcsec radius centred on the source, while background counts were derived from a circular region of 10 arcsec radius in the source neighbourhood. We calculated the effective wavelengths, count rate to flux conversion factors, and Galactic extinctions for the UVOT bands according to the procedure explained in Raiteri et al. (2010); Raiteri et al. (2011) and D’Ammando et al. (2012a). The observed magnitudes are reported in Table 2, and flux densities for the , , and filters are shown in Fig. 7. The optical -band magnitude ranged from 17.67 to 17.11, with the peak detected on 2011 June 4 (MJD 55716). No significant variability was observed in UV, but we noted that no UV observations were available during the optical peak in -band.
| Date (UT) | Date (MJD) | ||||||
|---|---|---|---|---|---|---|---|
| 2011-Apr-29 | 55680 | – | – | 17.270.03 | – | – | – |
| 2011-May-15 | 55696 | 18.200.13 | 18.430.08 | 17.670.07 | 17.460.05 | 17.440.06 | 17.460.04 |
| 2011-May-28 | 55709 | 18.050.15 | 18.310.09 | 17.480.07 | 17.310.05 | 17.350.06 | 17.330.04 |
| 2011-June-04 | 55716 | – | – | 17.110.03 | – | – | – |
| 2011-June-14 | 55726 | 17.860.11 | 18.310.08 | 17.340.06 | 17.340.05 | 17.350.05 | 17.290.04 |
| 2011-July-02 | 55744 | – | – | 17.640.30 | – | – | – |
4 XMM-Newton data: analysis and results
4.1 Observations and data reduction
XMM-Newton (Jansen et al., 2001) observed PMN J0948+0022 on 2011 May 28-29 (MJD 55709–55710) for a total duration of 93 ks (observation ID 067370101, PI: D’Ammando). A simultaneous observation was performed by Swift on 2011 May 28.
The EPIC pn was operated in the large window mode and the EPIC MOS cameras (MOS1 and MOS2) were operated in the prime partial mode. The data were reduced using the XMM-Newton Science Analysis System (SAS v11.0.0), applying standard event selection and filtering. Inspection of the background light curves showed that strong flaring was present during the whole observation. The flaring time intervals were removed for the spectral analysis, leaving good exposure times of 36, 58 and 60 ks for the pn, MOS1 and MOS2, respectively. For each of the detectors the source spectrum was extracted from a circular region of radius 34 arcsec centred on the source, and the background spectrum from a nearby region on the same chip. All the spectra were binned to contain at least 20 counts per bin to allow for spectral fitting.
The Optical Monitor (OM) and Reflection Grating Spectrometers (RGS1 and RGS2) were also operating during the observation. No spectral lines were detected in the RGS spectra. This could be because the signal was rather low. The RGS data are not discussed further in this work. The data from the OM are discussed in Sect. 4.4.
4.2 X-ray spectral analysis
All spectral fits were performed over the 0.3-10 keV energy range using XSPEC v.12.7.1. The energies of spectral features are quoted for the rest frame of the source while plots are in the observed frame, unless otherwise stated. All errors are quoted for 90% confidence for one interesting parameter (). The data from the three EPIC cameras were initially fitted separately, but since good agreement was found () we proceeded to fit them together. As for the Swift spectra, Galactic absorption was included in all fits using the TBABS model. The results of all the fits are presented in Table 3. It is clear that a simple power law model was insufficient to describe the data, while a broken power law yielded an acceptable fit (the improvement between the models is for two additional free parameters). The broken power law has a break at observed energy keV, with photon indices below and above the break of and , respectively. In order to check for intrinsic absorption, a neutral absorber at the redshift of the source was added to this model, but it was found not to be required. The power law slope above the break energy is significantly harder than those observed in radio-quiet NLSy1s (Grupe et al., 2010; Zhou & Zhang, 2010, e.g.,), but similar to the slopes found in FSRQs (Donato et al., 2001, e.g.,). As already noted based on the Swift-XRT observations above, this makes highly probable that the emission from the jet dominates the X-ray spectrum at these energies. This conclusion is further supported by the fact that there was no detection of an Fe line in the spectrum. The 90% upper limit on the equivalent width (EW) of a narrow emission line at 6.4 keV is EW eV, or EW eV if the energy is allowed to vary between 6.4 and 7 keV.
On the other hand, the steeper slope found at low energies may be associated with the corona and the accretion disc of the system. In radio-quiet NLSy1s, the low-energy part of the spectrum is composed of a steep power law, originating in the corona, as well as a strong so-called soft excess, the origin of which is debated. Fig. 2 shows the spectrum of PMN J09480022 as a ratio to the power law with , which fits the spectrum above the break energy, illustrating the strength of the soft component in this source.
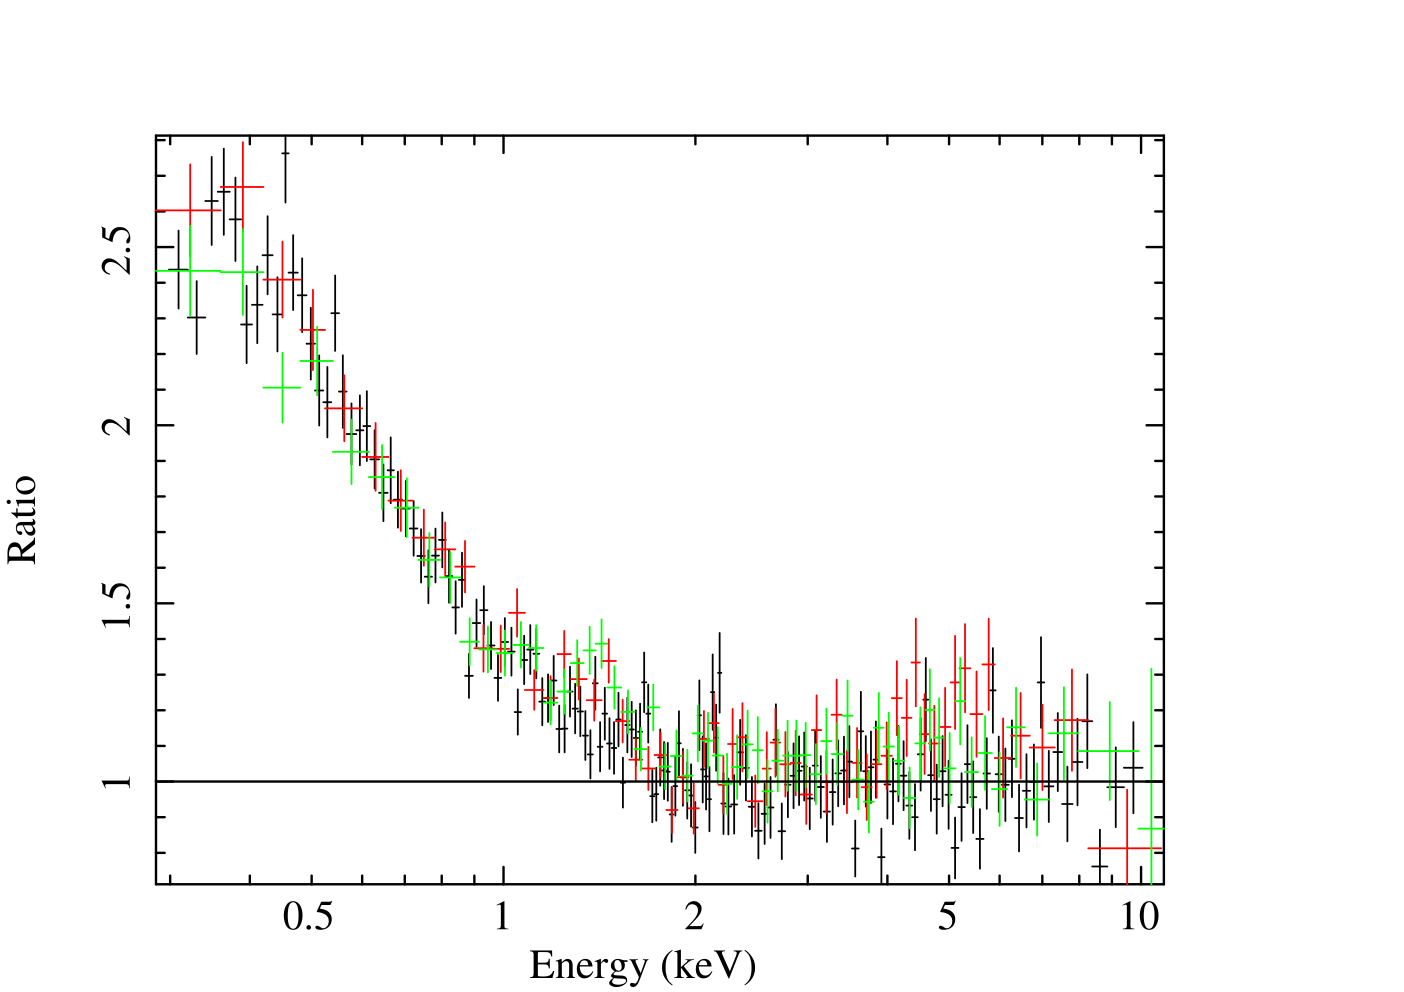


The soft component can be fitted with a blackbody model with kT keV, which is within the typical range of temperatures for the soft excess (Gierlínski & Done, 2004). However, it is well known that such a high temperature is inconsistent with standard accretion disc theory, which predicts that the thermal emission from the disc around a super-massive BH should peak in the ultraviolet band. Indeed, from the SED of the source (Foschini et al., 2011; Foschini et al., 2012, see e.g.,) the observed emission from the accretion disc seems to peak at 20 eV, corresponding to a disc temperature of 11 eV in the rest frame of the source.
The soft X-ray emission may instead be due to Comptonisation of the disc emission by a population of electrons with low temperature and large optical depth, which may exist in a transition region between the disc and the corona (Done et al., 2012). To investigate this model we proceeded to fit the spectrum with a power law and a Comptonised blackbody, using the COMPTT model (Titarchuk, 1994) and fixing the seed temperature at 11 eV. As seen in Table 3 and the left panel of Fig. 3, this model provides a good fit to the spectrum, with best-fit electron temperature keV and optical depth . We note that allowing a higher seed temperature of 20 eV changes only the normalisation of the Comptonised component, without significantly affecting any of the other best fit values presented in Table 3. The photon index of the power law in this model is = 1.440.03. In principle the model should also contain a second power law to account for any emission from the corona, but such a component was not required in the fits.
An alternative explanation for the soft excess is that it is due to relativistically blurred reflection from the accretion disc. Such a model can explain the fact that the energy of the soft excess is observed to be fairly constant for black holes spanning several orders of magnitude in mass (Gierlínski & Done, 2004; Bianchi et al., 2009), and has been successfully applied for a large number of sources (Crummy et al., 2006). In this picture the X-ray spectrum of PMN J09480022 would be composed of a steep power law associated with the corona, a reflection component resulting from irradiation of the disc by this power law, as well as a hard power law associated with the jet, dominating at high energies. The large number of parameters in such a model are impossible to constrain with the available data, especially given that there is no Fe line or Compton hump for the reflection model to anchor to. To set some constraints on such a scenario we constructed a model made of two power laws (with the photon indices constrained to be steeper and flatter than 2, for the corona and jet, respectively) together with a relativistically blurred reflection component with parameters fixed at ‘standard’ values. The reflection was modelled with KDBLUR acting on the REFLIONX model by Ross & Fabian (2005), with the photon index of the illuminating power law tied to the steep power law. The inner and outer radii of the disc were fixed at 6 gravitational radii () and 400 , respectively. Solar abundances were assumed and the emissivity index was fixed at (i.e. assuming a standard emissivity profile of from a central point source). The inclination was fixed at , which is the angle of the jet inferred by Foschini et al. (2011). The disc may not be exactly perpendicular to the jet, but we note that allowing a larger value, i.e. up to around , did not change the results. After optimisation the ionisation state of the disc was fixed at . As seen in Table 3 this model results in a fit of quality comparable to the Comptonised blackbody. However, it should be noted that it is the steep power law and not the reflection component that provides most of the flux at low energies, as seen in Fig. 3, which shows the model components. In fact, a fit with two power laws but no reflection is only marginally worse ( = 6 for one more degree of freedom, see Table 3). Allowing each of the parameters of the reflection model to vary did not significantly change these results.

| Model | Parameter | Value |
| power law | ||
| Norm | ||
| 2342/1254 | ||
| Broken power law | ||
| (keV) | ||
| Norm | ||
| 1373/1252 | ||
| power law + | ||
| PL Norm | ||
| compTT | (keV) | |
| (keV) | ||
| Comp Norm | ||
| 1329/1251 | ||
| power law (jet) + | ||
| PL | ||
| power law (corona) + | ||
| PL | ||
| Blurred reflection | q | |
| incl (deg) | ||
| Fe/solar | ||
| Ref Norm | ||
| 1333/1251 | ||
| power law (jet) + | ||
| PL | ||
| power law (corona) | ||
| PL | ||
| 1339/1252 |
4.3 X-ray variability

The EPIC pn light curve is shown in Fig. 4, with the time intervals with low background that were used for the spectral analysis marked in red. The source was only mildly variable during the XMM observation, as suggested by the count rate light curve. The observed fluxes corrected for Galactic absorption are and , in agreement with the Swift-XRT results (see Table 1).
The root-mean-square (RMS) variability spectrum of the observation is shown in Fig. 5, and it is calculated following Vaughan et al. (2003) using light curves with ks bins. The RMS spectrum shows the variability amplitude of the source as a function of energy, corrected for the variance due to measurement errors and normalised by the mean count rate in each energy band. The error bars represent the uncertainty expected from the Poisson noise (Vaughan et al., 2003). Since the flaring background becomes increasingly dominant with energy we plot the RMS spectrum only up to keV (at which energy the ratio of signal to background is about 4). The variability clearly decreases with energy up to around keV, but then starts to increase again. It is interesting to note that this break coincides with the break energy of the broken power law model (see Table 3), since it is consistent with our interpretation that the Seyfert and jet components dominate at low and high energies, respectively (see further Section 7.3). The RMS spectrum presented in Bhattacharyya et al. (2013) has a different energy binning, but exhibits an overall shape that is consistent with our results. While we find that the increase in RMS variability above keV is not affected by our choice of energy binning, it will be important to confirm these results with an observation where the variability analysis can be extended to higher energies.
We further investigated the spectral variability by fitting the broken power law model to spectra extracted in 15 ks intervals (corresponding to 3–7.5 ks of good exposure time per spectrum). Fig. 6 shows the evolution of the best-fit parameters and the flux as a function of time. There are no systematic trends with time and only the flux is found to vary significantly above the 3 level. However, the photon index and are found to be marginally variable ( CL).

4.4 Optical Monitor data
The Optical Monitor (Mason et al., 2011, OM;) on board XMM-Newton is a 30 cm telescope carrying six optical/UV filters, and two grisms. Observations of PMN J09480022 in 2011 May 28–29 consisted of seven subsequent exposures in -band, followed by ten in -band, nine in -band, ten in -band and -band, then five in -band. All optical exposures were 800 s long, while UV exposures were 1600 s and 2700 s long. We used the SAS task omichain to reduce the data and the tasks omsource and omphotom to derive the source magnitude. Average observed magnitudes are: = 18.280.06, = 18.630.02, = 17.640.02, = 17.270.02, = 17.240.03, and = 17.220.11. The difference of 0.2–0.3 mag in the optical filters with respect to the Swift-UVOT observations performed on 2011 May 28 at least partially could be due to the source variability.
5 Ground-based optical and infrared observations
5.1 CRTS
The source has been monitored by the Catalina Real-time Transient Survey (CRTS)22 2 http://crts.caltech.edu (Drake et al., 2009; Djorgovski et al., 2011), using the 0.68 m Schmidt telescope at Catalina Station, AZ, and an unfiltered CCD. The typical cadence is four exposures separated by 10 min in a given night; this may be repeated up to four times per lunation, over a period of 6–7 months each year, while the field is observable. Photometry is obtained using the standard Source-Extractor package (Bertin & Arnouts, 1996), and transformed from the unfiltered instrumental magnitude to Cousins by = + 0.31()2 + 0.04 with a scatter of 0.056 mag 33 3 http://nesssi.cacr.caltech.edu/DataRelease/FAQ2.html#improve. The flux densities collected by CRTS in band are reported in Fig. 7.
5.2 INAOE
NIR observations of PMN J09480022 were performed during 2011 April–May, at the 2.1 m telescope “Guillermo Haro”, with the NIR camera “CANICA” equipped with a Rockwell 1024 1024 pixel Hawaii infrared array, working at 75.4 K, with standard (1.164-1.328 m), (1.485-1.781 m), and (1.944-2.294 m) filters. The plate scale is 0.32 arcsec pixel-1. Observations were carried out in series of 10 dithered frames in each filter. Data sets were co-added after correcting for bias and flat fielding. Flats were obtained from sky frames derived from the dithered ones. Magnitudes in , , and filters are reported in Table 4. The flux densities collected in and band are reported also in Fig. 7.
| Date | J | H | Ks |
| (MJD) | (mJy) | (mJy) | (mJy) |
| 55677.219 | |||
| 55689.243 | – | – | |
| 55693.171 | – | – | |
| 55694.139 | |||
| 55696.181 | – | ||
| 55702.163 | |||
| 55703.139 |
6 Radio observations
6.1 Effelsberg 100 m
The radio spectrum of PMN J09480022 was observed with the Effelsberg 100 m telescope between 2011 May 24 and October 1 within the framework of a Fermi-related monitoring programme of -ray blazars (Fuhrmann et al., 2007, F-GAMMA programme;). The measurements were conducted with the secondary focus heterodyne receivers at 2.64, 4.85, 8.35, 10.45, 14.60, 23.05, and 32.00 GHz. The observations were performed quasi-simultaneously with cross-scans, that is, slewing over the source position, in azimuth and elevation directions, with adaptive numbers of sub-scans for reaching the desired sensitivity (Fuhrmann et al., 2008; Angelakis et al., 2008, for details, see). Corrections for pointing offset, gain, atmospheric opacity, and sensitivity have been applied to the data. The different spectra collected by Effelsberg are represented in Fig. 8.
Radio spectra and fluxes indicate that the source was highly active already in 2011 May 24 (MJD 55705), before the first peak of the -ray activity, followed by a flux decrease and a flattening of the spectrum in 2011 August–October. The spectral index calculated between 8.4 and 32 GHz changes between 0.40.1 and 0.20.1 from 2011 May to October. No significant flux changes were observed at frequencies below 8.4 GHz. This is likely due to opacity effects at the low frequencies. Flux densities at 32 GHz and 14.6 GHz are also shown in Fig. 7.

6.2 Metsähovi
Observations at 37 GHz were made with the 13.7 m Metsähovi radio telescope, which is a radome enclosed paraboloid antenna situated in Finland. The measurements were made with a 1 GHz-band dual beam receiver centred at 36.8 GHz. The observations are ON-ON measurements, alternating between the source and the sky in each feed horn. A typical integration time to obtain one flux density data point is between 1200 and 1400 s. The detection limit at 37 GHz is on the order of 0.2 Jy under optimal conditions. Data points with a signal-to-noise ratio 4 are handled as non-detections. The flux density scale is set by observations of DR 21. Sources NGC 7027, 3C 274 and 3C 84 are used as secondary calibrators. A detailed description of the data reduction and analysis is given in Teräsranta et al. (1998). The error on the flux density includes the contribution from the measurement RMS and the uncertainty of the absolute calibration. Flux densities at 37 GHz are shown in Fig. 7.

6.3 OVRO 40 m
As part of an ongoing blazar monitoring program, the OVRO 40 m radio telescope has observed PMN J09480022 at 15 GHz regularly since the end of 2007 (Richards et al., 2011). This monitoring program includes about 1700 known and likely -ray loud blazars above declination . The sources in this programme are observed in total intensity twice per week with a 4 mJy (minimum) and 3% (typical) uncertainty on the flux densities. Observations were performed with a dual-beam (each 2.5 arcmin FWHM) Dicke-switched system using cold sky in the off-source beam as the reference. Additionally, the source is switched between beams to reduce atmospheric variations. The absolute flux density scale is calibrated using observations of 3C 286, adopting the flux density (3.44 Jy) from Baars et al. (1977). This results in about a 5% absolute scale uncertainty, which is not reflected in the plotted errors. During the OVRO monitoring, the flux density varied from 671 mJy (on MJD 55725; 2011 June 13) to 335 mJy (on MJD 55836; 2011 October 2), as shown in Fig. 7.
6.4 Medicina
PMN J09480022 was observed with the 32 m Medicina radio telescope eight times between 2011 May and October. The new enhanced single-dish control acquisition system, which provides enhanced sensitivity and supports observations with the cross scan technique, was used. Observations were performed at both 5 and 8.4 GHz; the typical on-source time was 1.5 minutes and the flux density was calibrated with respect to 3C 286. Since the signal-to-noise ratio in each scan across the source was low (typically), we performed a stacking analysis of the scans, which allowed us to significantly improve the signal-to-noise ratio and the precision of the measurement. The flux densities at 5 and 8.4 GHz are reported in Table 5. The peak of the flux density was observed by Medicina first at 8.4 GHz on 2011 August 1 (MJD 55774), and then at 5 GHz on August 10 (MJD 55783), about 7-8 weeks after the peak observed at 15 GHz by OVRO. Using the Medicina data at 5 GHz and 8.4 GHz together with the nearest OVRO observation spectral indices of 0.540.04, 0.360.03, and 0.040.06 were measured for 2011 June 12, August 1, and August 10, respectively, suggesting a radio spectral evolution in agreement with the behaviour observed by Effelsberg.
| Date | Date | ||
|---|---|---|---|
| (UT) | (MJD) | (mJy) | (mJy) |
| 2011-June-12 | 55724 | ||
| 2011-July-29 | 55771 | – | |
| 2011-Aug-01 | 55774 | ||
| 2011-Aug-10 | 55783 | ||
| 2011-Sep-08 | 55812 | – | |
| 2011-Sep-22 | 55826 | – | |
| 2011-Oct-13 | 55847 | – | |
| 2011-Nov-16 | 55881 | – |
6.5 MOJAVE: data analysis and results
We investigated the parsec-scale morphology and flux density variability at 15 GHz by means of 5-epoch VLBA data from the MOJAVE programme (Lister et al., 2009). The data sets span the time interval between 2011 February and December, in order to overlap with the Fermi-LAT data. We imported the calibrated uv data into the National Radio Astronomy Observatory AIPS package. In addition to the total intensity images, we produced the Stokes Q and U images, to derive information on the polarized emission. The flux density was derived by means of the AIPS task JMFIT which performs a Gaussian fit on the image plane. Total intensity flux density and polarisation information are reported in Table 6. During some observing epochs we detected a hint of the jet emerging from the core component with a position angle of 30∘ (see Fig. 9 and 10), in agreement with previous works (Doi et al., 2006; Giroletti et al., 2011, e.g.,). In accordance with the flux density observed by OVRO at 15 GHz, a clear decrease of the flux density was observed by MOJAVE from 657 mJy on 2011 May 26 (MJD 55707) to 378 mJy on 2011 December 12 (MJD 55907). In addition, a higher polarized emission () and polarisation percentage was observed on May 26 with respect to December 12 (Table 6). On the other hand, the electric vector position angle (EVPA) of the core does not change significantly, ranging between 25∘ and 67∘.
| Date | Date | EVPA | |||
|---|---|---|---|---|---|
| (UT) | (MJD) | (mJy) | (mJy) | (mJy) (%) | (deg) |
| 2011-02-20 | 55612 | 622 | 3 | 5 (0.8%) | 25 |
| 2011-05-26 | 55707 | 659 | 6 | 13 (2.0%) | 51 |
| 2011-06-24 | 55736 | 665 | 6 | 14 (2.1%) | 49 |
| 2011-09-12 | 55816 | 458 | – | 6 (1.3%) | 44 |
| 2011-12-12 | 55907 | 380 | – | 2 (0.5%) | 67 |


7 Discussion and conclusions
PMN J09480022 is the best studied -ray NLSy1 (Abdo et al., 2009c; Foschini et al., 2012, see e.g.,). Simultaneous multiwavelength observations presented here allow a broad-band characterization of this source, including the first XMM-Newton observation of this NLSy1.
7.1 Behaviour of the light curves
In Fig. 7, we compare the -ray light curve collected by Fermi-LAT in the 0.1–100 GeV energy range to the X-ray (0.3–10 keV), UV ( filter), optical (, , and filters), NIR ( and filters), and radio (37 GHz and 15 GHz) light curves collected by Swift, XMM, CRTS, INAOE, Metsähovi, Effelsberg, and OVRO. Strong variability was observed in rays, with two flaring periods peaked on 2011 June 20 and July 28 and a variability amplitude (calculated as the ratio of maximum to minimum flux) of 10. Such a variability amplitude as well as the rapid flaring episodes and high apparent isotropic -ray luminosity (1048 erg s-1 at the peak) observed in 2011 are typical of FSRQs. During the Swift observations, PMN J0948+0022 was observed in an intermediate X-ray state (0.3–10 keV flux of 3.5–5.910-12 erg cm-2 s-1) between the highest flux observed from this source on 2012 December 30 during a -ray flaring activity (D’Ammando & Orienti, 2013, 12.610-12 erg cm-2 s-1; see) and the low flux observed on 2008 December 8 (Abdo et al., 2009a, 2.210-12 erg cm-2 s-1;). A clear increase of the flux was observed between 2011 June 14 (MJD 55726) and July 2 (MJD 55744), after the -ray flare observed by LAT. The flux increase was accompanied by a hardening of the X-ray spectrum. However, the lack of X-ray data during the peaks of the -ray activity does not allow us to draw conclusions regarding a contemporaneous increase of the activity in X-ray and rays.
The source increased its -band flux by a factor of 3 from 2011 May 15 (MJD 55696) to May 26 (MJD 55707). An increse of flux density between 2011 May 24 and 25 of about 50% in -band was reported by Eggen et al. (2013), with a significant decrease of a factor of 3.5 in two days. These rapid changes are in agreement with the optical intraday variability observed in 2011 March 27–31, with a total amplitude of 0.9 mag during 4 hours on April 1 (Maune et al., 2013). Similar intraday variability has been reported for this source by Liu et al. (2010); Maune et al. (2011); Paliya et al. (2013) and Itoh et al. (2013), indicating a relativistic jet as the most likely origin for the optical emission in PMN J09480022. If this variability is due to the accretion disc, the amplitude variability should be higher during faint states, when the jet activity is lower, and minimised during bright states, as already discussed in Maune et al. (2011). At the time of the optical peak on 2011 May 25 a high optical polarisation percentage (P=12.31%) was observed, with a significant increase with respect to the observation performed in May 24 (P=1.35%) (Eggen et al., 2013). An increase of polarisation percentage from 0.8% on 2011 February 20 to 2.0% on May 26 was also observed in the MOJAVE data (see Section 6.5).
The sparse sampling of the optical and NIR light curves does not allow us to make a detailed comparison with the -ray and radio light curves. However, it is worth noting that an increase of flux density was also observed in NIR in 2011 mid-May (about MJD 55700), with no counterpart in rays. In fact, PMN J09480022 was quite active in -band on 2011 April 26 (MJD 55677), and after a decrease in the following 3 weeks, we observed on 2011 May 22 (MJD 55703) a significant increase by a factor of 4.5 in 24 hours. A similar behaviour seems to be observed in -band, with an increase by a factor of 2.5 on May 22 (MJD 55703). On the other hand, no significant variability was observed in UV during the Swift-UVOT observations, probably due to the accretion disc emission that dilutes the variability in that part of the spectrum.
During the OVRO monitoring the flux density at 15 GHz changed more smoothly than at higher energies, with an amplitude variability of 2 between 670 mJy (2011 June 13; MJD 55725) and 335 mJy (2011 October 2; MJD 55836) and a gradual decrease. A flaring activity seems to start before the first -ray flare, with a peak at about MJD 55700, close to the optical and NIR flare, and a monotonic decreasing trend in the following months at 15 and 37 GHz. In the same way the radio spectra collected by Effelsberg, Medicina, and OVRO showed a significant spectral evolution with a high frequency component dominating the emission in 2011 May. A similar spectral evolution was already reported in Angelakis et al. (2013) for PMN J09480022 and other -ray emitting NLSy1s with variability patterns typical of relativistic jets and thus similar to blazars.
The different behaviour observed in the radio-to-optical and the -ray energy bands could be related to a bending and inhomogeneous jet, as proposed for some blazars (Raiteri et al., 2010; Raiteri et al., 2011, e.g.,), with a variable misalignment between the zone responsible for the radio-to-optical emission and the zone responsible for rays. The change of the viewing angle of the different emitting regions may produce a change of the Doppler factor, with the Doppler boosting of the radio-to-optical emission increasing first, followed by an increase of the Doppler boosting of the -ray emission. This complex behaviour also could be in agreement with the turbulent extreme multi-cells scenario proposed by Marscher (2012). Alternatively, the radio activity could be related to the -ray flaring activity observed in 2010 July–August, but the large delay of about 1 year makes this hypothesis unlikely. The sparse and irregular sampling, especially from NIR to X-rays, does not allow us to test the different scenarios.
7.2 Energetics
The high apparent isotropic -ray luminosity observed for PMN J09480022 in 2011 May–September ( 1.81047 erg s-1) should reflect a small viewing angle with respect to the jet axis and thus high beaming factors, similarly to what is observed for the FSRQs and also for the NLSy1 SBS 08460513 (D’Ammando et al., 2012a; D’Ammando et al., 2013b). This is consistent with the viewing angle of 3∘ used for modeling the SEDs of this source in Foschini et al. (2011); Foschini et al. (2012). On the contrary, most of the radio galaxies detected by the LAT have an apparent isotropic -ray luminosity lower than 1046 erg s-1, suggesting a smaller beaming factor and possibly a different structure of the jet (Abdo et al., 2010). Assuming a BH mass of 108 M⊙ (but see Section 7.5) we obtain an Eddington luminosity of 1.31046 erg s-1. During the 2011 June flare PMN J09480022 reached an apparent isotropic -ray luminosity of Lγ = 8.81047 erg s-1, making the radiative power Lrad = Lγ/ = 3.51045 erg s-1, assuming a quite typical value for this source of = 16 (Foschini et al., 2011; Foschini et al., 2012). This is about 25% of the Eddington luminosity, comparable to the values observed for bright FSRQs detected by LAT (Nemmen et al., 2012, see e.g.,).
7.3 X-ray spectrum
Thanks to the first high quality XMM-Newton observation of PMN J09480022, we are able to study in detail its X-ray spectrum (see Section 4.2). The spectral modelling of the XMM data of PMN J09480022 showed that emission from the jet most likely dominates the spectrum above keV, while the emission from the underlying Seyfert galaxy can be seen at lower energies. Interestingly, the observation of such a component, typical in the X-ray spectra of radio-quiet NLSy1s, is quite unusual in jet-dominated AGNs, even if not unique (Kataoka et al., 2008, e.g., the FSRQ PKS 1510089;). Contrary to what is observed in some blazars (Raiteri et al., 2010, e.g., BL Lacertae;), no excess absorption above the Galactic column density was necessary by the fit for modelling the low-energy part of the spectrum (Grupe et al., 2010). As well as for PKS 1510089, we hypothesize that the emission below 2 keV was mainly due to the soft X-ray excess. However, we cannot distinguish between different models for the soft X-ray emission on a statistical basis. Models where the soft emission is partly produced by blurred reflection, or Comptonisation of the thermal disc emission, or simply a steep power law, all provide good fits to the data. Our reflection model differs substantially from that presented by Bhattacharyya et al. (2013). While we confirm that their model is a good fit to the spectrum, we note that it relies on a high inclination angle of , which is inconsistent with the blazar-like properties of the source, as well as the inclusion of a warm absorber, which is not required in any of the other models. Furthermore, their model does not allow the power law, which illuminates the disc, to also contribute directly to the spectrum.
A blackbody model also gives a comparable fit, but a temperature of kT = 0.18 keV is necessary. Such a high temperature is inconsistent with the standard accretion disc theory (Shakura & Sunyaev, 1973, see e.g.,). Further long-duration X-ray observations with XMM-Newton, Suzaku and NuSTAR, preferably when the source is in a low -ray state, will be needed to place stronger constraints on these models.
Our interpretation that the X-ray emission above 2 keV is produced by the jet is also supported by the RMS spectrum (Fig. 5), which shows a break at 1.7 keV, above which the variability increases with energy. While Seyfert galaxies typically exhibit RMS spectra decreasing with energy above keV (Markowitz et al., 2004; Ponti et al., 2007; Chitnis et al., 2009), the opposite behaviour is often observed in blazars (Ravasio et al., 2004; Gliozzi et al., 2006, e.g.,). It should be noted, however, that there is no one-to-one correlation between the RMS spectrum and AGN type and that RMS spectra often change substantially with time (Gliozzi et al., 2006; Larsson et al., 2008, as seen in e.g.).
The spectrum of PMN J09480022 changed from a steep slope of 2.1 to a much harder one of 1.5 above 1.7 keV. A similar spectrum has also been observed in the XMM observation of the -ray NLSy1 PKS 2004–447 (Gallo et al., 2006). An X-ray spectrum unusually hard for a NLSy1 was observed by Swift-XRT in SBS 0846513 (D’Ammando et al., 2012a; D’Ammando et al., 2013b) and PKS 1502036 (D’Ammando et al., 2013a), two other NLSy1s detected by LAT. Models more complex than the simple power law were not applicable in these cases due to insufficient statistics, in particular below 1–2 keV. Thus the 0.3-10 keV spectra collected by Swift-XRT seem to be dominated by the jet emission.
The small variability amplitude (2) observed in X-rays with respect to the rays (10) could be an indication that the X-ray emission is produced by the low-energy tail of the same electron distribution. On the other hand, the peak flux in X-rays was observed on 2011 July 2 during a period of low -ray activity, suggesting that different mechanisms could be at work in the X-ray and -ray bands (e.g., synchrotron self-Compton and external Compton, respectively). The presence of the soft X-ray excess below 2 keV could dilute the X-ray variability over the 0.3–10 keV energy range, but an amplitude variability of a factor of 2 (with fluxes between 2.1–4.110-12 erg cm-2 s-1) was also observed considering only the 2–10 keV energy range. In this context no obvious relation exists between the soft X-ray excess and the -ray emission. An intriguing possibility is that the excess observed below 2 keV is a signature of the bulk Comptonisation process by a cold relativistic plasma accelerating along the jet and scattering on disc photons reprocessed by the broad-line region (BLR) (Celotti et al., 2007). A dedicated modeling of the source’s SED including XMM-Newton and Fermi-LAT data will be presented in a forthcoming paper.
7.4 Host galaxy
The discovery of a relativistic jet in a class of AGN thought to be hosted in spiral galaxies such as the NLSy1s, as opposed to blazars and radio galaxies hosted in elliptical galaxies (Blandford & Rees, 1978), was a great surprise challenging the current knowledge on how the jet structures are generated and developed (Böttcher & Dermer, 2002; Marscher, 2010, see e.g.,). Unfortunately only very sparse observations of the host galaxies of radio-loud NLSy1s are available and the sample of objects studied by Deo et al. (2006) and Zhou et al. (2006) have redshifts and , respectively, while four out five of the NLSy1s detected in rays have . Among the radio-loud NLSy1s detected up to now by LAT only for the closest one, 1H 0323342, was the host galaxy clearly detected. Observations with the Hubble Space Telescope and Nordic Optical Telescope revealed a one-armed galaxy morphology or a circumnuclear ring, respectively, suggesting two possibilities: the spiral arm of the host galaxy Zhou et al. (2007) or the residual of a galaxy merger Anton et al. (2008). These observations, together with the lack of information about the host galaxy of the other -ray emitting NLSy1s, leaves room for the hypothesis that the NLSy1s detected in rays by LAT could have peculiar host galaxies with respect to the other NLSy1s. Therefore the possibility that the development of relativistic jets in these objects occurs in hosts undergoing strong merger activity, or with non-spiral morphology, cannot be ruled out. Further high-resolution observations of the host galaxies of PMN J09480022 and the other -ray NLSy1s will be fundamental to obtain insights into the onset of production of relativistic jets in these sources.
7.5 BH mass and jet formation
The mechanism for producing a relativistic jet is still unclear. In particular the physical parameters that drive the jet formation are still under debate. One of the key parameters should be the BH mass, with only large masses allowing an efficient jet formation (Sikora et al., 2007, see e.g.,). Therefore one of the most surprising facts related to the discovery of PMN J09480022 was the development of a relativistic jet in an object with a relatively small BH mass, 3.2107 M⊙ (Yuan et al., 2008). Recently, Chiaberge & Marconi (2011) suggested that a BH mass higher than 108 M⊙ is necessary for producing a radio-loud AGN and that the merger history together with the subsequent galaxy morphology plays a fundamental role. In any case, the estimated mass of this source, as well as for the other NLSy1s, has large uncertainties. By means of the broad band SED modeling a BH mass of 1.5108 M⊙ was estimated for PMN J09480022 in Foschini et al. (2011). Marconi et al. (2008) suggested that BLR clouds are subjected to radiation pressure from the absorption of ionizing photons, and by applying a correction to the virial relation we have higher masses for the NLSy1s. Recently, also Calderone et al. (2013) pointed out that the BH masses of the NLSy1s estimated by the modelling of optical/UV data with a Shakura & Sunyaev disc spectrum could be significantly higher than those derived on the basis of single epoch virial methods. In particular, for PMN J09480022 they found a value of 109 M⊙ in agreement with the typical BH mass of blazars. This may solve the problem of the minimum BH mass predicted in different scenarios of relativistic jet formation and development, but introduces a possible new one. For spiral galaxies, the BH mass typically ranges between 106 and 108 M⊙ (Woo & Urry, 2002, see e.g.,). If the BH mass is on the larger side of the estimated values, how is it possible to reconcile such a large BH mass with a spiral galaxy?
A second fundamental parameter for the efficiency of relativistic jet production should be the BH spin, with super-massive black holes (SMBH) in elliptical galaxies having on average much larger spins than SMBHs in disc-spiral galaxies, as proposed in the “modified spin paradigm” (Sikora et al., 2007). This is because the spin evolution of BHs in spiral galaxies seems to be limited by multiple accretion events with random orientation of the angular momentum vectors and small increments of mass, while elliptical galaxies underwent at least one major merger with large matter accretion triggering an efficient spin-up of the SMBHs. Thus, the mass and the spin of the BH seem to be related to the host galaxies, leading to the hypothesis that relativistic jets can efficiently develop only in elliptical galaxy (Böttcher & Dermer, 2002; Marscher, 2010, e.g.). However, the presence of a rapidly spinning BH was inferred by means of X-ray reflection spectroscopy in a few radio-quiet AGNs hosted by spiral/disc galaxies, suggesting that the BH spin is not the only parameter that drives the radio-quiet/radio-loud dichotomy (Reynolds, 2013, see e.g.,).
We noted that BH masses of radio-loud NLSy1s reported in Komossa et al. (2006) and Yuan et al. (2008) are generally larger than those in the entire sample of NLSy1s (MBH (2–10)107 M⊙), even if still smaller than those in radio-loud quasars. The larger BH masses of radio-loud NLSy1s could be related to higher mass accretion events that can spin up the BHs. In the same way the smaller fraction of radio-loud NLSy1s with respect to the radio-loud quasars could be because the high accretion rate regime does not last sufficiently long in all NLSy1s to substantially spin up the central BH Sikora (2009).
Another consideration which is likely to be important for jet formation is the nature of the accretion flow. In particular, a geometrically thick accretion flow is needed in order to create large-scale poloidal magnetic fields, which may play a
dominant role in the launching of jets (Reynolds et al., 2006; Sikora et al., 2013). In cases where standard thin discs are present, the jet
activity may be due to the dissipation of coronal magnetic fields
(Sikora et al., 2013). For PMN J09480022 it is clear that emission from the jet
dominates the X-ray spectrum above 2 keV, while we are likely seeing the
accretion disc plus corona of the AGN at lower X-ray energies. Although we cannot
constrain detailed models for the soft X-ray emission with the current
observations, we note that the spectral slope is similar to that found in radio-quiet NLSy1, indicating that a
standard disc is present as also expected from the high accretion rate. Future
deep X-ray observations with the jet in different states are needed to explore
in detail the connection between the disc and jet in this source.
The presence of a relativistic jet in some radio-loud NLSy1 galaxies, first suggested by their variable radio emission and flat spectra, is now confirmed by the Fermi-LAT detection of five NLSy1s in rays. PMN J09480022 showed all characteristics of the blazar phenomenon with a BH mass of 108–109 M⊙, not much less than those of blazars. The impact on the -ray emission mechanisms of the properties of the central engine in radio-loud NLSy1s, derived from their peculiar optical characteristics, is still under debate. In addition, the detection of relativistic jets in a class of AGN thought to be hosted in spiral galaxies is very intriguing, challenging the theoretical scenario of relativistic jet formation proposed so far. Further multifrequency observations of this object and other -ray emitting NLSy1s will be fundamental for investigating in detail their characteristics over the entire electromagnetic spectrum.
Acknowledgments
The Fermi LAT Collaboration acknowledges generous ongoing support from a number of agencies and institutes that have supported both the development and the operation of the LAT as well as scientific data analysis. These include the National Aeronautics and Space Administration and the Department of Energy in the United States, the Commissariat à l’Energie Atomique and the Centre National de la Recherche Scientifique / Institut National de Physique Nucléaire et de Physique des Particules in France, the Agenzia Spaziale Italiana and the Istituto Nazionale di Fisica Nucleare in Italy, the Ministry of Education, Culture, Sports, Science and Technology (MEXT), High Energy Accelerator Research Organization (KEK) and Japan Aerospace Exploration Agency (JAXA) in Japan, and the K. A. Wallenberg Foundation, the Swedish Research Council and the Swedish National Space Board in Sweden. Additional support for science analysis during the operations phase is gratefully acknowledged from the Istituto Nazionale di Astrofisica in Italy and the Centre National d’Études Spatiales in France.
We thank the Swift team for making these observations possible, the duty scientists, and science planners. The OVRO 40 m monitoring program is supported in part by NASA grants NNX08AW31G and NNX11A043G, and NSF grants AST-0808050 and AST-1109911. This paper is partly based on observations with the 100 m telescope of the MPIfR (Max-Planck-Institut für Radioastronomie) at Effelsberg and the Medicina telescope operated by INAF-Istituto di Radioastronomia. We acknowledge A. Orlati, S. Righini, and the Enhanced Single-dish Control System Development Team. The CSS survey is funded by the National Aeronautics and Space Administration under Grant No. NNG05GF22G issued through the Science Mission Directorate Near-Earth Objects Observations Program. The CRTS survey is supported by the U.S. National Science Foundation under grants AST-0909182. This research has made use of observations obtained with the 2.1 m telescope of the Observatorio Astrofisico Guillermo Haro (OAGH), in the state of Sonora, Mexico, operated by the Instituto Nacional de Astrofisica, Optica y Electronica (INAOE), Mexico. OAGH acknowledges funding from the INAOE Astrophysics Department. The Metsähovi team acknowledges the support from the Academy of Finland to our observing projects (numbers 212656, 210338, 121148, and others). This research made use of data from MOJAVE database that is maintained by the MOJAVE team (Lister et al. 2009). This work is based on observations obtained with XMM-Newton, an ESA science mission with intrument and contributions directly funded by ESA Member States and the USA (NASA). JL acknowledges financial support from the Swedish National Space Board. FD thanks A. Breeveld and P. Roming for useful discussion about OM and UVOT cross-calibration. JL thanks Andy Fabian for useful discussion. We thank the anonymous referee, S. Cutini, S. Digel, and D. Thompson for useful comments and suggestions.
References
- Abdo et al. (2009a) Abdo, A. A., et al. 2009a, ApJ, 699, 976
- Abdo et al. (2009b) Abdo, A. A., et al. 2009b, ApJ, 707, L142
- Abdo et al. (2009c) Abdo, A. A., et al. 2009c, ApJ, 707, 727
- Abdo et al. (2010) Abdo, A. A., et al. 2010, ApJ, 720, 912
- Ackermann et al. (2012) Ackermann, M., et al. 2012, ApJ, 747, 104
- Angelakis et al. (2008) Angelakis, E., Fuhrmann, L., Marchili, N., Krichbaum, T. P., Zensus, J. A. 2008, Mem. Soc. Astron. Ital., 79, 1042
- Angelakis et al. (2013) Angelakis, E., Fuhrmann, L., et al. 2013, proceedings of Nuclei of Seyfert Galaxies and QSOs - Central Engine and Conditions of Star Formation, November 6-8, 2012, Max-Planck-Insitut für Radioastronomie (MPIfR), Bonn, Germany [arXiv:1304.1706]
- Anton et al. (2008) Anton, S., Browne, I. W. A., Marcha, M. J. 2008, AA, 490, 583
- Atwood et al. (2009) Atwood, W. B., et al. 2009, ApJ, 697, 1071
- Baars et al. (1977) Baars, J. W. M., Genzel, R., Pauliny-Toth, I. I. K, Witzel, A. 1977, AA, 61, 99
- Barthelmy et al. (2005) Barthelmy, S. D., et al. 2005, SSRv, 120, 143
- Baumgartner et al. (2013) Baumgartner, W. H., et al. 2013, ApJS, 207, 19
- Bertin & Arnouts (1996) Bertin, E., & Arnouts, S. 1996, A&AS, 117, 393
- Bhattacharyya et al. (2013) Bhattacharyya, S., Bhatt, H., Bhatt, N., Singh, K. K., 2013, submitted to MNRAS [arXiv:1301.1150]
- Bianchi et al. (2009) Bianchi, S., Guainazzi, M., Matt, G., Fonseca Bonilla, N., Ponti, G., 2009, AA, 495, 421
- Blandford Rees (1978) Blandford, R. D., & Rees, M. J. 1978, in BL Lac Objects ed A. M. Wolfe (Univ. Pittsburgh Press), 328
- Boller et al. (1996) Boller, T., Bradt, W. N., & Fink, H. 1996, A&A, 305, 53
- Böttcher & Dermer (2002) Böttcher, M., & Dermer, C. D. 2002, ApJ, 564, 86
- Burrows et al. (2005) Burrows, D. N., et al. 2005, SSRv, 120,165
- Calderone et al. (2013) Calderone, G., Ghisellini, G., Colpi, M., Dotti, M. 2013, MNRAS, 431, 210
- Cash (1979) Cash, W. 1979, ApJ, 228, 939
- Celotti et al. (2007) Celotti, A., Ghisellini, G., Fabian, A. C. 2007, MNRAS, 375, 417
- Chiaberge & Marconi (2011) Chiaberge, A., & Marconi, A. 2011, MNRAS, 416, 917
- Chitnis et al. (2009) Chitnis, V. R., Pendharkar, J. K., Bose, D., Agrawal, V. K., Rao, A. R., Misra, R. 2009, ApJ, 698, 1207
- Crummy et al. (2006) Crummy, J., Fabian, A. C., Gallo, L., Ross, R. R., 2006, MNRAS, 365, 1067
- D’Ammando Ciprini (2011) D’Ammando, F., Ciprini, S. 2011, The Astronomer’s Telegram, 3429
- D’Ammando et al. (2012a) D’Ammando, F., et al . 2012a, MNRAS, 426, 317
- D’Ammando et al. (2012b) D’Ammando, F., et al . 2012b, AIPC, 1505, 570
- D’Ammando Orienti (2013) D’Ammando, F., Orienti, M. 2013, The Astronomer’s Telegram, 4694
- D’Ammando et al. (2013a) D’Ammando, F., et al. 2013a, MNRAS, 433, 952
- D’Ammando et al. (2013b) D’Ammando, F., et al. 2013b, MNRAS, 436, 191
- Deo et al. (2006) Deo, R. P., Crenshow, D. M., Kraemer, S. B. 2006, AJ, 132, 321
- Djorgovski et al. (2011) Djorgovski, S.G., et al. 2011, in The First Year of MAXI: Monitoring Variable X-ray Sources, eds. T. Mihara & N. Kawai, Tokyo: JAXA Special Publ. [arXiv:1102.5004]
- Doi et al. (2006) Doi, A., Nagai, H., Asada, K., et al. 2006, PASJ, 58, 829
- Donato et al. (2001) Donato, D., Ghisellini, G., Tagliaferri, G., Fossati, G., 2001, AA, 375, 739
- Done et al. (2012) Done, C., Davis, S. W., Jin, C., Blaes, O., Ward, M. 2012, MNRAS, 420, 1848
- Drake et al. (2009) Drake, A. J., et al. 2009, ApJ, 696, 870
- Eggen et al. (2013) Eggen, J. R., Miller, H. R., Maune, J. D. 2013, ApJ, 773, 85
- Foschini et al. (2009) Foschini, L., et al. 2009, Adv. Space Res., 43, 889
- Foschini et al. (2011) Foschini, L., et al. 2011, MNRAS, 413, 1671
- Foschini et al. (2012) Foschini, L., et al. 2012, A&A, 548, 106
- Fuhrmann et al. (2007) Fuhrmann, L., Zensus, J. A., Krichbaum, T. P., Angelakis, E., Readhead, A. C. S. 2007, The First GLAST Symposium (AIP Conf. Proc. 921), ed. S. Ritz, P. Michelson, C. A. Meegan (Melville, NY: AIP), 249
- Fuhrmann et al. (2008) Fuhrmann, L. et al. 2008, AA, 490, 1019
- Gallo et al. (2006) Gallo, L. C., et al. 2006, MNRAS, 370, 245
- Gehrels et al. (2004) Gehrels, N., et al. 2004, ApJ, 611, 1005
- Gierlínski & Done (2004) Gierliński, M., & Done, C., 2004, MNRAS, 349, L7
- Giroletti et al. (2011) Giroletti, M., et al. 2011 A&A, 528, L11
- Gliozzi et al. (2006) Gliozzi, M., Sambruna, R. M., Jung, I., Krawczynski, H., Horan, D., Tavecchio, F. 2006, ApJ, 646, 61
- Grupe et al. (2010) Grupe, D., et al. 2010, ApJS, 187, 64
- Ikejiri et al. (2011) Ikejiri, Y., et al. 2011, PASJ, 63, 633
- Itoh et al. (2013) Itoh, R., et al. 2013, ApJ, 775, L26
- Jansen et al. (2001) Jansen F., et al., 2001, A&A, 365, L1
- Kalberla et al. (2005) Kalberla, P. M. W., Burton, W. M., Hartmann, D., Arnal, E. M., Bajaja, E., Morras, R., Pöppel, W. G. L. 2005, AA, 440, 775
- Kataoka et al. (2008) Kataoka, J., et al. 2008, ApJ, 672, 787
- Komossa et al. (2006) Komossa, S., Voges, W., Xu, D., Mathur, S., Adorf, H.-M., Lemson, G., Duschi, W. J., Grupe, D. 2006, AJ, 132, 531
- Landau et al. (1986) Landau, R., et al. 1986, ApJ, 308, 78
- Larsson et al. (2008) Larsson, J., Miniutti, G., Fabian, A. C., Miller, J. M., Reynolds, C. S., Ponti, G. 2008, MNRAS, 384, 1316L
- Lister et al. (2009) Lister, M. L., et al. 2009, AJ, 137, 3718
- Liu et al. (2010) Liu, H., Wang, J., Mao, Y., & Wei, J., 2010, ApJ, 715, L113
- Lucarelli et al. (2011) Lucarelli, F., et al. 2011, The Astronomer’s Telegram, 3448
- Marconi et al. (2008) Marconi, A., Axon, D., Maiolino, R., Nagao, T., Pastorini, G., Pietrini, P., Robinson, A., Torricelli, G. 2008, ApJ, 678, 693
- Markowitz et al. (2004) Markowitz, A., Edelson, R. 2004, ApJ, 617, 939
- Marscher (2010) Marscher, A. 2010, in Lecture Notes in Physics 794, ed. T. Belloni (Berlin:Springer), 173
- Marscher (2012) Marscher, A. P. 2012, 2011 Fermi Symposium proceedings - eConf C110509 [arXiv:1201.5402]
- Mason et al. (2011) Mason, K. O., et al. 2001, A&A, 365, L36
- Massaro et al. (2004) Massaro, E., Perri, M., Giommi, P., Nesci, R. 2004, AA, 413, 489
- Mattox et al. (1996) Mattox, J. R., et al. 1996, ApJ, 461, 396
- Maune et al. (2011) Maune, J. D., Miller, H. R., Eggen, J. R. 2011, Proc. of "Narrow-Line Seyfert 1 Galaxies and their place in the Universe"
- Maune et al. (2013) Maune, J. D., Miller, H. R.; Eggen, J. R. 2013, ApJ, 762, 124
- Nemmen et al. (2012) Nemmen, R. S., Georganopoulos, M., Guiriec, S., Meyer, E. T., Gehrels, N., Sambruna, R. M. 2012, Science, 338, 1445
- Nolan et al. (2012) Nolan, P., et al. 2012, ApJS, 199, 31
- Osterbrock Pogge (1985) Osterbrock, D. E., Pogge, R. W. 1985, ApJ, 297, 166
- Paliya et al. (2013) Paliya, V. S., Stalin, C. S., Kumar, B., Kumar, B., Bratt, V. K., Pandey, S. B., Yadav, R. K. S. 2013, MNRAS, 428, 2450
- Ponti et al. (2007) Ponti, G., Cappi, M., Czerny, B., Goosmann, R. W., Karas, V. 2007, IAUS, 238, 429
- Raiteri et al. (2010) Raiteri, C. M., et al. 2010, AA, 524, 43
- Raiteri et al. (2011) Raiteri, C. M., et al. 2011, AA, 534, 87
- Ravasio et al. (2004) Ravasio, M., Tagliaferri, G., Ghisellini, G., Tavecchio, F. 2004, A&A, 424, 841
- Reynolds et al. (2006) Reynolds, C. S., Garofalo, D., Begelman, M. C. 2006, ApJ, 651, 1023
- Reynolds (2013) Reynolds, C. S. 2013, proceedings of the ISSI-Bern Workshop “The Physics of Accretion onto Black Holes” [arXiv:1302.3260]
- Richards et al. (2011) Richards, J. L., et al. 2011, ApJS, 194, 29
- Roming et al. (2005) Roming, P. W. A., et al. 2005, SSRv, 120, 95
- Ross & Fabian (2005) Ross, R. R., Fabian, A. C., 2005, MNRAS, 358, 211
- Shakura & Sunyaev (1973) Shakura, N. I. & Sunyaev, R. A., A&A, 24, 337
- Sikora et al. (2007) Sikora, M., Stawarz, L., Lasota, J.-P. 2007, ApJ, 658, 815
- Sikora (2009) Sikora, M. 2009, AN, 330, 291
- Sikora et al. (2013) Sikora, M., & Begelman, M. C. 2013, ApJ, 764, L24
- Teräsranta et al. (1998) Teräsranta, H., et al. 1998, A&AS, 132, 305
- Titarchuk (1994) Titarchuk, L., 1994, ApJ, 434, 570
- Vaughan et al. (2003) Vaughan, S. Edelson, R., Warwick, R. S., Uttley, P. 2003, MNRAS, 345, 1271
- Wilms et al. (2000) Wilms, J., Allen, A., McCray, R. 2000, ApJ, 542, 914
- Woo & Urry (2002) Woo, J.-H., & Urry, C. M. 2002, ApJ, 579, 530
- Yuan et al. (2008) Yuan, W., Zhou, H.-Y., Komossa, S., Dong, X.-B., Wang, T.-G., Lu, H. L., Bai, J. M. 2008, ApJ, 685, 801
- Zhou et al. (2003) Zhou, H.-Y., Wang, T.-G., Dong, X.-B., Zhou, Y.-Y., Li, C. 2003, ApJ, 584, 147
- Zhou et al. (2006) Zhou, H.-Y., Wang, T.-G., Yuan, W., Lu, H. L., Dong, X.-B., Wang, J., Lu, Y. 2006, ApJS, 166, 128
- Zhou et al. (2007) Zhou, H.-Y., et al. 2007, ApJ, 658, L13
- Zhou & Zhang (2010) Zhou, H.-Y., & Zhang, S.-N., 2010, ApJL, 713, 11