Potential of LOFT telescope for the search of dark matter
Abstract
Large Observatory For X-ray Timing (LOFT) is a next generation X-ray telescope selected by European Space Agency as one of the space mission concepts within the “Cosmic Vision” programme. The Large Area Detector on board of LOFT will be a collimator-type telescope with an unprecedentedly large collecting area of about in the energy band between 2 and 100 keV. We demonstrate that LOFT will be a powerful dark matter detector, suitable for the search of the X-ray line emission expected from decays of light dark matter particles in galactic halos. We show that LOFT will have sensitivity for dark matter line search more than an order of magnitude higher than that of all existing X-ray telescopes. In this way, LOFT will be able to provide a new insight into the fundamental problem of the nature of dark matter.
I Introduction
The nature of dark matter (DM) is one of the most intriguing questions of modern physics. Mass content of galaxies and galaxy clusters, growth of density fluctuations through the cosmic history, large scale structure of the Universe – all point towards the existence of new substance, the DM, which constitutes some 80% of the total mass content of the Universe [1]. If DM is made of particles, these particles are not among the known ones. Phenomenologically little is known about properties of DM particles:
- –
Their overall density is [1];
- –
- –
- –
DM particles should have become non-relativistic sufficiently early in the radiation-dominated epoch (although a sub-dominant fraction might have remained relativistic much later [8]).
Depending on the nature of interactionof DM particles with ordinary matter today, the DM can have different astrophysical signatures (see e.g. [9, 10]). Two main classes of DM particle candidates are considered: annihilating and decaying.
A lot of attention has been devoted to a class of annihilating DM candidates called weakly interacting massive particles (WIMPs) (see e.g. [11, 12] for review). These hypothetical particles are assumed to interact with ordinary matter with roughly electroweak strength and have masses in GeV to provide the correct DM abundance. Due to their large mass and interaction strength these particles should be stable and astrophysical signature of their annihilation products is an important scientific goal of many cosmic missions [13, 10]. In particular, -rays from DM annihilation are extensively searched with -ray telescopes [14, 15].
There is a large class of DM candidates that interact with the ordinary particles super-weakly (i.e. significantly weaker than neutrinos). These include: extensions of the SM by right-handed neutrinos [16, 17, 18], models with extra dimensions and string-motivated models [19], gravitinos [20, 21], axions [22, 23], axinos [24, 25] (see e.g. [26, 27, 12] for reviews). These candidates are as possible as WIMPs and from many points of view are very compelling. The feeble interaction strength of these DM candidates means that unlike WIMPs: (i) their mass is not restricted to the GeV region; and (ii) they can decay into the SM particles. The fermionic DM candidates (such as sterile neutrino, gravitino, axino) posses a 2-body radiative decay channel: , while bosonic DM candidates (such as e.g. axion or Majoron) can decay into two photons. These 2-body decays produce photons with energy . The cosmologically long lifetime makes the intrinsic width of such a line negligible. This provides a clear observational signature of decaying DM candidates: a narrow spectral line in spectra of DM-dominated objects, correlated with DM density distribution.
Search of the DM decay signal in the keV–MeV mass range was conducted using XMM-Newton [28, 29, 30, 31, 32, 33, 34], Chandra [35, 36, 37, 38, 39, 40], Suzaku [41, 42], Swift [43], INTEGRAL [44, 45] and HEAO-1 [28] cosmic missions, as well as rocket-borne X-ray microcalorimeter [46]. Observations of extragalactic diffuse X-ray background [28, 47]; galaxy clusters [29, 36, 37]; Milky Way, Andromeda (M31) and Triangle (M33) galaxies [47, 31, 29, 30, 32, 45, 44]; dwarf spheroidal satellites of the Milky Way [30, 46, 40, 38, 41, 34, 42] allowed to put important constraints on particle physics parameters, establishing lower bounds on decaying DM lifetime to be at least 8 orders of magnitude longer than the age of the Universe [5] (see also [7] for extension for higher energies). Table 1 summarizes existing works that put bounds on decaying DM from observations of individual objects. In this Table, we do not mention the claim [48] that the intensity of the Fe XXVI Lyman- line at , observed in [49] cannot be explained by standard ionization and recombination processes, and that the dark matter decay may be a possible explanation of this apparent excess. Spectral resolution of current missions does not allow to reach any conclusion. However, barring an exact coincidence between energy of decay photon and Fe XXVI Lyman-, this claim may be tested with the new missions, discussed in e.g. [50].
| Ref. | Object | Instrument | Cleaned exp, ks |
|---|---|---|---|
| [28] | Diffuse X-ray background | HEAO-1, XMM-Newton | 224, 1450 |
| [29] | Coma & Virgo galaxy clusters | XMM-Newton | 20, 40 |
| [30] | Large Magellanic Cloud | XMM-Newton | 20 |
| [35] | Milky Way halo | Chandra/ACIS-S3 | Not specified |
| [31] | M31 (central ) | XMM-Newton | 35 |
| [36] | Abell 520 galaxy cluster | Chandra/ACIS-S3 | 67 |
| [32] | Milky Way halo, Ursa Minor dSph | XMM-Newton | 547, 7 |
| [47] | Milky Way halo | Chandra/ACIS | 1500 |
| [37] | Galaxy cluster 1E 0657-56 (“Bullet”) | Chandra/ACIS-I | 450 |
| [46] | Milky Way halo | X-ray microcalorimeter | 0.1 |
| [44] | Milky Way halo | INTEGRAL/SPI | 5500 |
| [33] | M31 (central ) | XMM-Newton/EPIC | 130 |
| [45] | Milky Way halo | INTEGRAL/SPI | 12200 |
| [41] | Ursa Minor | Suzaku/XIS | 70 |
| [38] | Draco dSph | Chandra/ACIS-S | 32 |
| [39] | Willman 1 | Chandra/ACIS-I | 100 |
| [40] | M31, Fornax, Sculptor | XMM-Newton/EPIC , Chandra/ACIS | 400, 50, 162 |
| [51] | Willman 1 | Chandra/ACIS-I | 100 |
| [43] | Segue 1 | Swift/XRT | 5 |
| [52] | M33 | XMM-Newton/EPIC | 20-30 |
| [53] | M31 ( off-center) | Chandra/ACIS-I | 53 |
| [34] | Willman 1 | XMM-Newton | 60 |
| [42] | Ursa Minor, Draco | Suzaku/XIS | 200, 200 |
In what follows we argue that a next-generation X-ray mission Large Observatory For x-ray Timing (LOFT) will provide a crucial improvement in the sensitivity for the search of decaying DM in X-rays. LOFT mission is under a study at the European Space Agency (ESA) as one of the five medium mission candidates for the launch after 2020 in the framework of the “Cosmic Vision” program of ESA. Further details on the LOFT mission could be found at http://www.isdc.unige.ch/loft/. We also show that LOFT will have a capability to explore almost the entire parameter space of one of the most often discussed models of decaying DM, the neutrino minimal extension of the Standard Model of particle physics (MSM) [17] if converted into a dedicated DM detection experiment (e.g. toward the end of the mission) aimed at ultra-deep exposure of the most favourable (massive, relatively compact) nearby DM halo.
II Strategy of searching for decaying dark matter
The number of photons from DM decay is proportional to the DM column density (integrated DM distribution along the line of sight) and not to the (as in the case of the annihilating DM). As it turns out, this signal is very weakly dependent on the virial mass of the DM halo and on the assumed dark matter density profile [30, 54, 55]. Moreover, for objects that cover the whole field of view of the telescope, the expected DM decay flux is independent on the distance to the object. As a result a vast variety of DM-dominated objects (nearby galaxies and galaxy clusters) produce a comparable decay signal. Therefore
(i) one has a freedom of choosing the observational targets, avoiding complicated astrophysical backgrounds; (ii) if a candidate line is found, its surface brightness profile may be measured, distinguished from known atomic lines and compared among several objects with the same expected signal (see e.g. [40]). This allows to distinguish the decaying DM line from astrophysical backgrounds.The case of the astrophysical search for decaying DM has been presented in the recent White Papers [56, 57].
With intrinsic width of the decay line being negligible, its broadening is determined entirely by the virial velocity of DM particles, confined to in a halo: . This number ranges from for galaxy clusters to for dwarf spheroidal galaxies. The spectral resolution of modern X-ray instruments is insufficient to resolve this line (with an exception of INTEGRAL’s spectrometer SPI, see [45]). The narrow line is detected on top of a continuum background. This background has two main contributions – astrophysical and instrumental. The astrophysical background is a continuum thermal and non-thermal emission form the source medium: interstellar/intraclusted medium of galaxies and galaxy clusters, and from the set of isolated sources, like X-ray binaries situated in the source host galaxy or galaxy cluster plus the Cosmic X-ray background (CXB) [58] within the instrument’s Field-of-View (FoV). The instrumental background is produced by the charged particles passing through the detector and by the electronic noise. The line signal is centered on the reference line energy and is smeared over the energy range where is a spectral resolution. The amount of background accumulated in this energy bin is proportional to the bin width . Thus, improvement of the energy resolution results in the decrease of the background and, as a consequence, improvement of the sensitivity of the instrument for the line detection.
The significance of the line signal from a diffuse source increases with the collection area of the detector. It is proportional to the product of the effective area, on the solid angle subtended by the FoV (for those DM halos that have angular size larger than the FoV) that is to the “grasp” of the instrument [46]. Comparison of potential of different instruments for the detection of DM decay line could be conveniently presented in terms of “energy resolution vs. grasp” diagram [46], as shown in Fig. 1.

In this figure, the inclined lines show the “equal sensitivity” sets of instrumental characteristics. Indeed, the signal-to-noise ratio for the DM decay line sensitivity improves as , so that the lines “grasp”“energy resolution” correspond to instruments which provide the same signal-to-noise ratio if they operate in the same energy band. One could define as a “figure of merit” for the weak line search, see e.g. [59]. We have arbitrarily fixed for the parameter choice corresponding to the averaged over the energy band characteristics of the EPIC camera of the XMM-Newton telescope [46].
The comparison shown in Fig. 1 adopts an assumption that the level of background in different instruments is comparable. This is true if the background on top of which the DM signal is searched is the CXB. However, if the background is of instrumental nature, the comparison of different instruments has to include an additional parameter, which is the level of background. We include this parameter in our considerations below.
| Parameter | Requirement | Goal |
|---|---|---|
| Energy range | 2–30 keV | 1–40 keV |
| 2–80 keV [60, 61] | 1–80 keV [61] | |
| Eff. area | 12.0 m2 (2–10 keV) | 15 m2 (2–10 keV) |
| 1.3 m2 (@30 keV) | 2.5 m2 (@30 keV) | |
| E | 260 eV | 180 eV |
| (FWHM, @6 keV) | ||
| FoV (FWHM) | 60 arcmin | 30 arcmin |
III LOFT characteristics relevant for DM detection
The main instrument on board of LOFT will be the Large Area Detector (LAD). LAD will be an X-ray telescope with effective collection area m2 (see Fig. 3) sensitive in the 2-80 keV energy range [60]. LAD will be composed of the Silicon Drift Detectors (SDD) with energy resolution below 300 eV. The SDDs will be covered by microchannel plate collimators providing the Field of View of in the energy range below keV and becoming increasingly transparent to X-rays at higher energies up to 80 keV [60, 61].
The energy resolution, of LAD is determined by the characteristics of the silicon detectors and of the detector electronics [60]. Using the response functions of the LOFT satellite11 1 Available at [62]., we simulated narrow line at different energies and then approximated the obtained spectrum by the Gaussian profile (see left panel of the Fig. 2). The obtained best-fit value of Gaussian dispersion is then used to calculate FWHM. The results are shown in the right in Fig. 2. They can be approximated as a linear function of energy:
| (1) |
Our analysis considers two possible LOFT configurations22 2 http://www.isdc.unige.ch/loft: “Requirements” and “Goal”. Parameters of each configuration are summarised in Table 2.


IV Sensitivity for the DM line detection
IV.1 Signal from extended sources in the field of view of collimator
We begin with an estimate of the sensitivity of the LAD detector for weak diffuse lines in the energy range below 30 keV where the collimator limits the FoV to . To this end we take the background spectrum shown in Fig. 4, and compute the number of background photons in the bin with the size equal to FWHM over the time chosen to be 100 ksec (a typical timescale of a single observation). We then estimate the upper limits on the line flux in each narrow energy, based on the statistical error on the background counts:
| (2) |
(an additional was included, because we assumed that we are subtracting observations from a background with comparable statistics).
The upper limit calculated in this way is shown in Fig. 5. One could see that this limit is better than that derived from an XMM-Newton exposure of the same duration. This demonstrates that in spite of somewhat higher background level of the LAD detector (contrary to XMM-Newton it includes the CXB scatterd by the collimator walls), the upper limit on the line flux within the FoV is better. The obvious reason for this is much larger effective area of the detector. Further improvement of sensitivity of LAD, compared to XMM-Netwon (not reflected by the figure) is that LAD collects larger DM line signal in a similar exposure. This is due to the larger FoV.
IV.2 Signal from the Milky Way halo visible for a “bare detector”
At energies above keV, the collimator of the LAD will be not able to stop photons falling at large incidence angle, so that LAD increasingly becomes a “naked detector” sampling photons from large, steradian scale FoV. Such a design is optimal for the search of diffuse emission from the Milky Way halo [46, 57]. The DM signal is accumulated in all the pointings of the telescope, no matter where the pointing is directed. This allows to achieve extremely long exposures in a multi-year operation of the telescope. It is not possible to estimate what will be the effective field of view of the LAD detector at these energies. As an estimate we take . We remind that the sensitivity estimate, , scales as .
In the case of an all-sky source, it is a challenge to distinguish the real source signal from an instrumental feature, such as the instrumental atomic or nuclear line, which is also expected to appear in all pointings. However, a clear observational signature of the real DM decay signal is the excess toward the Galactic Centre (GC). This signature is readily identifiable and could be used to discriminate the real signal from the instrumental noise. This approach was used in [45]. The authors of this reference were able to identify for example the 511 keV from the positron annihilation in the Galactic Centre region. It was also demonstrated that no other (instrumental) line present in the all-sky exposure has surface brightness profile (as a function of off GC-angle) expected for DM decay line. This allowed the authors of [45] to derive constraints on the DM line flux in the 20 keV – 7 MeV energy range using the SPI instrument of INTEGRAL as a wide-field (steradian FoV) detector.
The same approach could be adopted to the LAD data above keV where the instrument works as a wide FoV detector. The main difference with the calculations of the previous section is that the central part of the Milky Way is a bright X-ray source. The emission from this source is the sum of emission from high mass and low mass X-ray binaries and cataclysmic variables. Measurement of the collective emission from the Milky Way sources within a steradian scale FoV by SPI [63] provides a reference value for the level of sky background on top of which the DM line signal from the Milky Way should be detected
| (3) |
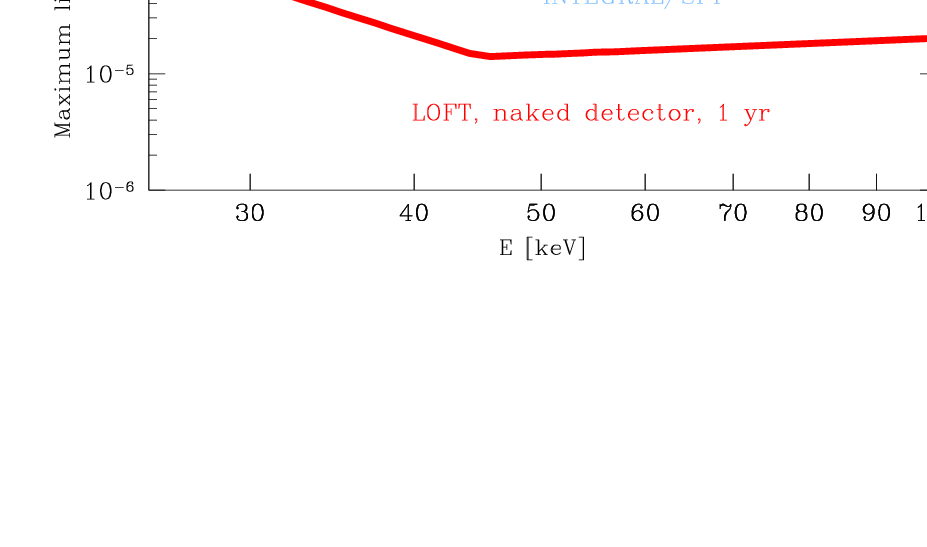
The limits calculated for the background level (3) and a year-long exposure time are shown in Fig. 6. For comparison, the same figure shows the upper limit on the line flux within a steradian FoV of SPI found by [45]. One could see that, in accordance with the expectations, the limits which would be derived from the LAD data are tighter than those from the SPI.
IV.3 Limits on the decaying DM lifetime
To convert the limits on the line flux into the limits on the lifetime of the decaying DM, , we note that flux in line (in photons per per sec) is given by
| (4) |
where the first term is determined by the basic properties of DM particles, while the second one is the characteristic of the object being observed.
For nearby objects that cover the whole FoV of the instrument one can express
| (5) |
where is the average DM column density in a given direction. This quantity changes very little among objects of different masses and sizes [30, 55, 54] and its typical values are . Using this fact and taking into account that for 2-body decays the mass of DM is related to the energy of emitted photon via , we convert the upper bound on the flux limit into the lower limit on decaying DM lifetime:
| (6) | |||||
From Fig. 5 one sees that the upper limits on the line flux is expected to be at the level of . Substituting these values into (4) one finds the sensitivity of the LAD detector at the level – at least an order of magnitude better than existing bounds at these energies. This limit is shown in Fig. 7 as a function of energy. To estimate the sensitivity in the ”naked detector” mode, we assume that the FoV of the detector grows as a powerlaw in the 20-40 keV energy range. Detailed simulations are needed to get a more precise estimate of the opening of the FoV with increasing energy.

V Implications for sterile neutrino DM models
Sterile neutrino is a decaying DM candidate that had recently attracted a lot of attention (see e.g. [64, 65, 50, 66] for review). Sterile neutrino is a right-chiral counterpart of the ordinary (left-chiral) neutrinos . Adding these particles to the SM Lagrangian makes neutrinos massive and provides a simple and elegant explanation of the observed neutrino flavor oscillations and of the smallness of neutrino masses (the so-called “type I see-saw model”) [67, 68, 69, 70]. These particles are neutral with respect to all Standard Model interactions (weak, strong and electromagnetic) (see e.g. [71, 50] for details). They interact with the matter only via mixing with ordinary neutrinos and in this way effectively participate in weak reactions [50] with strongly suppressed rate (as compared to the ordinary neutrinos). Production of such particles in the primordial plasma [16, 72, 73, 74, 75] and their decays are controlled by the same parameter – sterile neutrino mixing angle inversely proportional to their lifetime:
| (7) | |||||
To be a DM candidate, the interaction strength of sterile neutrinos should be too feeble to make any sizable contribution to active neutrino masses [76].
The MSM model provides an explanation to three known ”beyond Standard Model” of particle physics phenomena: dark matter, baryon asymmetry of the Universe and neutrino masses, adding three sterile neutrinos to the Standard Model particle content [17, 77]. The lightest of the three sterile neutrinos served as the DM. The combination of X-ray bounds, of primordial abundance results in both upper and lower bounds on the mass and mixing angle of DM sterile neutrino in the MSM. The range of allowed masses of sterile neutrino DM is [45, 64, 50].
The estimates of the bound on the DM sterile neutrino mixing angle expected from LOFT observations are shown in Fig. 8. Interestingly, the“Requirements” configuration of LOFT is expected to provide the best constraints. This is mostly due to the fact that the “Goal” configuration is optimized for point sources and therefore LAD FoV is reduced from to . This reduces 4 times the expected signal from DM decays (provided the DM column density is constant across the FoV) while the background level reduced only slightly.
One could see that LOFT will be able to explore significant fraction of the available range of the mixing angles within MSM. Already one 1 Ms long exposure of a dSph galaxy like Ursa Minor will improve the existing bounds on by two orders of magnitude. Moreover, taking into account importance of the DM nature problem, and the unique characteristics of LOFT, which make it an excellent DM detector, one could imaging a scenario in which the LAD instrument might be operated as a dedicated DM detector (e.g. toward the end of the mission), accumulating a total year scale exposure of a nearby DM halo. This would allow a further boost of sensitivity of the detector by a an order of magnitude. In this case LOFT will provide an almost full test of the MSM and either discover the sterile neutrinos or possibly leave only a narrow window of mass keV keV, where the Ly- bound suffers from some uncertainties [64], unexplored. To probe the mass range below 4 keV, one might use the LAD data in the energy range below 2 keV. It is clear that the quality of the data in this range is significantly degraded. However, taking into account the unique possibility to explore the full allowed parameter space of a viable DM model (to find the DM or rule out the model) might serve as a good motivation for the challenging task of data analysis in this energy range.

VI Conclusions
We have shown that LOFT will be a powerful detector of light decaying DM. From Figs. 7, 8 it is clear that LOFT will be one-two orders of magnitude imore sensitive for the detection of DM line in the DM mass range 4-200 keV than all ongoing and past missions. This will provide a qualitatively new insight into the nature of the DM particles within various WDM scenarios, including the most popular one with sterile neutrino DM. Significant improvement is also expected at the highest energies above 30 keV, where the LAD instrument becomes a “naked detector” with the steradian-scale FoV. Such a configuration proves to be optimal for search of diffuse all-sky signal from DM decaying in the Milky Way halo (c.f. [46, 57]).
The energy range of LOFT is crucially important for testing the reference MSM model. This is clear from Fig. 8. If operated as a dedicated DM search experiment, LOFT will be able to probe almost all parameter space of MSM.
References
- [1] P. Ade et al. (Planck Collaboration) (2013), eprint 1303.5076.
- [2] S. Tremaine and J. E. Gunn, Phys. Rev. Lett. 42, 407 (1979).
- [3] J. Madsen, Physical Review Letters 64, 2744 (1990).
- [4] J. Madsen, Phys. Rev. D 44, 999 (1991).
- [5] A. Boyarsky and O. Ruchayskiy (2008), eprint 0811.2385.
- [6] G. Bertone, W. Buchmuller, L. Covi, and A. Ibarra, JCAP 0711, 003 (2007), eprint 0709.2299.
- [7] R. Essig, E. Kuflik, S. D. McDermott, T. Volansky, and K. M. Zurek (2013), eprint 1309.4091.
- [8] A. Boyarsky, J. Lesgourgues, O. Ruchayskiy, and M. Viel, JCAP 0905, 012 (2009a), eprint 0812.0010.
- [9] M. Cirelli, Pramana 79, 1021 (2012), eprint 1202.1454.
- [10] S. Profumo (2013), eprint 1301.0952.
- [11] G. Bertone, D. Hooper, and J. Silk, Phys. Rept. 405, 279 (2005), eprint hep-ph/0404175.
- [12] J. L. Feng, ARA&A 48, 495 (2010), eprint 1003.0904.
- [13] L. E. Strigari (2012), eprint 1211.7090.
- [14] A. e. a. Abramowski, Physical Review Letters 110, 041301 (2013), eprint 1301.1173.
- [15] Fermi-LAT Collaboration, ArXiv e-prints (2013), eprint 1305.5597.
- [16] S. Dodelson and L. M. Widrow, Phys. Rev. Lett. 72, 17 (1994), eprint hep-ph/9303287.
- [17] T. Asaka, S. Blanchet, and M. Shaposhnikov, Phys. Lett. B631, 151 (2005), eprint hep-ph/0503065.
- [18] M. Lattanzi and J. W. F. Valle, Phys. Rev. Lett. 99, 121301 (2007), eprint 0705.2406.
- [19] J. P. Conlon and F. Quevedo, JCAP 0708, 019 (2007), eprint 0705.3460.
- [20] F. Takayama and M. Yamaguchi, Phys. Lett. B485, 388 (2000), eprint hep-ph/0005214.
- [21] W. Buchmuller, L. Covi, K. Hamaguchi, A. Ibarra, and T. Yanagida, JHEP 03, 037 (2007), eprint hep-ph/0702184.
- [22] P. Sikivie, Lect.Notes Phys. 741, 19 (2008), eprint astro-ph/0610440.
- [23] M. Kawasaki and K. Nakayama (2013), eprint 1301.1123.
- [24] L. Covi, H.-B. Kim, J. E. Kim, and L. Roszkowski, JHEP 05, 033 (2001), eprint hep-ph/0101009.
- [25] K.-Y. Choi, J. E. Kim, and L. Roszkowski (2013), eprint 1307.3330.
- [26] M. Taoso, G. Bertone, and A. Masiero, JCAP 0803, 022 (2008), eprint 0711.4996.
- [27] F. D. Steffen, Eur.Phys.J. C59, 557 (2009), eprint 0811.3347.
- [28] A. Boyarsky, A. Neronov, O. Ruchayskiy, and M. Shaposhnikov, MNRAS 370, 213 (2006a), eprint astro-ph/0512509.
- [29] A. Boyarsky, A. Neronov, O. Ruchayskiy, and M. Shaposhnikov, Phys. Rev. D 74, 103506 (2006b), eprint astro-ph/0603368.
- [30] A. Boyarsky, A. Neronov, O. Ruchayskiy, M. Shaposhnikov, and I. Tkachev, Phys. Rev. Lett. 97, 261302 (2006c), eprint astro-ph/0603660.
- [31] C. R. Watson, J. F. Beacom, H. Yuksel, and T. P. Walker, Phys. Rev. D74, 033009 (2006), eprint astro-ph/0605424.
- [32] A. Boyarsky, J. Nevalainen, and O. Ruchayskiy, A&A 471, 51 (2007a), eprint astro-ph/0610961.
- [33] A. Boyarsky, D. Iakubovskyi, O. Ruchayskiy, and V. Savchenko, MNRAS 387, 1361 (2008), eprint arXiv:0709.2301.
- [34] M. Loewenstein and A. Kusenko, Astrophys.J. 751, 82 (2012), eprint 1203.5229.
- [35] S. Riemer-Sørensen, S. H. Hansen, and K. Pedersen, ApJ 644, L33 (2006), eprint arXiv:astro-ph/0603661.
- [36] S. Riemer-Sørensen, K. Pedersen, S. H. Hansen, and H. Dahle, Phys. Rev. D 76, 043524 (2007), eprint arXiv:astro-ph/0610034.
- [37] A. Boyarsky, O. Ruchayskiy, and M. Markevitch, ApJ 673, 752 (2008a), eprint astro-ph/0611168.
- [38] S. Riemer-Sørensen and S. H. Hansen, A&A 500, L37 (2009).
- [39] M. Loewenstein and A. Kusenko, Astrophys. J. 714, 652 (2010), eprint 0912.0552.
- [40] A. Boyarsky, O. Ruchayskiy, M. G. Walker, S. Riemer-Sørensen, and S. H. Hansen, Mon.Not.Roy.Astron.Soc. 407, 1188 (2010a), eprint 1001.0644.
- [41] M. Loewenstein, A. Kusenko, and P. L. Biermann, ApJ 700, 426 (2009), eprint 0812.2710.
- [42] A. Kusenko, M. Loewenstein, and T. T. Yanagida, ArXiv e-prints (2012), eprint 1209.6403.
- [43] N. Mirabal, MNRAS 409, L128 (2010), eprint 1010.4706.
- [44] H. Yuksel, J. F. Beacom, and C. R. Watson, Phys. Rev. Lett. 101, 121301 (2008), eprint 0706.4084.
- [45] A. Boyarsky, D. Malyshev, A. Neronov, and O. Ruchayskiy, MNRAS 387, 1345 (2008b), eprint 0710.4922.
- [46] A. Boyarsky, J. W. den Herder, A. Neronov, and O. Ruchayskiy, Astropart. Phys. 28, 303 (2007b), eprint astro-ph/0612219.
- [47] K. N. Abazajian, M. Markevitch, S. M. Koushiappas, and R. C. Hickox, Phys. Rev. D 75, 063511 (2007), eprint arXiv:astro-ph/0611144.
- [48] D. Prokhorov and J. Silk, ApJ 725, L131 (2010), eprint 1001.0215.
- [49] K. Koyama, Y. Hyodo, T. Inui, H. Nakajima, H. Matsumoto, T. G. Tsuru, T. Takahashi, Y. Maeda, N. Y. Yamazaki, H. Murakami, et al., PASJ 59, 245 (2007), eprint arXiv:astro-ph/0609215.
- [50] A. Boyarsky, D. Iakubovskyi, and O. Ruchayskiy, Phys. Dark Univ. 1, 136 (2012).
- [51] N. Mirabal and D. Nieto, ArXiv e-prints (2010), eprint 1003.3745.
- [52] E. Borriello, M. Paolillo, G. Miele, G. Longo, and R. Owen, MNRAS 425, 1628 (2012), eprint 1109.5943.
- [53] C. R. Watson, Z. Li, and N. K. Polley, JCAP 3, 18 (2012), eprint 1111.4217.
- [54] A. Boyarsky, O. Ruchayskiy, D. Iakubovskyi, A. V. Maccio’, and D. Malyshev (2009b), eprint 0911.1774.
- [55] A. Boyarsky, A. Neronov, O. Ruchayskiy, and I. Tkachev, Phys. Rev. Lett. 104, 191301 (2010b), eprint 0911.3396.
- [56] K. N. Abazajian (2009), white paper submitted to the Astro 2010 Decadal Survey, Cosmology and Fundamental Physics Science, eprint 0903.2040.
- [57] A. Boyarsky, J. W. den Herder, O. Ruchayskiy, et al. (2009c), a white paper submitted in response to the Fundamental Physics Roadmap Advisory Team (FPR-AT) Call for White Papers, eprint 0906.1788.
- [58] E. Churazov, R. Sunyaev, M. Revnivtsev, S. Sazonov, S. Molkov, S. Grebenev, C. Winkler, A. Parmar, A. Bazzano, M. Falanga, et al., A&A 467, 529 (2007), eprint arXiv:astro-ph/0608250.
- [59]
Http://space.mit.edu/home/nss
/Jelle_Kaastra_ixo_spextroscopy.pdf. - [60] M. Feroci, L. Stella, M. van der Klis, T. J.-L. Courvoisier, M. Hernanz, R. Hudec, A. Santangelo, D. Walton, A. Zdziarski, D. Barret, et al., Experimental Astronomy 34, 415 (2012), eprint 1107.0436.
- [61] S. Zane, D. Walton, T. Kennedy, M. Feroci, J.-W. Den Herder, M. Ahangarianabhari, A. Argan, P. Azzarello, G. Baldazzi, D. Barret, et al., A large area detector proposed for the large observatory for x-ray timing (loft) (2012), URL http://dx.doi.org/10.1117/12.925156.
- [62]
Http://www.isdc.unige.ch/loft/index.php/
preliminar-response-files-and-simulated-background. - [63] E. Churazov, S. Sazonov, S. Tsygankov, R. Sunyaev, and D. Varshalovich, MNRAS 411, 1727 (2011), eprint 1010.0864.
- [64] A. Boyarsky, O. Ruchayskiy, and M. Shaposhnikov, Ann. Rev. Nucl. Part. Sci. 59, 191 (2009d), eprint 0901.0011.
- [65] A. Kusenko, Phys. Rept. 481, 1 (2009), eprint 0906.2968.
- [66] M. Drewes, Int.J.Mod.Phys. E22, 1330019 (2013), eprint 1303.6912.
- [67] P. Minkowski, Phys. Lett. B67, 421 (1977).
- [68] P. Ramond (1979), eprint hep-ph/9809459.
- [69] R. N. Mohapatra and G. Senjanovic, Phys. Rev. Lett. 44, 912 (1980).
- [70] T. Yanagida, Prog. Theor. Phys. 64, 1103 (1980).
- [71] K. Abazajian, M. Acero, S. Agarwalla, A. Aguilar-Arevalo, C. Albright, et al. (2012), eprint 1204.5379.
- [72] X.-d. Shi and G. M. Fuller, Phys. Rev. Lett. 82, 2832 (1999), eprint astro-ph/9810076.
- [73] K. Abazajian, G. M. Fuller, and M. Patel, Phys. Rev. D64, 023501 (2001), eprint astro-ph/0101524.
- [74] T. Asaka, M. Laine, and M. Shaposhnikov, JHEP 06, 053 (2006), eprint hep-ph/0605209.
- [75] T. Asaka, M. Laine, and M. Shaposhnikov, JHEP 01, 091 (2007), eprint hep-ph/0612182.
- [76] A. Boyarsky, A. Neronov, O. Ruchayskiy, and M. Shaposhnikov, JETP Letters pp. 133–135 (2006d), eprint hep-ph/0601098.
- [77] T. Asaka and M. Shaposhnikov, Phys. Lett. B 620, 17 (2005), eprint arXiv:hep-ph/0505013.